Abstract
Urban informal settlements are often under-recognized in national and regional surveys. A lack of quality intra-urban data frequently contributes to a one-size-fits-all public health intervention and clinical strategies that rarely address the variegated socioeconomic disparities across and within different informal settlements in a city. The 2010 Brazilian census gathered detailed population and place-based data across the country's informal settlements. Here, we examined key socio-demographic and infrastructure characteristics that are associated with health outcomes in Rio de Janeiro with the census tract as the unit of analysis. Many of the city's residents (1.39 million people, 22 % of the population) live in informal settlements. Residents of census tracts in Rio de Janeiro's urban informal areas are younger, (median age of 26 versus 35 years in formal settlements), and have less access to adequate water (96 versus 99 % of informal households), sanitation (86 versus 96 %), and electricity (67 versus 92 %). Average per household income in informal settlement census tracts is less than one third that of non-informal tracts (US\$708 versus US\$2362). Even among informal settlements in different planning areas in the same city, there is marked variation in these characteristics. Public health interventions, clinical management, and urban planning policies aiming to improve the living conditions of the people residing in informal settlements, including government strategies currently underway, must consider the differences that exist between and within informal settlements that shape place-based physical and social determinants of health.
Keywords: Slum, Favela, Informal settlement, Census, Social health determinant, Spatial health determinant, Rio de Janeiro, Brazil
Introduction
Urban informal settlements are characterized by a combination of concentrated poverty, insecure and poor-quality housing, political disenfranchisement, and a lack of access to essential life-supporting services such as clean water, sanitation, and healthcare.1 These slum-defining conditions contribute to a wide variety of adverse health outcomes.2 Yet, globally, few cities report quality intra-urban health determinants in combination with health outcomes for small geographic units. This data gap is profound when comparing slum and non-slum populations in different areas of the same city or multiple cities in the same country. For example, neither the Demographic and Health Survey, nor the 2010 Global Burden of Disease (GBD) study capture intra-urban variation of health determinants or gather specific data in urban informal areas.3,4
In 2010, Brazil's decennial census incorporated novel methodology that intended to rigorously and explicitly identify informal settlements, providing us with the opportunity to disaggregate the collected data for the comparison of population and residential characteristics that influence health outcomes within and outside the informal settlements.
Here, we describe some aspects of Rio de Janeiro's informal settlements by disaggregating census data to identify distinct differences among and between these communities. This is an important, albeit incomplete, data set that can help address the specific recommendation of the Roundtable of Urban Living Environment Research commission, which proposed in 2011 that data describing social determinants of health disaggregated by population groups that are defined by socioeconomic status, gender, or place are essential in order to uncover and address health inequities.5
Due to this lack of quality information, many drivers of health disparities within and between these communities are frequently unrecognized or over generalized.6–8 A comprehensive understanding of the extent of the differences in social health determinants in urban settings has implications for the entire urban population: neighborhood-specific data promotes the development of place-specific policy measures designed to mitigate the drivers of disease disparities.9 Further, programs designed to address urban health disparities where we work, live, and play have a greater effect on health outcomes than interventions directed only at the population level or those focused on individual behavioral change.10,11
Rio de Janeiro is the second largest city in Brazil with more residents living in informal settlements than any other Brazilian municipality (1.39 million people, 22 % of the total population). Further, the city is rapidly growing. According to the 2000 and 2010 censuses, the municipality grew by 8.0 %, from 5.86 to 6.32 million people. Reclassification of the definition of informality by the Census Bureau makes population comparisons between 2000 and 2010 difficult. However, previous estimates suggest that between 1990 and 2000, the informal settlement population grew at more than three times the rate of the municipality as a whole.12
Here, we conducted a detailed analysis of the 2010 Brazilian census in Rio de Janeiro, assessing the extent of differences in socio-demographic and infrastructure characteristics that influence health outcomes between informal and non-informal communities. From the census data, we identified variables that have been previously linked to adverse health outcomes.13,14 Drawing from these data, we offer suggestions for how data disaggregated by slum/non-slum status could inform more detailed studies and urban decision-making aimed at reducing health inequities.
Methods
The Brazilian “Slum” Census
While the Brazilian Census Bureau (Instituto Brasileiro de Geográfica e Estatística, IBGE) has been regularly collecting and releasing information on informal settlements since the early 1980s, the 2010 census resulted in the Bureau's first formal publication on the subject since a 1950 survey.15 In 2010, the IBGE defined “informal settlement” in Brazil with the unique term subnormal agglomeration (aglomerado(s) subnorma-l(is) (AGSN)), which encompasses communities made up of at least 51 housing units that meet the following criteria:
Illegal occupation of the land characterized by construction on the property of others or receipt of land title in the previous 10 years, and
- one of the following:
- Construction outside of existing municipal patterns, reflected by the presence of narrow and uneven roads, land parcels of inconsistent shape and size, and development not overseen by regulatory agencies, or
- a general scarcity of public services.16
Prior to the 2010 Census enumeration, the IBGE identified potential AGSN census tracts with the following methodology:
a review of census tracts in the 2000 national census and the 2007 national population count identified as informal, in addition to other census tracts from these surveys possessing socioeconomic characteristics similar to confirmed AGSN census tracts, and
additional areas identified by IBGE field workers in each municipality.17
The IBGE systematically reviewed these tracts with a territorial informational survey (Levantamento de Informações Territoriais, LIT) developed specifically for the 2010 Census, which explicitly delineated the boundaries separating formal and AGSN communities with advanced satellite imagery that were pursuantly confirmed in the field. After enumeration, the IBGE hosted meetings with the local governments of 350 Brazilian municipalities to verify LIT-identified AGSN census tracts.
Data Sources
We accessed the 2010 Brazilian Census data through the official open-access IBGE 2010 Census website (http://www.censo2010.ibge.gov.br/). We downloaded the state of Rio de Janeiro's spatial files, as well as Microsoft Excel (Microsoft Corporation, Redmond, USA) data files in which data are organized by census tract. Each census tract is given a unique 15-digit geocoded identification number, identical in both spatial and data files, from which we selected all census tracts in the municipality of Rio de Janeiro. Excel data were imported for analysis with Stata v.12.1 (StataCorp, College Station, USA). Spatial files, coded with census tract boundaries by the IBGE, were loaded into ArcGIS v.10.1 (ESRI, Redlands, USA).
Data Analysis
Detailed methodology for data collection and descriptions of variables can be found in the IBGE's general and AGSN publications.16,18 We selected and analyzed infrastructure and demographic variables that are frequently used in the urban development literature and available in the census data that we deemed to be relevant health determinants. These variables included total population, age distributions, literacy rate, household responsibility (female), race (self-reported), property ownership, and household access to services such as water, sanitation, electricity, and solid waste collection. Income is expressed in US dollars using the exchange rate from October 1, 2010 of 1.69 Brazilian Reais per dollar. Minimum wage was defined as the federal minimum wage in 2010, approximately US\$309 per month.
The IBGE defined “adequacy” of basic utility services for households in urban areas (Table 1).19–21 We based our analyses on the Brazilian government's definition of adequate urban service provision, but note the similarities and differences between the IBGE's definitions and those used by the Millennium Development Goals (MDG) (Table 1).
Table 1.
Brazilian Census Bureau (IBGE) and Millennium Development Goal definitions of adequate access to services, 2010
| Adequate Access (IBGE)16 | Millennium Development Goals | |
|---|---|---|
| Water | • Household connection to municipality's water distribution network | Improved Drinking Water Sources19 |
| • Household connection to general water distribution network | ||
| • Public standpipe | ||
| • Borehole | ||
| • Protected, dug well | ||
| • Protected spring | ||
| • Rainwater collection | ||
| Sanitation | • Connected to drain from area (treated or untreated) | Improved Sanitation Facilities19 |
| • Septic system | • Connection to a public sewer | |
| • Septic system | ||
| • Pour-flush/simple-pit/ventilated-improved-pit latrine | ||
| Solid waste disposal | • Collected in domicile and removed by public or private service from curbside | Good solid waste management20 |
| • Collected in domicile and taken to location where removed by public or private service | • Storage of waste in containers | |
| • Removal at a frequency of once per week | ||
| • Effective disposal | ||
| Electricity | • Access to electricity | • Access to non-biomass fueled electricity21 |
| • Exclusive electric meter |
The area of each census tract was calculated with census shape files in ArcGIS v.10.1 (ESRI, Redlands, USA). Density measurements were produced by dividing this area by the number of residents in each tract. The average number of residents per household was calculated by dividing the total number of residents by the number of households in that tract. Per household monthly income was calculated by dividing the sum of reported incomes by the number of households for which income data were reported in that tract. Gini coefficients were calculated from monthly per household income with Stata code adapted from a program by Aliaga-Diaz and Montoya at the Boston College Department of Economics in 1999.22
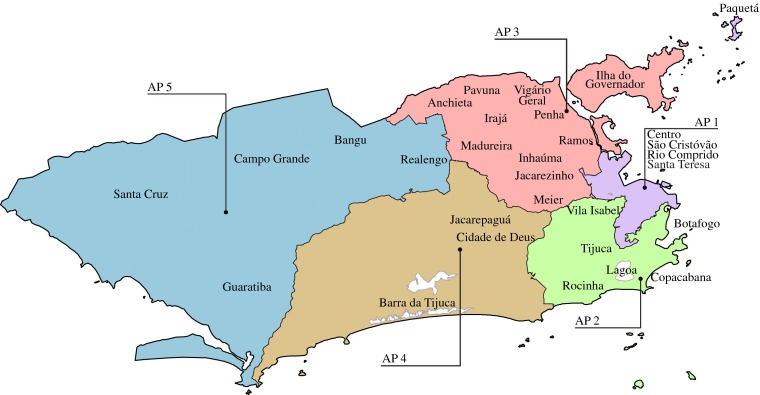
We stratified eligible census tracts by Rio de Janeiro's five major planning areas (Área de Planejamento, AP), a geographic organizational unit used for administrative purposes by many government agencies, including the Federal Ministry of Health for the collection of population disease data (Fig. 1).23
Figure 1.
Rio de Janeiro, municipal planning areas (AP), 2010.
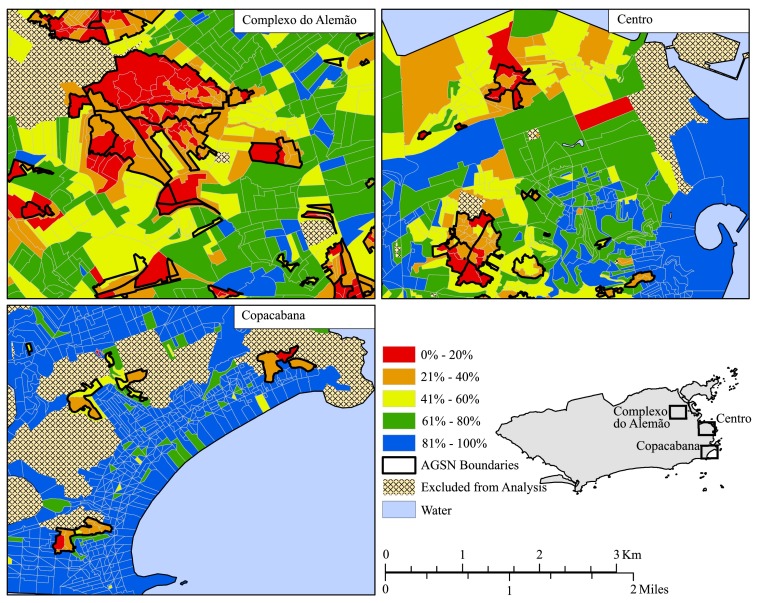
Three 14.5-km2 areas were identified to illustrate spatial variation within the same neighborhood: Complexo do Alemão, Centro, and Copacabana (Figs. 4, 5, 6). Complexo do Alemão is often referred to as one informal settlement in the city's industrial north, but the IBGE classifies it as a grouping of 11 AGSN communities. It is the site of multiple social and physical interventions aimed at improving wellbeing in the area, including the Unidade de Polícia Pacificadora Social program (Social UPP). While much of Rio’s wealth is concentrated in the Copacabana district and surrounding neighborhoods, there are also AGSN communities in this region including Morro de Cantagalo, Babilônia, and Morro dos Cabritos. The city's historical center (Centro) encompasses some of Rio's oldest AGSN communities, including what is often referred to as Rio's first slum: Morro da Providência. Our analysis of Centro includes the neighborhoods of Centro, Catumbi, Gamboa, and Saúde.
Figure 4.
Rio de Janeiro, percentage of households earning less than minimum wage (US$309), 2010.
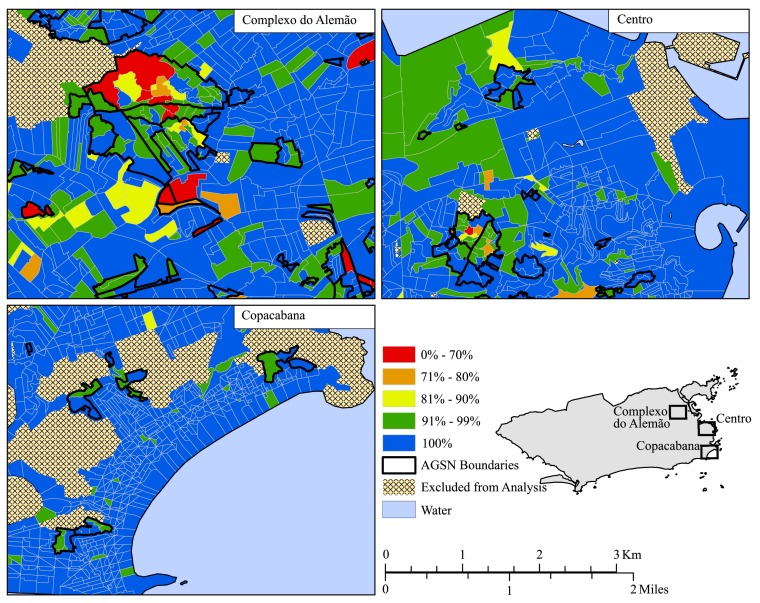
Figure 5.
Rio de Janeiro, percentage of households with adequate sanitation, 2010.
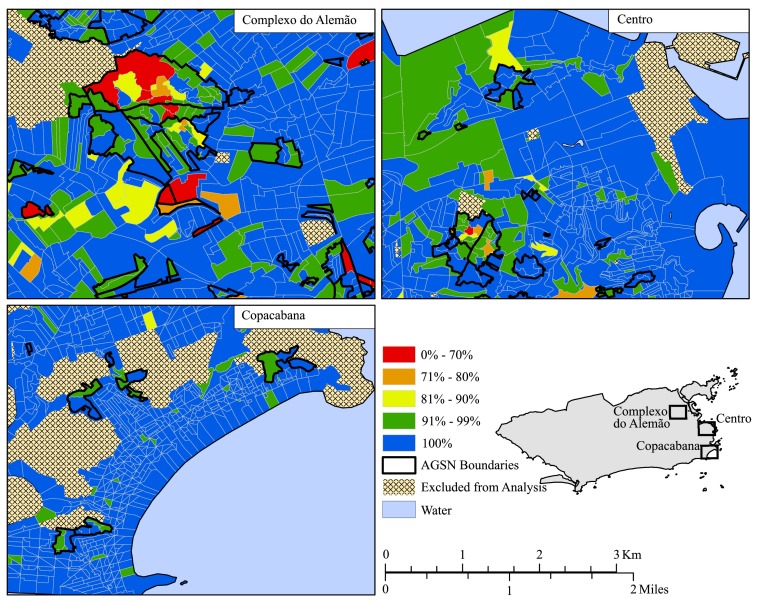
Figure 6.
Rio de Janeiro, percentage of households with adequate electricity, 2010.
Results
Comparison of AGSN and non-AGSN Census Tracts
There were 10,504 census tracts in the municipality of Rio de Janeiro. We excluded 379 census tracts because they were uninhabited (309), data were withheld by the IBGE for privacy concerns (61), or reported data were less than 50 % complete (9). Nineteen of those excluded were AGSN census tracts.
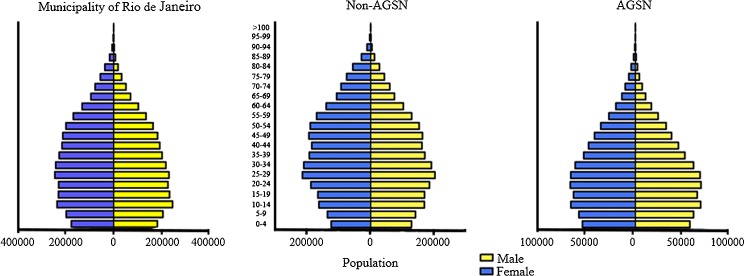
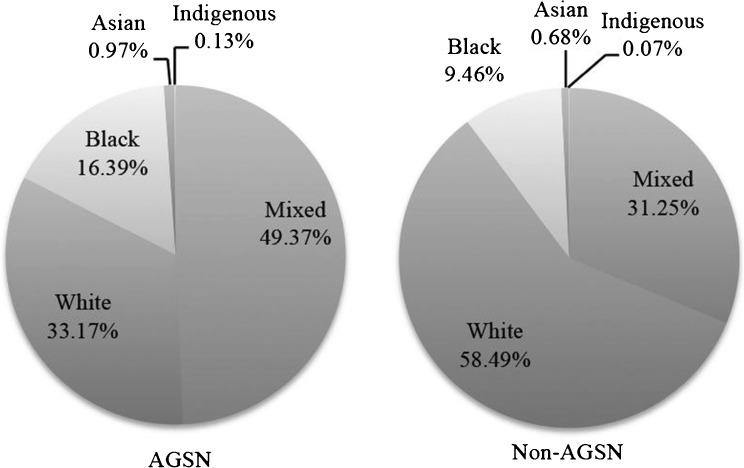
Residents of AGSN census tracts were younger, less literate, more densely populated, poorer, more racially diverse, with more equal distribution of income than residents of non-AGSN census tracts (Table 2, Figs. 2 and 3). The AGSN population in Rio de Janeiro had a different age profile than the non-AGSN population. AGSN census tracts were younger, and the population structure was consistent with a rapidly growing population, whereas non-AGSN census tracts had a more stable population structure, similar to the aggregate municipality's age profile. The proportion of the population over 60 years old in non-AGSN census tracts (18.1 %) was more than twice the proportion of the population over 60 in AGSN tracts (8.1 %).
Table 2.
Rio de Janeiro, AGSN, and non-AGSN census data with standard deviations (SD), 2010
| Average in AGSN census tracts (SD) | Average in non-AGSN census tracts (SD) | |
|---|---|---|
| Households (n) | 426,358 | 1,717,452 |
| Population (n) | 1,393,690 | 4,922,739 |
| Years (IQR) | ||
| 50th Percentile age | 26 (13, 41) | 35 (19, 52) |
| Education (% population) | ||
| Literacy ages 15–24 | 98.3 (2.0) | 99.4 (1.2) |
| Literacy ages 25 and older | 91.7 (4.7) | 97.7 (2.8) |
| Income (% of households) | ||
| Average household monthly income (US$) | 708 (208) | 2,362 (1,953) |
| Households earning less than the minimum wage | 73.5 (12.2) | 34.8 (23.6) |
| Households earning less than three times the minimum wage | 98.0 (2.8) | 70.0 (27.84) |
| Gini index | 0.142 | 0.401 |
| Population density | ||
| Population density (people/km2) | 42,991 (40,281) | 26,372 (36,386) |
| Average residents per house | 3.3 (0.4) | 2.8 (0.4) |
| Property ownership (% households) | ||
| Rented | 18.1 (15.2) | 22.7 (11.7) |
| Owned | 77.4 (16.9) | 66.7 (15.3) |
| Household access to services (% households adequately provisioned) | ||
| Water | 95.5 (16.1) | 98.7 (7.0) |
| Solid waste disposal | 97.3 (10.6) | 99.6 (3.3) |
| Sanitation | 86.2 (27.0) | 96.2 (13.4) |
| Electricity | 67.4 (24.6) | 91.8 (12.9) |
Figure 2.
Rio de Janeiro, population distributions, AGSN, and non-AGSN, 2010.
Figure 3.
Rio de Janeiro, AGSN, and non-AGSN self-reported race (2010).
AGSNs in Rio had more people and more houses per square kilometer than non-AGSN census tracts. AGSN census tracts occupied only 7 % of the total inhabited area of Rio de Janeiro, but they housed 22 % of the population. AGSN census tracts had an average density of 42,991 persons per km2, whereas non-AGSN census tracts had an average of 26,371 persons per km2, with more residents per house in AGSN census tracts (3.3) than in non-AGSN tracts (2.8).
In non-AGSN tracts, on average, 96.2 % of households had adequate sanitation and 91.8 % adequate electricity in contrast to AGSN communities where 86.2 % and 67.4 % had adequate sanitation and electricity. On average, 99.6 % of non-AGSN households in a census tract had adequate trash collection, while only 97.3 % of AGSN households had access to this service.
Comparison among AGSNs in Different Municipal Planning Areas
We stratified AGSN data by AP to explore potential spatial differences across districts within which policy and planning decisions are made (Fig. 1). The historic city center, AP 1, includes the city's port and main commercial zone. In the south, AP 2 consists primarily of high-density middle class residential neighborhoods such as Copacabana and Botafogo, as well as wealthier neighborhoods like Jardim Botânico and Leblon. AP 3 is in the city’s northeast, which encompasses much of the city’s industrial and commercial activities. To the southwest is AP 4 where luxury residential communities have been recently developed. The large landmass encompassing AP 5 includes the city's last remaining farmland and several large industrial complexes.24
Household responsibility, income, home ownership, and utility distribution varied across AGSNs in different municipal planning areas in Rio de Janeiro (Table 3).
Table 3.
Rio de Janeiro, municipal planning areas AGSN-only census data with standard deviations (SD), 2010
| 1 (SD) | 2 (SD) | 3 (SD) | 4 (SD) | 5 (SD) | |
|---|---|---|---|---|---|
| Municipal planning area | |||||
| Households (n) | 30,857 | 54,987 | 186,822 | 74,115 | 79,577 |
| Population (n) | 99,545 | 173,697 | 626,533 | 228,475 | 263,286 |
| Household responsibility (% households) | |||||
| Female head of household | 51.2 (13.0) | 49.4 (12.1) | 47.0 (11.7) | 44.42 (13.1) | 46.15 (12.2) |
| Income (% households) | |||||
| Monthly income (avg. US$) | 813 (250) | 797 (204) | 696 (187) | 847 (237) | 672 (160) |
| Earning less than the minimum wage | 70.9 (12.3) | 69.8 (12.4) | 76.5 (10.7) | 63.34 (12.7) | 77.44 (9.1) |
| Earning less than three times the minimum wage | 97.1 (3.2) | 97.8 (2.9) | 98.6 (2.0) | 96.80 (4.2) | 98.26 (2.1) |
| Gini index | 0.153 | 0.127 | 0.133 | 0.135 | 0.126 |
| Population density (persons/km2) | |||||
| Population density | 48,800 (31,561) | 60,097 (49,879) | 46,748 (41,362) | 52,618 (46,214) | 19,259 (11,093) |
| Property ownership (% households) | |||||
| Rented | 17.9 (11.6) | 23.1 (16.3) | 16.2 (10.9) | 33.1 (21.78) | 9.37 (7.22) |
| Owned | 75.8 (18.4) | 73.3 (16.4) | 79.5 (13.6) | 62.7 (21.6) | 86.1 (10.4) |
| Household access to services (% households adequately provisioned) | |||||
| Water | 99.2 (4.2) | 91.3 (22.0) | 97.4 (11.8) | 89.7 (25.6) | 96.7 (12.0) |
| Solid waste disposal | 97.8 (7.2) | 98.0 (7.8) | 96.5 (12.6) | 97.4 (11.2) | 98.1 (8.1) |
| Sanitation | 93.8 (17.0) | 89.5 (18.5) | 90.9 (23.1) | 76.6 (34.4) | 79.7 (30.9) |
| Electricity | 68.3 (26.2) | 68.7 (29.2) | 66.6 (25.1) | 69.2 (23.3) | 66.7 (21.3) |
Population density was lower in the western AGSNs (AP 4, 5) than in AGSN tracts in older areas of the city (APs 1, 2, 3). AGSN population density was higher in the wealthier zones of APs 2 and 4 (60,097 and 52,618 persons per km2, respectively). AP 5 had the greatest land area, and lowest population density (19,259 persons per km2).
AGSN households in APs 3 and 5 were poorer than AGSN households in other municipal planning areas (per household monthly income of \$696 and \$672, respectively). AGSN households in AP 4 were the wealthiest, earning a census tract average of \$847 per month.
AGSN census tracts in older parts of the municipality (APs 1, 2, 3) had more thorough distribution of adequate sanitation than more recently settled AGSN tracts in APs 4 and 5 (Table 3). The oldest AGSN census tracts in the city in AP 1 had better access to adequate utilities than AGSNs in other planning areas, excepting electricity. AGSN communities in all planning areas were lacking in adequate electricity distribution.
Comparison of Three Urban Environments in the Municipality of Rio de Janeiro
In 2010, the municipality of Rio de Janeiro encompassed more than 1,200 km2. Our analysis explored spatial heterogeneity of services access between AGSN and non-AGSN census tracts within three areas of the municipality: Centro, Copacabana, and Complexo do Alemão (Fig. 1). We found that wealth was concentrated in Copacabana (Fig. 4) but this did not increase the wealth in this area's AGSN households. AGSN households in Copacabana earned approximately the same amount of money as AGSN households in Centro and Complexo do Alemão.
Relative income differences comparing neighboring AGSN and non-AGSN communities demonstrated spatial heterogeneity. For example, we observed that a greater percentage of households in census tracts immediately adjacent to AGSN communities in both Centro and Complexo do Alemão earned less than the minimum wage, but this was not the case in Copacabana, suggesting that spatial concentration of poverty and relative inequality was more intense in certain districts of Rio in both AGSN and non-AGSN tracts.
Figures 5 and 6 show the percentage of households in the three districts that had access to adequate sanitation and electricity in 2010 (respectively). In all areas, access to sanitation and electricity had a distinctive spatial pattern in which AGSN areas were less well served. Fewer than 70 % of AGSN households had adequate sanitation in Complexo do Alemão and Centro. Contrastingly, more than 90 % of the households outside of AGSNs in Copacabana and Complexo do Alemão had adequate electricity, but less than 80 % of households within AGSNs in these areas had adequate electricity. Census tracts in the oldest area of the city, Centro, had fewer households with adequate electricity than in Copacabana and Complexo do Alemão.
Discussion
The 2010 Brazilian Census indicated that there is heterogeneity in demographic and infrastructure characteristics between and within AGSNs in the municipality of Rio de Janeiro. In general AGSN residents in Rio de Janeiro were poorer, less literate, younger, and had less access to basic services than residents of non-AGSN census tracts. These variables are important determinants of health outcomes. Further, inequalities between these determinants are frequently cited as drivers of disease disparity.13,25
We also highlighted spatial variation in the distribution of poverty and services between different AGSN census tracts in different regions of the city. Relative inequality and service needs in Rio's different districts suggest that policy and planning might pay special attention to the most impoverished areas. For instance, the AGSN census tracts in the western district of Rio de Janeiro (APs 4, 5) were more vulnerable in terms of poverty and lack of services than the older southern and central AGSN census tracts of the city (APs 1, 2, 3). More in-depth analyses and field-based verification are necessary to support our findings and should be completed before determining spatial allocations of health-promoting planning and policy interventions.
One important aspect of the 2010 Brazilian census that differentiates it from other urban health measures is the definitions used by the IBGE to describe adequate infrastructure. These definitions reflect decades of progress that Brazil has made in delivering basic services to urban areas, differing from those used in global measures of adequate service delivery, such as the MDG,19–21 UN-HABITAT's Global Urban Indicators,26 and even the World Health Organization's Urban Health Equity Assessment and Response Tool.27 In most cases, the IBGE uses a more strict definition to assess the adequacy of service than the MDGs (Table 1). For example, the MDG definition for improved sanitation facilities allows for certain kinds of latrines to be considered “improved sanitation” whereas the IBGE only considers a connection to the municipal wastewater network or a septic system to be adequate.
A key limitation of these metrics is that they do not consider other core issues for understanding whether infrastructure access alone is health promoting, such as water quality, the frequency and cost to households of electricity, waste collection, and sewerage, as well as whether or not access to a toilet is safe, especially for children and women. Adequate trash collection was vaguely and poorly defined by the IBGE as a central collection point for trash in the community, or when trash was collected at a domicile's curbside by a public or private service. The MDGs suggest that adequate solid waste management should include such details as storage of waste in containers and removal at least once a week, in addition to the stipulation that waste should be effectively disposed of once removed.20 The IBGE definition does not offer information on the frequency or disposal of household waste. Similarly, neither the IBGE nor MDG address the cost or frequency of electricity in a home.21 These definitions, and their shortcomings are important for our understanding of discrepancies in health outcomes between formal and informal communities.
Our analyses suggest possible avenues for more detailed investigation into how some of these factors relate to human health. For example, according to the 2010 GBD study the highest contributor to years of life lost (YLL) in Brazil was interpersonal violence.3 Interpersonal violence disproportionately affects young people.28 A younger population profile in Rio's AGSNs may be contributing to the observed increase in YLL caused by interpersonal violence.
Conclusion
Too often, census data are not analyzed specifically for vulnerable areas within a city, obscuring specific urban health risks or assets facing the urban poor. We have attempted to analyze socio-demographic characteristics and the distribution of basic services to assess highlighted neighborhood-level factors that influence health and wellbeing.
We believe that this preliminary analysis represents an important step towards understanding the drivers of disease disparities between formal and informal communities. We identified discrepancies in key health determinants and identified potential risk factors for elevated disease rates in informal communities; these disaggregated data will enable explicit analyses assessing the relationships between the health determinants described in this article, and disaggregated data describing health outcomes in informal settlements. Our results suggest that one-size-fits-all interventions for the urban poor will likely miss intra-city differences. Strictly and rigorously disaggregated slum census data can also act as baseline data for analyzing potential changes in living and household conditions for Rio's poor residents as policies such as the Social UPP and other urban development projects associated with the upcoming Olympic Games and World Cup are implemented. Additional work is necessary to verify the “on-the-ground” experiences of residents, but census data disaggregated by slum status are important for understanding social determinants of health of the urban poor.
Acknowledgments
Funding
This work was funded in part by a grant for the Slum Health Colloquium from the Institute of International Studies at the University of California, Berkeley, as well as a training grant from the Fogarty International Center/NIH Global Infectious Disease Research (TW006563).
Contributor Information
Robert E. Snyder, Phone: +1-510-6432949, FAX: +1-510-6436350, Email: robert.snyder@berkeley.edu
Jason Corburn, Email: jcorburn@berkeley.edu.
References
- 1.UN-HABITAT. The Challenge of Slums: Global Report On Human Settlements 2003. London and Sterling: Earthscan Publications Ltd; 2003.
- 2.Shetty P. Health care for urban poor falls through the gap. Lancet. 2011;377(9766):627–628. doi: 10.1016/S0140-6736(11)60215-8. [DOI] [Google Scholar]
- 3.Murray CJL, Vos T, Lozano R, et al. Disability-adjusted life years (DALYs) for 291 diseases and injuries in 21 regions, 1990-2010: a systematic analysis for the Global Burden of Disease Study 2010. Lancet. 2013;380(9859):2197–2223. doi: 10.1016/S0140-6736(12)61689-4. [DOI] [PubMed] [Google Scholar]
- 4.Harpham T. Urban health in developing countries: what do we know and where do we go? Health Place. 2009;15(1):107–116. doi: 10.1016/j.healthplace.2008.03.004. [DOI] [PubMed] [Google Scholar]
- 5.Vlahov D, Agarwal SR, Buckley RM, et al. Roundtable on Urban Living Environment Research (RULER) J Urban Health. 2011;88(5):793–857. doi: 10.1007/s11524-011-9613-2. [DOI] [PMC free article] [PubMed] [Google Scholar]
- 6.Fotso JC. Child health inequities in developing countries: differences across urban and rural areas. Int J Equity Health. 2006;5(1):9–9. doi: 10.1186/1475-9276-5-9. [DOI] [PMC free article] [PubMed] [Google Scholar]
- 7.Agarwal S. The state of urban health in India; comparing the poorest quartile to the rest of the urban population in selected states and cities. Environ Urban. 2011;23(1):13–28. doi: 10.1177/0956247811398589. [DOI] [Google Scholar]
- 8.Kyobutungi C, Ziraba A, Ezeh A, Yé Y. The burden of disease profile of residents of Nairobi's slums: results from a demographic surveillance system. Popul Health Metrics. 2008;6(1):1. doi: 10.1186/1478-7954-6-1. [DOI] [PMC free article] [PubMed] [Google Scholar]
- 9.Sclar ED, Garau P, Carolini G. The 21st century health challenge of slums and cities. Lancet. 2005; 365(9462): 901. doi:10.1016/S0140-6736(05)71049-7. [DOI] [PubMed]
- 10.Centers for Disease Control and Prevention. Establishing a Holistic Framework to Reduce Inequities in HIV, Viral Hepatitis, STDs, and Tuberculosis in the United States. Atlanta, GA: U.S. Department of Health and Human Services; 2010.
- 11.Frieden TRT. A framework for public health action: the health impact pyramid. Am J Public Health (N Y) 2010;100(4):590–595. doi: 10.2105/AJPH.2009.185652. [DOI] [PMC free article] [PubMed] [Google Scholar]
- 12.Perlman J. Marginality: from Myth to Reality in the Favelas of Rio de Janeiro: 1969-2002. New York, NY: Lexington; 2004.
- 13.Riley LW, Ko AI, Unger A, Reis MG. Slum health: diseases of neglected populations. BMC Int Health Hum Rights. 2007;7:2. doi: 10.1186/1472-698X-7-2. [DOI] [PMC free article] [PubMed] [Google Scholar]
- 14.Unger A, Riley LW. Slum health: from understanding to action. PLoS Med. 2007;4(10):1561–1566. doi: 10.1371/journal.pmed.0040295. [DOI] [PMC free article] [PubMed] [Google Scholar]
- 15.Instituto Brasileiro de Geografia e Estatística: Conselho National de Estatística. As favelas do Distrito Federal e o Censo Demográfico de 1950. Rio de Janeiro: IBGE; 1953.
- 16.Instituto Brasileiro de Geografia e Estatística. Censo Demográfico: Aglomerados Subnormais Primeiros Resultados. Rio de Janeiro: IBGE; 2010.
- 17.Nunes EP. Innovations for the 2010 Brazilian Population Census. IPUMS - Global Workshop: 58th International Statistics Institute World Statistics Congress In: Dublin, Ireland; 2011.
- 18.Base de informações do Censo Demográfico 2010: Resultados do Universo por setor censitário. Rio de Janeiro: IBGE; 2010. [Google Scholar]
- 19.Meeting the MDG drinking water and sanitation target: the urban and rural challenge of the decade. Geneva: World Health Organization and United Nationas Children's Fund; 2006. [Google Scholar]
- 20.Gonzenbach B, Coad A. Solid Waste Management and the Millenium Development Goals: Links that Inspire Action. St Gallen: Collaborative Working Group on Solid Waste Management in Low-and Middle-Income Countries; 2007.
- 21.Modi V, McDade S, Lallement D, Saghir J. Energy and the Millennium Development Goals. New York: Energy Sector Management Assistance Programme, United Nations Development Programme, UN Millennium Project, and World Bank; 2006.
- 22.Aliaga-Diaz R, Montoya S. GINIDESC: Stata Module to Compute Gini Index with within- and Between-Group Inequality Decomposition [computer program]. Version 1.0 1999. Available at: http://econpapers.repec.org/software/bocbocode/s372901.htm.23.
- 23.Ministério da saúde. Reorganizando o SUS no Município do Rio de Janeiro. 4o Seminário da Região Metropolitana I, Fórum de Conselhos Municipais de Saúde da Região Metropolitana I/Brasília: Distrito Federal, Brasil: Editora do Ministério da Saúde; 2005.
- 24.O'Hare G, Barke M. The favelas of Rio de Janeiro: a temporal and spatial analysis. GeoJournal. 2002; 56: 225–240. doi:10.1023/A:1025134625932.
- 25.Commission on Social Determinants of Health. CSDH Final Report: Closing the Gap in a Generation: Health Equity Through Action on the Social Determinants of Health. Geneva: World Health Organization; 2008.
- 26.UN-HABITAT. Urban Indicators Guidelines: Monitoring the Habitat Agenda and the Millenium Development Goals—Slums Target. Nairobi: United Nations Human Settlements Programme; 2004.
- 27.WHO. Urban HEART: Urban Health Equity Assessment and Response Tool. Kobe: The WHO Centre for Health Development; 2010.
- 28.Sethi D, Racioppi F, Hughes K, Mitis F, Bellis M. European Report on Preventing Violence and Knife Crime Among Young People. Geneva: World Health Organization; 2010.


