

Abstract
Exposure to environmental noise from traffic is common in urban areas and has been linked to increased risks of adverse health effects including cardiovascular disease. Because traffic sources also produce air pollutants that increase the risk of cardiovascular morbidity, associations between traffic exposures and health outcomes may involve confounding and/or synergisms between air pollution and noise. While prior studies have characterized intraurban spatial variation in air pollution in New York City (NYC), limited data exists on the levels and spatial variation in noise levels. We measured 1-week equivalent continuous sound pressure levels (Leq) at 56 sites during the fall of 2012 across NYC locations with varying traffic intensity and building density that are routinely monitored for combustion-related air pollutants. We evaluated correlations among several noise metrics used to characterize noise exposures, including Leq during different time periods (night, day, weekday, weekend), Ldn (day-night noise), and measures of intermittent noise defined as the ratio of peak levels to median and background levels. We also examined correlations between sound pressure levels and co-located simultaneous measures of nitric oxide (NO), nitrogen dioxide (NO2), fine particulate matter (PM2.5), and black carbon (BC) as well as estimates of traffic and building density around the monitoring sites. Noise levels varied widely across the 56 monitoring sites; 1-week Leq varied by 21.6 dBA (range 59.1–80.7 dBA) with the highest levels observed during the weekday, daytime hours. Indices of average noise were well correlated with each other (r > 0.83), while indices of intermittent noise were not well correlated with average noise levels (r < 0.41). One-week Leq correlated well with NO, NO2, and EC levels (r = 0.61 to 0.68) and less so with PM2.5 levels (r = 0.45). We observed associations between 1-week noise levels and traffic intensity within 100 m of the monitoring sites (r = 0.58). The high levels of noise observed in NYC often exceed recommended guidelines for outdoor and personal exposures, suggesting unhealthy levels in many locations. Associations between noise, traffic, and combustion air pollutants suggest the possibility for confounding and/or synergism in intraurban epidemiological studies of traffic-related health effects. The different spatial pattern of intermittent noise compared to average noise level may suggest different sources.
Keywords: Noise, Air pollution, Traffic, Noise metrics, Environmental noise, Air monitoring
Introduction
The impacts on hearing of exposures to high sound pressure levels in workplaces and other settings are well-established. In addition, non-auditory adverse health effects from exposures to ambient noise from common urban sources have been documented in a growing body of literature. Epidemiologic studies, for example, suggest higher risks of cardiovascular disease, including myocardial infarction and hypertension among people exposed to higher levels of ambient noise, particularly traffic noise.1–5 Ambient noise exposures have been linked to a variety of physical and mental responses, including effects on cardiovascular endpoints6 and impairment of cognitive development in children.7 Nighttime noise exposures may be especially harmful and have been associated with elevated blood pressure,8,9 and a greater cardiovascular response when compared to daytime noise exposures.9,10 Environmental noise can also lead to sleep disruption, psychosocial stress, general annoyance, disturbance of daytime activities, and auditory effects.11–14
Exposures to air pollutants are also associated cardiovascular morbidity.15 Road traffic is a source of noise and air pollution, raising the possibility that associations between traffic exposures and cardiovascular endpoints involve possible confounding and/or synergism between noise and air pollution and their effects on health.16–20 Despite the recognized need to consider noise and stress as potential confounders of air pollution effects,15 relatively few studies of traffic impacts on health have considered noise in risk models.17,21 Urban air pollution monitoring studies in New York City (NYC) have indicated significant spatial variation in traffic-related air pollutants,22,23 but less data is available to characterize intraurban spatial variation in noise. An understanding of the shared patterns of noise and air pollution exposures within complex urban environments such as NYC could help inform exposure assessment and epidemiologic research.
Previous studies on the health effects of noise in cities have generally relied on models based on land-use and traffic data.4,17,24–26 These models, however, often rely on land-use and traffic data that can be limited or have significant uncertainty, particularly in large cities with diverse built and natural environments such as NYC. Limitations in local traffic data, including lack of traffic counts on all roadways can lead to uncertainty in noise models.27 In addition, the high population density and high rates of non-car commuting in certain areas of NYC suggest that non-traffic environmental noise sources may contribute more to exposure in these areas than in typical urban environments. As a result, models that rely on traffic and land use may mischaracterize noise levels in NYC. These models are also limited in their ability to capture intermittent, short-term noise exposures which may be especially important in sleep disruption, particularly among populations that have been exposed over long periods.28–31 Given these limitations of deterministic noise models in NYC, noise measurements to characterize sound levels in many locations resulting from a wide diversity of sources is an important step in assessing exposure levels.
The World Health Organization (WHO) and US Environmental Protection Agency (EPA) recommend equivalent daytime noise levels (Leq: continuous sound pressure level with equivalent energy to the fluctuating sound pressure being measured during the time period of interest) not exceeding 55 dBA and day-night noise level not exceeding 55 dBA, respectively, to prevent activity interference and annoyance.13,39 Similarly, the EPA recommends personal 24-h equivalent noise levels not exceeding 70 dBA to prevent hearing loss.39 While there is limited systematic monitoring data available to compare these guidelines to typical noise levels in NYC, like other large urban areas, residents are subject to significant exposures to environmental noise and air pollution, with 32 % of NYC households reporting living in neighborhoods with bothersome street noise and heavy traffic, compared to 21 % of respondents nationwide.32
To assess the levels and spatial patterns of ambient noise and associations of noise and air pollution across NYC neighborhoods, we first evaluated a low-cost, compact sound level instrument for collecting simultaneous 1-week records of noise levels at multiple locations. We then deployed monitors at a subset of locations with varying traffic and land-use characteristics where air pollution samples are routinely collected as part of a citywide air monitoring program.33 We computed metrics commonly used to assess chronic noise exposures as well as intermittent noise exposure metrics similar to those previously used in occupational settings.34,35 We then examined correlations among noise exposure metrics, assessed associations of noise metrics and ambient concentrations of fine particulate matter (PM2.5), nitrogen dioxide (NO2), nitric oxide (NO), and black carbon (BC) content of PM2.5, and examined associations of nearby traffic and building density with noise exposure metrics.
Methods
Sound Level Meter Evaluation
We selected the Extech USB Sound Level Datalogger (model 407760, ANSI class 2, Nashua, NH) due to its low cost, battery-powered design, compact configuration, and ability to log sound levels unattended for a full week, at a range of 30 to 130 dBA. These units are designed to log equivalent continuous sound pressure levels (Leq) at varying time intervals; the length of interval determining the maximum capacity of the units. We tested different datalogging intervals to determine the optimum resolution that would limit error in the average measurements yet allow for longer term sampling, accounting for battery life and memory constraints of the instrument. To do this, we compared 5, 10, and 60 s datalogging intervals to a 1-s interval along a major roadway in Seattle, WA. Treating a 1-s monitoring interval as the gold standard, we found that sampling at 5-s intervals did not result in substantial differences in mean Leq, Leq standard deviations, or ratios of mean to highest Leq. Although the 5-s datalogging did result in modest attenuation (on the order of a few dBA) in the highest measured Leq, at that resolution, we could monitor for a full week without battery replacement and represented the optimal balance between datalogging capacity and monitoring accuracy.
The dataloggers were placed inside weather-protective Pelican 1050 microcases (Torrance, CA) with holes cut into the lower edge of the case and fit with rubber grommets for the microphone which, when inserted, was covered in a windscreen and secured using plastic zip ties. Kydex rain shields were attached to the front of cases, protecting the microphones from rain and wind. Mounting brackets were attached to back of the case for mounting onto street-side lampposts (Fig. 1).
FIGure 1.
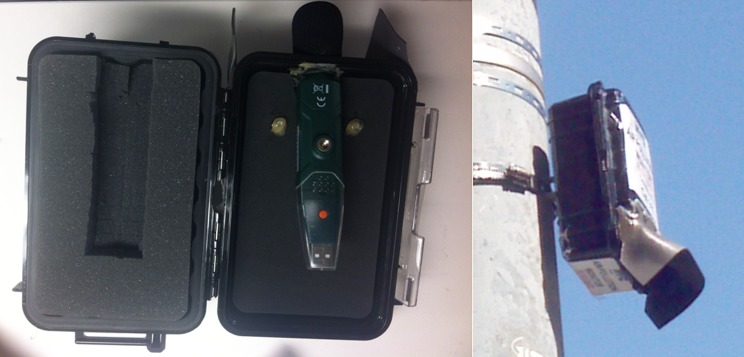
Community noise monitor field deployment and housing design.
The instrument housing was tested for effects on sound level recording by taking repeated measurements of a reference test stimulus measured in free space and in the weatherproof case. White noise was presented for 60 s at 60, 75, and 90 dBA, chosen to represent the range of typical traffic noise levels, and the units were configured to measure the resulting Leq at 1‐s intervals. Across nine repeated measurements, we found the average difference between noise levels measured with and without the presence of the weatherproof case were 1 dBA or less—well within the tolerance limit for an ANSI type-2 sound level meter.36
Air Quality Monitors
Air sampling data was collected as part of routine air quality monitoring conducted by NYC as part of the New York City Community Air Survey (NYCCAS).37 A detailed description of the air quality monitors has been published elsewhere.23,33 Briefly, we measured 2-week integrated samples of fine PM2.5 using Harvard Impactors (Air Diagnostics and Engineering, Harrison, ME) operated at 4 L/min with 37 mm Teflon filters. Black carbon content of PM2.5 was determined by calculating absorbance from a reflectance analysis of the filters using an EEL (incorporating Evans Electroselenium) smoke stain reflectometer (model 43D; Diffusion Systems, London, UK).33,38 Oxides of nitrogen were measured using passive samplers (Ogawa & Co. USA, Pompano Beach, FL). The active and passive components of the sampling unit were housed in a weatherproof case and mounted at 10–12 ft onto street-side light and signal posts. Air and noise monitors were mounted on the same set of lampposts at approximately the same height.
Air Quality and Noise Sampling
We sampled air quality at 100 locations from September 5, 2012 to November 20, 2012, sites routinely monitored as part of the NYCCAS network designed to capture the range in variation of traffic and building density while providing adequate spatial coverage throughout the city. A detailed description of the NYCCAS site selection process is published elsewhere.33 One, 2-week integrated sample was taken at each site, with 16–17 sites measured during each 2-week session (100 sites measured during the 12-week fall campaign).
Noise monitoring was conducted at 60 of the 100 NYCCAS air monitoring sites, 10 of which were assigned to each of 6 2-week air quality sampling sessions to match the deployment schedule for air quality monitoring equipment. Noise monitoring sites were chosen by randomly selecting 10 of the 16–17 monitoring sites for noise monitoring in each session, and mapping sites to ensure adequate spatial coverage in each of the 6 sessions (Fig. 2). Noise monitoring was conducted for 1 week during the second half of the 2-week air pollutant monitoring sessions. Each monitor was calibrated on the morning of deployment with a QC-20 sound calibrator (3 M Quest Technologies). Monitors were installed onto street-side and park lampposts, facing the sidewalk, at 10 ft using stainless steel banding, and field teams completed observation logs during the installation, noting any atypical conditions that might result in unusual sound levels (e.g., construction activity). After sampling, units were post-calibrated and data was downloaded for analysis.
FIGure 2.

Map of New York City Community Air Survey sites monitored for sound levels and air pollutants.
Across the 6 monitoring sessions, 56 sites were monitored successfully for noise levels. At four scheduled locations, the sound level meters were non-functional upon arriving at the sites and therefore no sample could be taken. Of the 56 deployed units, 46 units logged sound pressure levels for more than 6 of the 7 days of the sampling time while 10 units stopped logging after 4.7 to 6 days (mean deployment time = 6.6 days). Upon calibration checks, 52 samples showed measurements within 0.5 dB of the calibration standard and 4 samples measured within 1 dB of the calibration standard. Incomplete sampling periods were due to either insufficient battery life or spontaneous, unexplained termination of measurement by the units. At the 56 locations successfully monitored for noise, 55 samples were successfully monitored for PM2.5 and BC (one location’s PM2.5 measurement did not pass filter QA/QC checks after monitoring and the sample was removed from further analysis). All sites were monitored for NO2 and NO.
Nine noise units were operating in the field during the impact phase of Superstorm Sandy (October 29, 2013 to October 30, 2013). Although all units were undamaged during the storm, review of the data showed that at these sites’ levels from the two weekdays during the storm were 1 to 14 dB (dBA) louder on average than the two weekdays prior to the storm, depending on the site. We elected to remove the measurements taken during the storm as we believe they are not representative of normal noise conditions at these sites. We accounted for the missing and removed data (both from prematurely terminated samples and those taken during Superstorm Sandy) by computing weighted averages that account for expected sample time on weekdays, weekends, days, and nights, as described in the next section.
Data Analysis
Summary Noise Metrics at Each Site
To characterize the noise environment at each site, we first calculated several measures of overall noise stratified by time of week (weekday vs. weekend) and time of day (day 7 am–10 pm and night 10 pm–7 am). We calculated these averages as follows:
 |
Where Leq,p is the average equivalent continuous sound level for the time period of interest, Np is the number of 5-s interval Leq measurements taken during the time period, and Leq is the 5-s interval measured sound levels during the period.
To estimate overall 1-week noise levels, we calculated the average sound level as follows:
 |
Where Leq,w is the 1-week average and Nwdd, Nwdn, Nwed, and Nwen are the number of weekday/daytime, weekday/nighttime, weekend/daytime, and weekend/nighttime sound samples taken, respectively. Lwdd, Lwdn, Lwed, and Lwen is each 5-s interval Leq level taken during weekday/daytime, weekday/nighttime, weekend/daytime, and weekend/nighttime periods, respectively. We weighted the averages by expected sampling time over the week (five weekday daytime and nighttime periods, two weekend daytime and nighttime periods) to account for missing data that tended occur on weekdays later in the session due to battery failure. We compared this weighted average to an unweighted arithmetic mean and found that weighting resulted in less than 0.5 dB difference in 1-week average across all sites.
For each site, we also calculated the day-night average sound level (Ldn), which applies a 10 dBA penalty to nighttime noise prior to averaging, to compensate for disruptions caused by nighttime noise.39 We calculated the Ldn separately for weekdays, weekends, and over the full week. To not bias estimates with incomplete days, we only included days with measurements across the full 24 h as follows:
 |
Where Ldn is the day-night average sound level, Np is the number of 5-s Leq measurements taken during the period (weekday, weekend, full week), and Leq,d and Leq,n are the noise level measurements taken during daytime and nighttime hours, respectively.
To estimate intermittent noise exposure, we also calculated the 10th, 50th, and 90th percentile of the distribution (L10, L50, L90) of 5-s noise measurements by the different weekday/weekend and day/night time periods. We then calculated the L90/L50 and L90/L10 ratios to characterize intermittent noise and explore variability in peak exposures relative to median and background levels, similar to those calculated in prior occupational health studies.34,35
Assessment of Temporal Variation in Noise
We used t tests to assess differences in noise levels associated with temporal factors including day of week, weekday versus weekend, and day versus night on weekdays and weekends. Average noise levels were then regressed on indicators of day of week and sampling session and we computed p values and average differences. We examined the day of week pattern by regressing daytime average noise levels on day of week indicators (Saturday as a reference) in a random effects model with sites as random intercepts.
Associations among Noise, Air Pollution, Traffic, and Building Density
We estimated spatial variation in noise levels across the city by calculating the average, range, and coefficient of variation across all sites for all noise metrics. We calculated Pearson’s correlation coefficients among all overall and intermittent noise metrics to evaluate similarities in patterns. We also calculated Pearson’s correlation coefficients and examined scatterplots between select noise metrics (1 week Leq,w, Ldn, nighttime intermittent noise (nighttime L90/L50)) and 2-week average air pollutant concentrations measured in the same session.
We examined the correlations of noise with indicators of traffic density and built space within 15 circular buffers surrounding the monitoring sites, at distances of 50 to 1,000 m. Traffic-weighted road density was calculated by weighting each road segment in a buffer around monitoring sites by road class and borough.40 Specifically, we computed the median traffic count by class of road and borough and then used these median counts as road segment weights. We then multiplied each road segment’s length by the traffic weight and summed within a buffer. Bus and truck density within each buffer was calculated from annual average daily counts from the New York Metropolitan Transportation Council’s travel demand model.41 We also examined correlations with the counts of large roadways near monitoring sites (primary, secondary, and tertiary roads) from the ALIS road network as well as total area of built space, calculated as interior building area from the New York Department of City Planning Land Use Tax Lot Output data files.42
Results
We observed wide variation across monitoring sites in all noise metrics, with 1-week average Leq varying by 21.6 dBA across the 56 sites (Table 1). The widest range in sound levels occurred at nighttime on the weekends where the 56 sites varied by 25 dBA. We found that all sound pressure levels (Leq) across all sites were independent of indicators of sampling session (p > 0.05). Alternatively, we found that average daytime noise levels were significantly higher than nighttime levels (mean difference = 3.9 dBA, p < 0.001), a difference that was observed on weekdays (mean difference = 3.85 dBA, p < 0.001) and weekends (mean difference = 4.06 dBA, p < 0.001). Average Leq was also found to be significantly higher on weekdays that weekends (mean difference = 1.28 dBA, p < 0.001). Daytime average noise levels were higher during weekdays with Monday being the highest and statistically significant, but the magnitude of the impacts were moderate (e.g., ∼2 dB higher on Monday compared to Saturday). Likewise, nighttime average noise levels were significantly higher on Monday through Wednesday (compared to Saturday), with less magnitude (e.g., 1.6 dB higher on Monday compared to Saturday).
TABLE 1.
Summary statistics for noise measurements
| Day of week | Time of day | Metric | N | Mean (dBA) | Range (dBA) | Standard deviation (dBA) | CV% |
|---|---|---|---|---|---|---|---|
| All days | All times | Leq,w | 56 | 70.2 | 59.1-80.7 | 5.6 | 8.0 |
| LDN | 56 | 74.1 | 62.6-85.3 | 6.1 | 8.2 | ||
| Weekday | Daytime (7 am–10 pm) | Leq,wdd | 56 | 71.7 | 61.0-84.2 | 5.7 | 7.9 |
| L10 | 56 | 61.5 | 50.1-75.2 | 6.6 | 10.8 | ||
| L50 | 56 | 65.9 | 55.2-78.1 | 6.5 | 9.9 | ||
| L90 | 56 | 72.5 | 61.1-82.5 | 5.5 | 7.6 | ||
| Nighttime (10 pm–7 am) | Leq,wdn | 56 | 67.9 | 55.9-79.0 | 6.2 | 9.1 | |
| L10 | 56 | 57.5 | 46.4-70.8 | 6.4 | 11.1 | ||
| L50 | 56 | 62.0 | 50.9-76.4 | 6.9 | 11.1 | ||
| L90 | 56 | 69.0 | 56.1-80.9 | 6.9 | 10.0 | ||
| All times | LDN | 56 | 74.0 | 63.3-85.5 | 6.2 | 8.5 | |
| Weekend | Daytime (7 am–10 pm) | Leq,wed | 56 | 70.0 | 54.5-83.7 | 6.3 | 9.1 |
| L10 | 56 | 61.0 | 49.4-75.7 | 6.5 | 10.7 | ||
| L50 | 56 | 65.0 | 51.8-78.3 | 6.5 | 10.0 | ||
| L90 | 56 | 71.0 | 56.1-83.5 | 6.4 | 9.0 | ||
| Nighttime (10 pm–7 am) | Leq,wen | 56 | 66.0 | 53.3-78.3 | 6.6 | 10.0 | |
| L10 | 56 | 58.3 | 47.6-72.9 | 6.5 | 11.2 | ||
| L50 | 56 | 61.9 | 51.1-76.9 | 6.7 | 10.9 | ||
| L90 | 56 | 67.7 | 54.2-80.9 | 6.8 | 10.1 | ||
| All Times | LDN | 56 | 73.5 | 60.5-84.8 | 6.3 | 8.6 |
Citywide hourly average sound pressure levels exhibited a diurnal pattern with peak levels occurring in the late morning and mid-day and lowest levels occurring in the overnight hours (Fig. 3). We observed large variability in noise levels across any hour of the day, with the most variable levels occurring during daytime hours, reflecting the spatial variability in traffic and other activity during daytime hours, which is less pronounced in the evening and at nighttime hours.
FIGure 3.

Diurnal variation of noise citywide, (n = 56).
Leq and Ldn measurements across all time periods showed a high level of correlation across the 56 sites (Table 2), with Pearson correlation coefficients over 0.75 for all variable/averaging time combinations, suggesting similar spatial patterns regardless of chosen metric. Comparison of the intermittent noise metrics (L90/L50, L90/L10) demonstrated low correlations with measures of overall noise (Table 3), with correlations below r = 0.41.
TABLE 2.
Spatial correlations among mean Leq and LDN variables by averaging period (n = 56)
| One-week Leq | Weekday daytime Leq | Weekday nighttime Leq | Weekend daytime Leq | Weekend nighttime Leq | Weekday LDN | Weekend LDN | One-week LDN | |
|---|---|---|---|---|---|---|---|---|
| One-week Leq | 0.97 | 0.93 | 0.93 | 0.91 | 0.82 | 0.94 | 0.93 | |
| Weekday daytime Leq | 0.85 | 0.88 | 0.87 | 0.75 | 0.89 | 0.88 | ||
| Weekday nighttime Leq | 0.83 | 0.90 | 0.86 | 0.90 | 0.93 | |||
| Weekend daytime Leq | 0.88 | 0.79 | 0.95 | 0.90 | ||||
| Weekend nighttime Leq | 0.87 | 0.98 | 0.96 | |||||
| Weekday LDN | 0.87 | 0.95 | ||||||
| Weekend LDN | 0.97 | |||||||
| One-week LDN |
Bold values indicate p < 0.05
TABLE 3.
Spatial correlations among average and intermittent noise metrics (n = 56)
| One-week L90/L50 | One-week L90/L10 | Weekday daytime L90/L50 | Weekday nighttime L90/L50 | Weekday daytime L90/L10 | Weekday nighttime L90/L10 | Weekend daytime L90/L50 | Weekend nighttime L90/L50 | Weekend daytime L90/L10 | Weekend nighttime L90/L10 | |
|---|---|---|---|---|---|---|---|---|---|---|
| One-week Leq | 0.20 | 0.26 | 0.08 | 0.29 | 0.14 | 0.36 | 0.12 | 0.31 | 0.14 | 0.36 |
| Weekday daytime Leq | 0.24 | 0.31 | 0.15 | 0.30 | 0.21 | 0.38 | 0.03 | 0.37 | 0.05 | 0.41 |
| Weekday nighttime Leq | 0.05 | 0.11 | −0.08 | 0.17 | −0.03 | 0.27 | 0.09 | 0.17 | 0.12 | 0.23 |
| Weekend Daytime Leq | 0.20 | 0.25 | 0.06 | 0.32 | 0.12 | 0.38 | 0.23 | 0.29 | 0.24 | 0.34 |
| Weekend nighttime Leq | 0.00 | 0.12 | −0.10 | 0.12 | −0.01 | 0.27 | −0.03 | 0.23 | 0.00 | 0.28 |
| One-week LDN | −0.02 | −0.09 | −0.16 | 0.14 | −0.16 | 0.30 | 0.06 | 0.16 | −0.04 | 0.22 |
| Weekday LDN | −0.26 | 0.16 | −0.41 | −0.03 | −0.20 | 0.23 | −0.03 | −0.02 | 0.02 | 0.03 |
| Weekend LDN | 0.08 | 0.09 | −0.05 | 0.21 | 0.03 | 0.32 | 0.10 | 0.25 | 0.12 | 0.30 |
Bold values indicate p < 0.05
Measures of 1-week overall noise, Leq and Ldn, were most strongly correlated with 2-week average levels of BC, NO, and NO2, (r = 0.61 to 0.68), and moderately correlated with PM2.5 levels (r = 0.45–0.51) (Fig. 4). Conversely, all pollutants showed poor correlations with the intermittent noise metric, nighttime L90/L50. One-week Leq was most strongly correlated with kernel weighted total traffic within 100 m of the monitoring sites (r = 0.58) with the correlation steadily declining with increasing buffer sizes (Fig. 5). Similarly, buffer size influenced the correlations with 1-week sound levels for bus traffic, number of roadways, and truck traffic, where the maximum correlations occurred at the smallest buffer size (50 m, r = 0.41, 0.36, 0.43, respectively). Building density was only moderately correlated with noise values at larger buffer sizes (r = 0.34 at 300 m).
FIGURE 4.

Correlations of 1-week noise variables with 2-week average pollutant concentrations measured during the same session.
FIGURE 5.

Spatial correlations of one-week noise with traffic and building density at varying buffer sizes.
Discussion
In this study, we evaluated and utilized low-cost, easily deployable sound level meters for measuring sound pressure levels for 1-week periods across many diverse locations in NYC. We found that these sound level loggers could be easily integrated into weather protective housings and deployed at multiple locations simultaneously with good data quality and reasonable sample completeness. We observed wide intraurban spatial variation in overall ambient noise levels and found strong correlations between overall average noise exposure metrics regardless of metric averaging time.
Sound levels across the city exhibited a diurnal pattern with the highest average hourly levels occurring in the late-morning and mid-day and lowest levels occurring overnight. This is consistent with results previously observed at one high traffic location in NYC, where levels began increasing at 4–6 a.m., coinciding with the beginning of rush hour.20 We also found significantly higher levels on weekdays as compared to weekends, although the difference was smaller than what was observed in Ross et al. 2011, likely due to the inclusion of many low traffic locations in our study as opposed to a single high traffic location along a commuter corridor.
We observed differing patterns in average noise and intermittent noise, defined as the ratio of the highest values to median and background levels. This could partly be due to limitations in how the intermittent noise metric is constructed-quieter sites, with lower median levels that will exhibit larger ratios due to the larger influence of temporarily noisy activity relative to the quieter background, while typically louder locations tend to have lower ratios due to their higher background levels. However, the lack of correlation (as opposed to strong negative correlations) may suggest a unique characteristic of the sound environment at some locations not identified through average noise metrics. Additional work will benefit from evaluating and developing alternative, intermittent environmental noise indices that can better characterize different characteristics of noise exposures. This may be particularly important in the context of health studies, as some have previously demonstrated the importance of intermittent overnight noise levels in sleep disturbance,30 and the potential importance of transient sounds relative to background levels due to noise habituation.28,29
We also found strong correlations in average noise levels and indicators of traffic, particularly at smaller buffer sizes around our noise monitors (≤100 m). Total kernel-weighted traffic density was the best predictor of average noise levels, followed by road density, truck traffic, and bus traffic. While prior studies have examined relationships of noise and traffic density using metrics such as inverse distance to roadways,16 traffic density at the monitoring site,19 or through land-use regression modeling of roadway lengths in buffers,43 we evaluated associations with traffic intensity in varying buffer sizes to demonstrate the spatial scale of impacts, showing decreasing correlations with larger buffer sizes. We found relatively lower correlations of average noise levels with built space density, although in future multivariate models, this indicator may be useful in capturing spatial variation due to non-traffic-related noise. We observed moderately negative correlations between intermittent noise metrics and traffic density, which may highlight the limitations in the intermittent noise metric when evaluated spatially, as conducted in this analysis—high traffic sites exhibiting lower intermittent noise ratios due to louder background and median noise levels.
The high density of co-located air quality and noise measurements in this study provided an opportunity to assess the relationship between noise and air quality. Correlations between noise levels and NO and NO2 were consistent with previously observed studies of spatial patterns in noise and air pollutants. In a study in Chicago, IL and Riverside, CA, researchers reported moderate correlations (r = 0.2–0.6, depending on location and time period) between short-term Leq (5 min) and 2-week average pollutant levels.16 Similarly, correlations between 5-min Leq and 2-week average NO2 were reported at 0.53 in Vancouver, BC while reported correlations between average 24-h noise and monthly NO2 levels in Spain were 0.62.18,19 In our study, we observed that noise NO/NO2 correlations were more consistent with those found by Forester et al. (2010), possibly due to the longer sampling time applied to characterize average noise levels.
Our findings that noise and air pollutants, particularly BC, NO, and NO2, show similar spatial patterns in NYC due to shared nearby traffic sources suggest that noise could potentially confound relationships between traffic air pollution and health outcomes observed in intraurban air pollution epidemiologic studies. Prior reviews of cardiovascular morbidity have suggested that failure to account for noise or stress as potential confounders limits the ability to infer a causal association between traffic pollutant exposures and health outcomes.15 In addressing noise as a potential confounder, a study of the relationship between NO2 and all-cause and cardiovascular deaths found that while NO2 associations remained significant after adjustment for noise, there was substantial attenuation in the NO2 risk estimate.44 Gan et al. 2012 reported independent effects of traffic-related noise and air pollution in the analyses of coronary heart disease deaths in Vancouver. A more recent systematic review has suggested that while there is limited evidence of confounding between noise and traffic-related air pollutants, better indicators of near-road exposures are needed.45 If intermittent noise metrics are relevant for health impacts, their risks may be less confounded by air pollution because they are less spatially correlated with combustion-related pollutants. Our study showed a strong correlation of noise with nearby traffic density (within 100 m) which contrast to prior studies that show the larger spatial extent of combustion-related traffic pollutants,46,47 suggesting that noise monitoring could provide opportunities to disentangle the cardiovascular risks of combustion and non-combustion traffic pollution. Our findings of correlations in nearby traffic density, noise metrics, and air pollution suggest that the nature and extent of confounding (or synergism) between traffic-related noise and traffic-related air pollutants may vary depending on the unit of spatial scale and the type of pollutants used in the study design. These issues, as well as those related to non-road sources of noise and air pollution, such as airports and marine ports will need to be investigated in future studies.
Notably, all monitoring sites exceeded EPA and WHO guidelines for noise levels set to avoid activity interference and annoyance (EPA: Ldn = 55 dBA, WHO: Leq,day = 55 dBA), while over half of sites’ 1-week Leq exceeded EPA noise guidelines for hearing loss (Leq,24h = 70 dBA).39,48 Highest average noise levels were found in the high population density areas of Manhattan and throughout the city near major roadways and transportation corridors, with maximum average Ldn levels reaching 85, or 30 dBA higher than EPA-recommended outdoor limits.39 It should be noted that while lamppost measurements represent the environments applicable to EPA annoyance guidelines (general outdoor areas where people spend time), WHO guidelines are at building facades which can be lower than road-side measures and EPA hearing loss guidelines are based on personal measurement that can vary widely throughout daily activities. However, our findings that many sites exceed all guidelines, often by large amounts, indicates that ambient noise in NYC can often be present above the health-based guidelines throughout the city.
It is important to note that these results were collected in only one season, with noise and air pollution levels characterized over 1- and 2-week periods, respectively. While we believe that spatial patterns in noise and air pollutants should remain consistent over time due to stable patterns in locations of sources such as major roadways, we recognize the possible limitations due to transient sources not observed during routine field visits. Similarly, exposures will vary widely by season, whether windows are open, amount time spent outdoors, and characteristics of the indoor environment. These limitations are inherent in all environmental sampling studies where chronic exposures are often extrapolated from short-term measurements, in some cases using even shorter time spans than considered here. Our estimates of intermittent noise may be particularly sensitive to these sample time limitations as unique, short-term high noise events are possible at some locations that may not be typical for a specific location. Future repeat sampling at our monitoring sites will determine whether spatial patterns in overall noise, air pollution, and intermittent noise metrics are stable over time.
Conclusions
We found that low cost, easily deployable long-term sound level meters, such as the units used in this study, can offer methods for collecting highly resolved spatial and temporal data to assess noise exposures. We observed strong correlations between alternative noise metrics that characterize average noise exposures, but low correlations among average exposure metrics and indices of intermittent noise. Average noise levels were well correlated with combustion-related pollutants, most notably NO, NO2, and BC and average noise levels correlated with traffic density in close proximity to monitoring sites. Characterization of the spatial patterns of multiple exposures will be useful in developing risk models for health effects research and ultimately strategies that mitigate exposures to traffic-related chemical and non-chemical stressors.
Acknowledgements
We thank John Gorczynski, Jordan Werbe-Fuentes, Anna Tilles, Rolando Munoz, Andres Camacho, and Steves Vanderpool of Queens College for their help in data collection. This work was supported by City of New York tax levy funds.
Footnotes
This work was supported by City of New York tax levy funds.
References
- 1.Babisch W. Road traffic noise and cardiovascular risk. Noise Health. 2008;10(38):27–33. doi: 10.4103/1463-1741.39005. [DOI] [PubMed] [Google Scholar]
- 2.Babisch W, Buele B, Schust M, Kersten N, Ising H. Traffic noise and risk of myocardial infarction. Epidemiology. 2005;16(1):33–39. doi: 10.1097/01.ede.0000147104.84424.24. [DOI] [PubMed] [Google Scholar]
- 3.Bendokiene I, Grazuleviciene R, Dedele A. Risk of hypertension related to road traffic noise among reproductive-age women. Noise Health. 2011;13(55):371–377. doi: 10.4103/1463-1741.90288. [DOI] [PubMed] [Google Scholar]
- 4.Bodin T, Albin M, Ardö J, Stroh E, Ostergren PO, Björk J. Road traffic noise and hypertension: results from a cross-sectional public health survey in southern Sweden. Environ Health. 2009; 8(38). [DOI] [PMC free article] [PubMed]
- 5.Van Kempen E, Babisch W. The quantitative relationship between road traffic noise and hypertension: a meta-analysis. J Hypertens. 2012;30(6):1075–1086. doi: 10.1097/HJH.0b013e328352ac54. [DOI] [PubMed] [Google Scholar]
- 6.Babisch W. The noise/stress concept, risk assessment and research needs. Noise Health. 2002;4:1–11. [PubMed] [Google Scholar]
- 7.Stansfeld SA, Berglund B, Clark C, et al. Aircraft and road traffic noise and children’s cognition and health: a cross-national study. Lancet. 2005;365(9475):1942–1949. doi: 10.1016/S0140-6736(05)66660-3. [DOI] [PubMed] [Google Scholar]
- 8.Haralabidis AS, Dimakopoulou K, Vigna-Taglianti F, Giampaolo M, Borgini A, Dudley ML. Acute effects of night-time noise exposure on blood pressure in populations living near airports. Euro Heart J. 2008;29(5):658–664. doi: 10.1093/eurheartj/ehn013. [DOI] [PubMed] [Google Scholar]
- 9.Jarup L, Babisch W, Houthuijs D, et al. Hypertension and exposure to noise near airports: the HYENA study. Environ Health Perspect. 2008;116(3):329–333. doi: 10.1289/ehp.10775. [DOI] [PMC free article] [PubMed] [Google Scholar]
- 10.Di Nisi J, Muzet A, Ehrhart J, Libert JP. Comparison of cardiovascular responses to noise during waking and sleeping hours. Sleep. 1990;13(2):108–120. doi: 10.1093/sleep/13.2.108. [DOI] [PubMed] [Google Scholar]
- 11.Babisch W. Traffic noise and cardiovascular disease: epidemiological review and synthesis. Noise Health. 2000;2(8):9–32. [PubMed] [Google Scholar]
- 12.Halonen JI, Vahtera J, Stansfield S, et al. Association between nighttime traffic noise and sleep: the Finnish public sector study. Environ Health Perspect. 2013;121(5):a147. doi: 10.1289/ehp.121-a147. [DOI] [PMC free article] [PubMed] [Google Scholar]
- 13.World Health Organization. Night Noise Guidelines for Europe. 2009; http://www.euro.who.int/__data/assets/pdf_file/0017/43316/E92845.pdf. Accessed March 27, 2013.
- 14.Schwela DH. The World Health Organization guidelines for environmental health. Noise/News International. 2000:9-22.
- 15.Health Effects Institute Panel on the Health Effects of Traffic-Related Air Pollution. Traffic-Related Air Pollution: a Critical Review of the Literature on Emissions, Exposure, and Health Effects. HEI Special Report 17. Boston, MA 2010.
- 16.Allen RW, Davies H, Cohen MA, Mallach G, Kaufman JD, Adar SD. The spatial relationship between traffic-generated air pollution and noise in two US cities. Environ Res. 2009;109(3):334–342. doi: 10.1016/j.envres.2008.12.006. [DOI] [PMC free article] [PubMed] [Google Scholar]
- 17.Beelen R, Hoek G, Houthuijs D, et al. The joint association of air pollution and noise from road traffic with cardiovascular mortality in a cohort study. Occup Environ Med. 2009;66(4):243–250. doi: 10.1136/oem.2008.042358. [DOI] [PubMed] [Google Scholar]
- 18.Davies HW, Vlaanderen JJ, Henderson SB, Brauer M. Correlation between co-exposures to noise and air pollution from traffic sources. Occup Environ Med. 2009;66(5):347–350. doi: 10.1136/oem.2008.041764. [DOI] [PubMed] [Google Scholar]
- 19.Foraster M, Deltell A, Basagaña X, et al. Local determinants of road traffic noise levels versus determinants of air pollution levels in a Mediterranean city. Environ Res. 2011;111(1):177–183. doi: 10.1016/j.envres.2010.10.013. [DOI] [PubMed] [Google Scholar]
- 20.Ross Z, Kheirbek I, Clougherty JE, et al. Noise, air pollutants, and traffic: continuous measurement and correlation at a high traffic location in New York City. Environ Res. 2011;111(8):1054–1063. doi: 10.1016/j.envres.2011.09.004. [DOI] [PubMed] [Google Scholar]
- 21.Ising H, Lange-Asschenfeldt H, Lieber G-F, Moriske HJ, Weinhold H. Exposure to traffic-related air pollution and noise and the development of respiratory diseases in children. J Child Health. 2004;2:145–157. doi: 10.3109/15417060490906477. [DOI] [Google Scholar]
- 22.Kheirbek I, Johnson S, Ross Z, et al. Spatial variability in levels of benzene, formaldehyde, and total benzene, toluene, ethylbenzene and xylenes in New York City: a land-use regression study. Environ Health. 2012;11(51). [DOI] [PMC free article] [PubMed]
- 23.Clougherty JE, Kheirbek I, Eisl HM, et al. Intra-urban spatial variability in wintertime street-level concentrations of multiples combustion-related air pollutants: the New York City community air survey (NYCCAS). Journal of Exposure Science and Environmental Epidemiology 2013;1(9). [DOI] [PubMed]
- 24.Dratva J, Phuleria HC, Foraster M, Gaspoz JM, Keidel D, Künzli N. Transportation noise and blood pressure in a population-based sample of adults. Environ Health Perspect. 2012;120:50–55. doi: 10.1289/ehp.1103448. [DOI] [PMC free article] [PubMed] [Google Scholar]
- 25.Gan WQ, Davies HW, Koehoorn M, Brauer M. Association of long-term exposure to community noise and traffic-related air pollution with coronary heart disease mortality. Am J Epidemiol. 2012;175(9):898–906. doi: 10.1093/aje/kwr424. [DOI] [PubMed] [Google Scholar]
- 26.Gan W, McLean K, Brauer M, Chiarello S, Davies H. Modeling population exposure to community noise and air pollution in a large metropolitan area. Environ Res. 2012;116:11–16. doi: 10.1016/j.envres.2012.04.001. [DOI] [PubMed] [Google Scholar]
- 27.Ausejo M, Recuero M, Asensio C, Pavon I, Lopez JM. Study of precision, deviations, and uncertainty in the design of the strategic noise map of the macrocenter of the city of Buenos Aires, Argentina. Environ Model Assess. 2010;15:125–135. doi: 10.1007/s10666-009-9191-9. [DOI] [Google Scholar]
- 28.Eberhardt JL, Akselsson KR. The disturbance by road traffic noise of the sleep of young male adults as recorded in the home. J Sound Vib. 1987;144(3):417–434. doi: 10.1016/S0022-460X(87)80014-7. [DOI] [Google Scholar]
- 29.Passchier-Vermeer W, Passchier WF. Noise exposure and public health. Environ Health Perspect. 2000;108(suppl 1):123–131. doi: 10.1289/ehp.00108s1123. [DOI] [PMC free article] [PubMed] [Google Scholar]
- 30.Kawada T. Noise and health-sleep disturbance in adults. J Occup Health. 2011;53(6):413–416. doi: 10.1539/joh.11-0071-RA. [DOI] [PubMed] [Google Scholar]
- 31.Eberhardt JL, Stråle L-O, Berlin M. The influence of continuous and intermittent traffic noise on sleep. J Sound Vib. 1987;116(3):445–464. doi: 10.1016/S0022-460X(87)81376-7. [DOI] [Google Scholar]
- 32.American Housing Survey. US Census Bureau; 2009. http://www.census.gov/housing/ahs/data/.
- 33.Matte TD, Ross Z, Kheirbek I, et al. Monitoring intraurban spatial patterns of multiple combustion air pollutants in New York City: design and implementation. Journal of Exposure Science and Environmental Epidemiology. 2013;1(9). [DOI] [PubMed]
- 34.Neitzel R, Daniell WE, Sheppard L, Davies HW, Seixas NS. Evaluation and comparison of three exposure assessment techniques. J Occup Environ Hyg. 2011;8(5):310–323. doi: 10.1080/15459624.2011.568832. [DOI] [PMC free article] [PubMed] [Google Scholar]
- 35.Seixas N, Neitzel R, Sheppard L, Goldman B. Alternative metrics for noise exposure among construction workers. Ann Occup Hyg. 2005;49(6):493–502. doi: 10.1093/annhyg/mei009. [DOI] [PubMed] [Google Scholar]
- 36.American National Standards on Acoustics. ANSI S1.4: specification for sound level meters: American Institute of Physics for the Acoustical Society of America; 1983.
- 37.New York City Department of Health and Mental Hygiene. NYC Community Air Survey, In: New York City Department of Health and Mental Hygiene, ed. New York City 2013.
- 38.International Organization for Standardization. ISO 9835, Ambient Air- Determination of a Black Smoke Index1993.
- 39.US Environmental Protection Agency. Information on Levels of Environmental Noise Requisite to Protect Public Health and Welfare with an Adequate Margin of Safety. In: office of noise abatement and control, ed. Washington D.C.1974.
- 40.Pitney Bowes Inc. MPSI TrafficMetrix. 2013; http://www.pb.com/software/Data-Products/Street-and-Transportation-Data/MPSI-TrafficMetrix.shtml.
- 41.New York Metropolitan Transportation Council. General Final Report: New York Best Practice Model 2005.
- 42.New York City Department of City Planning. BYTES of the BIG APPLE. 2008; http://www.nyc.gov/html/dcp/html/bytes/applbyte.shtml.
- 43.Xie D, Liu Y, Chen J. Mapping urban environmental noise: a land use regression method. Environ Sci Technol. 2011;45:7358–7364. doi: 10.1021/es200785x. [DOI] [PubMed] [Google Scholar]
- 44.Raaschou-Nielsen O, Anderson ZJ, Jensen SS, et al. Traffic air pollution and mortality from cardiovascular disease and all causes: a Danish cohort study. Environ Health. 2012;11(60). [DOI] [PMC free article] [PubMed]
- 45.Tetreault L-F, Perron S, Smargiassi A. Cardiovascular health, traffic-related air pollution and noise: are associations mutually confounded? A systematic review. Int J Public Health. 2013. [DOI] [PMC free article] [PubMed]
- 46.Beckerman B, Jerrett M, Brook JR, Verma DK, Arain MA, Finkelstein MM. Correlation of nitrogen dioxide with other traffic pollutants near a major expressway. Atmos Environ. 2008;42:275–290. doi: 10.1016/j.atmosenv.2007.09.042. [DOI] [Google Scholar]
- 47.Karner AA, Eisinger DS, Niemeier DA. Near-roadway air quality: synthesizing the findings from real-world data. Environ Sci Technol. 2010;44:5334–5344. doi: 10.1021/es100008x. [DOI] [PubMed] [Google Scholar]
- 48.World Health Organization Europe. Night Noise Guidelines for Europe. In: WHO Regional Office for Europe, ed. Copenhagen, Denmark: WHO; 2009.