

Abstract
Objective
To examine the associations between abnormal birth history (birth weight [BW] <2500 grams, gestational age <36 weeks, or small for gestational age), BP, and renal function among 332 participants (97 with abnormal and 235 with normal birth history) in the Chronic Kidney Disease in Children (CKiD) Study, a cohort of children with chronic kidney disease (CKD).
Study design
Casual and 24-hour ambulatory BP were obtained. Glomerular filtration rate (GFR) was determined by iohexol disappearance. Confounders (birth and maternal characteristics, socioeconomic status) were used to generate predicted probabilities of abnormal birth history for propensity score matching. Weighted linear and logistic regression models with adjustment for quintiles of propensity scores and CKD diagnosis were used to assess the impact of birth history on BP and GFR.
Results
Age at enrollment, percent with glomerular disease, and baseline GFR were similar between the groups. Those with abnormal birth history were more likely to be female, of Black race or Hispanic ethnicity, to have low household income, or part of a multiple birth. Unadjusted BP measurements, baseline GFR and change in GFR did not differ significantly between the groups; no differences were seen after adjusting for confounders by propensity score matching.
Conclusions
Abnormal birth history does not appear to have exerted a significant influence on BP or GFR in this cohort of children with CKD. The absence of an observed association is likely secondary to the dominant effects of underlying CKD and its treatment.
There is growing evidence that adverse events early in life, particularly in utero, increase the risk of chronic diseases. Children with chronic kidney disease (CKD) are more likely to have been premature, low-birth weight, or small for gestational age compared with children without chronic kidney disease [1,2]. Abnormal birth history (defined as premature, low-birth weight, or small for gestational age) may be an indicator of impaired nephrogenesis [3-6], which in turn may increase the risk for hypertension and chronic kidney disease [3,7].
In the general population, abnormal birth history is known to be associated with a higher incidence of adult cardiovascular disease [8,9]. The effect on adult blood pressure (BP) is reasonably well established [10-13]. Recent studies have found inverse associations between birth weight and several BP measaures, even in the pediatric age range [10, 14-21].
Among children with CKD, the effect of abnormal birth history on BP and renal function has not yet been studied. If abnormal birth history is associated with increased BPs or worsening renal function in the presence of CKD, such children may require more intensive monitoring and therapy early in life. The purpose of the present analysis is to investigate the effect of abnormal birth history on casual and ambulatory BP (ABP) and renal function among children with CKD.
Methods
The Chronic Kidney Disease in Children (CKiD) Study is a prospective observational cohort study initiated in 2005 to investigate the natural history of chronic kidney disease (CKD) at 51 pediatric nephrology centers in North America [22]. A list of participating investigators and centers is included as Appendix 1 in the online supplement. The study protocol was approved by the Institutional Review Boards of each participating center and informed consent and assent were obtained from all participants according to local requirements.
Children were eligible for enrollment in CKiD based on age (1 to 16 years) and estimated Schwartz formula glomerular filtration rate (GFR) (30 to 90 mL/minute/1.73m2 [23]). Clinical and demographic data were collected at baseline, including CKD diagnosis. The primary diagnosis of CKD was self-reported at baseline for each participant and categorized as either non-glomerular or glomerular. Full descriptions of the CKD diagnoses and their associated categories used in the CKiD study have been previously reported [2,22].
Abnormal birth history
Low birth weight (LBW), premature birth and small for gestational age (SGA) were parent-reported at study entry with the following definitions: LBW was birth weight <2500g, prematurity was gestational age <36 weeks, and SGA was birth weight <10th percentile for gestational age as previously reported [2]. Abnormal birth history for purposes of this analysis was defined as the presence of any one of these abnormalities (LBW, premature or SGA).
Outcomes
The primary outcomes of interest were BP levels and variability (casual and ambulatory), ambulatory heart rate (HR) variability, and change in GFR. Casual BP measurements were obtained at each CKiD study visit using an aneroid sphygmomanometer. At each study visit, three BP measurements at 30-second intervals were obtained by auscultation of the brachial artery using the first Korotkoff sound for SBP and the fifth Korotkoff sound for DBP. The average of the three BP measurements was recorded as the participant's casual BP for that visit. The CKiD Clinical Coordinating Centers provided all participating sites the same aneroid sphygmomanometer (Mabis MedicKit 5; Mabis Healthcare, Waukegan, IL). CKiD clinical staff were trained and certified yearly in the auscultatory BP measurement technique, and annual calibration of each center's aneroid device was performed. Details of the standardized casual BP measurement technique have been previously published [24].
Ambulatory BP monitoring (ABPM) was performed one year after study entry, and every other year thereafter using a SpaceLabs 90217 oscillometric device (SpaceLabs Healthcare, Issaquah, WA). Monitors are programmed centrally at the ABPM Center (University of Texas at Houston), shipped to the clinical sites, and placed on the subject's non-dominant arm. BP readings were obtained every 20 minutes throughout the monitoring period. All participating clinical sites received annual training in monitor placement from the ABPM Center. Details of the ABPM procedure have been previously described [25]. Because we were interested in the putative effect of abnormal birth history on ABP, the analysis was restricted to participants with available ABPM data.
Casual BP levels were summarized by age-, sex-, and height-adjusted z-scores [26] and were interpreted as standard deviation units from the mean of the normal population (z-score = 0). Summarized ABP levels are reported BP index, calculated as the mean ambulatory BP, by wake or sleep state, divided by the corresponding 95th percentile for age, sex, and height for the normal population as previously reported [25]. Ambulatory BP load represents the proportion of readings greater than the 95th percentile, by wake and sleep states. Mean systolic BP (SBP) or diastolic BP (DBP) levels above the 95th percentile or SBP or DBP loads greater than 25%, for each wake and sleep states were classified as having abnormal ABP [25].
GFR was determined at each annual CKiD study visit. Directly measured GFR (iGFR) by iohexol plasma clearance occurred at study entry, one year later and then biennially. When iohexol GFR was not measured, estimated GFR (eGFR) was used in its place [23], a validated approach used previously with CKiD data [27,28]. This combination of iGFR and eGFR is hereafter referred to as ieGFR [27]. Individual regressions of ieGFR in the log scale (dependent variable) on time in years (independent variable) provided subject-specific intercepts and slopes [27], which are interpreted as GFR at study entry and the average change in GFR over time, respectively. The 332 subjects included in the analysis contributed 1736 ieGFR measurements and 50% of these subjects contributed 5 observations (approximately 4 years of follow-up). Urine protein:creatinine ratio (mg/mg of creatinine) was measured at each annual CKiD study visit [22].
Propensity scores
In order to determine the effect of abnormal birth history on BP and GFR measurements, independent of confounders such as maternal factors and SES, propensity score matching and weighting methods [29,30] were used to create comparable groups of exposed subjects (children with abnormal birth history) and unexposed subjects (children without abnormal birth history) who were similar with respect to baseline characteristics. Matching of propensity scores, which reflect each child's predicted probability of having an abnormal birth history, was used to achieve balance in confounding variables between the exposed (abnormal birth history) and unexposed (normal birth history) children. The propensity scores were derived from a logistic regression model with the odds of abnormal birth history as a function of observed baseline demographic, clinical and maternal characteristics. Demographic variables included sex, race (black vs. non-black), ethnicity (Hispanic vs. non-Hispanic) and age of the child at time of study entry. Clinical variables included primary CKD diagnosis (glomerular vs. non-glomerular), percent of life with CKD (> 90%, 50 to 90%, <50%) and history of twin/multiple birth. Maternal variables were age at birth (< or ≥24 years), highest level of education attained, height, weight and BMI at time of study entry; and household socioeconomic status: household income (<$36 000/year), birth parents living separately, a family size of less than three, adult smoker in the household and no employer health insurance at the time of study entry.
Variables that were in the causal pathway from abnormal birth history and disease severity were excluded from matching because these would mediate the putative detrimental effects of abnormal birth history (for example, hospital intensive care after birth is a marker of abnormal birth history and not a predictor of the exposure).
For a small percentage of subjects, maternal height (7%) and weight (9%), and subsequently BMI (11%), were missing. We imputed the sample mean in these missing observations and created indicator (binary) variables for missingness. Previous work has suggested this approach is appropriate for propensity score matching [31]. Among variables where there was less than 5% missing, the sample mean was imputed to complete missing data.
Matching method
Full constrained matching was used to create weighted pseudopopulations of exposed and unexposed subjects. The purpose of this matching method is to create matched sets of subjects with similar propensity scores that include either one exposed subject and multiple unexposed subjects, or one unexposed subject and multiple exposed subjects. Subject-specific weights were derived from these matched sets and used in regression models described below. We imposed constraints adapted for this particular dataset, as recommended by Stuart & Green [32] that allowed poorly matched subjects to be discarded, at least one unexposed subject per exposed subject and no more than 10 unexposed subjects per exposed subjects. Other matching methods (1:1 nearest neighbor matching and unconstrained full matching) were explored in a sensitivity analysis by comparing standardized biases of the confounding variables, and the inferences remained unchanged.
Statistical analyses
Clinical and demographic characteristics and outcome variables were compared based on birth history status and summarized by descriptive statistics. Outcome variables were converted to the log scale due to skewed distributions, and geometric means are presented, with the exception of BP z-scores, which were normally distributed. Two-sample t-tests in the log scale and Fisher exact tests were used to compare univariate differences by birth history status. To determine the effect of exposure, we used weighted linear and logistic regression models with a main effect of abnormal birth history and adjustment for quintiles of propensity scores (based on the distribution abnormal birth history subjects). Weights were derived from the matched sets defined from the full constrained matching algorithm. Specifically, weights were calculated as the relative number of exposed to unexposed subjects within each matched set and scaled to the ratio of exposed to unexposed subjects in the study sample in order to estimate the average treatment effect on the treated [30]. Interactions with quintiles of propensity scores were assessed and excluded if the interaction was not significant. The threshold for significance was P< 0.05. For continuous variables, adjusted mean values with 95% confidence intervals were reported for the reference group: subjects in the 3rd quintile of propensity score with and without abnormal birth history. For dichotomous variables, the adjusted proportion calculated from a logistic regression model for the same reference group with and without abnormal birth history was reported. We additionally adjusted for CKD diagnosis (glomerular versus non-glomerular) as a covariate in the weighted analysis. As sensitivity analyses, we repeated the weighted analyses and included proteinuria as a covariate in the model, and also conducted the same models excluding CKD diagnosis as a covariate. All statistical analyses were conducted in R, version 2.14.0, using the MATCHIT package [33,34]. This package allows for the generation of propensity scores, formation of matched sets and calculation of weights in a unified setting.
Results
Baseline demographic and clinical characteristics of subjects, stratified by birth history status, are presented in Table I. Subjects with abnormal birth history were more likely to be female, Black, part of a multiple birth and have characteristics related to lower SES (household income < $36 000, birth parents not living together, younger maternal age at birth, household less likely to have employer-based insurance). There was no difference in antihypertensive medication use (any, ACEi, ARB or diuretics) between subjects with normal and abnormal birth history. Variables listed in Table I, except for glomerular diagnosis and use of antihypertensive medications, were included as predictors in the logistic model to generate propensity scores.
Table 1.
Baseline demographic and clinical characteristics of 332 subjects with complete ABPM data by abnormal BH status (low birth weight, premature or small for gestational age).
| Table | Normal BH n= 235 |
Abnormal BH n= 97 |
P value |
|---|---|---|---|
| Age at study entry (yrs) | 12.1 [8.44, 14.76] | 11.28 [7.98, 14.39] | 0.202 |
| Female | 35% (83) | 58% (56) | <0.001 |
| Black race | 13% (30) | 26% (25) | 0.006 |
| Hispanic ethnicity | 13% (29) | 21% (20) | 0.060 |
| Glomerular disease | 20% (47) | 18% (17) | 0.649 |
| Percent of life with CKD | 91% [36%, 100%] | 86% [35%, 100%] | 0.521 |
| Percent of life with CKD | |||
| > 90% | 50% (118) | 46% (45) | 0.548 |
| 50% to ≤90% | 20% (46) | 23% (22) | 0.551 |
| <50 % | 30% (71) | 31% (30) | 0.896 |
| Multiple birth | 5% (12) | 15% (15) | 0.003 |
| Maternal height (in) at study entry | 64 [63, 66] | 64 [62, 66] | 0.269 |
| Maternal weight (lb) at study entry | 155.5 [136, 188] | 157.5 [130, 186] | 0.738 |
| Maternal BMI (kg/m2) at study entry | 27.28 [23.49, 32.1] | 28.49 [22.91, 32.49] | 0.694 |
| Household Income < $36000 | 34% (80) | 47% (46) | 0.025 |
| Maternal education ≤ high school | 39% (91) | 44% (42) | 0.457 |
| Birth parents not living together | 31% (72) | 44% (43) | 0.022 |
| Maternal age at birth <24 years | 25% (58) | 37% (36) | 0.032 |
| Adult smoker in household | 30% (71) | 35% (34) | 0.365 |
| Family has employer insurance | 66% (150) | 53% (48) | 0.039 |
| Family has state-based insurance | 18% (41) | 26% (23) | 0.160 |
| Family size ≤ 3 people | 22% (52) | 21% (20) | 0.884 |
| Any antihypertensive medicationa | 69% (161) | 69% (67) | 0.999 |
Self-reported medication use.
The Figure presents the distribution of the propensity scores before and after full constrained matching by birth history status, displaying individual subjects as well as overall distributions by boxplots. The unmatched distributions demonstrate that the subjects with abnormal birth history had a higher propensity for abnormal birth and the normal subjects did not, providing support for the validity of our model. Importantly, there was substantial overlap, or common support, between the two distributions, which is an important condition for matching methods. Three subjects with abnormal birth history with high propensity for the exposure were discarded because there were no appropriate matches among the normal subjects. Similarly, 23 normal subjects with birth history were discarded, and these subjects had low propensity for being abnormal. The discontinuous boxplots represent the weighted distributions after matching and describe the 94 abnormal and 212 normal subjects with birth history used in the final (weighted/adjusted) analysis. These distributions were similar by birth history status; however, the upper 25th percentile tended to have lower propensity scores among normal subjects birth history.
Casual BP, ambulatory BP variables (mean and summarized levels), ambulatory BP and HR variability and renal outcomes (GFR level at study entry and % change per year) among the unmatched study sample (n=332) are presented in Table II. The casual median SBP and DBP z-scores in the study subjects were higher than a normal population. Although SBP tended to be higher among children with abnormal birth history (z-score= 0.39 vs. 0.18, p= 0.255), DBP was similar in the two groups (z-score= 0.24 vs. 0.28, p= 0.918). Ambulatory BP was also elevated in both groups of CKD patients, and approached the clinical definition of hypertension as indicated by BP Indices (mean BP level divided by the 95th percentile limit) ranging from 0.83-0.92. The proportion of subjects with abnormal ambulatory BP (as defined by either elevated mean levels or load) was also similar regardless of birth history status. GFR at entry was similar in CKD patients with and without an abnormal birth history (geometric means were 46.7 vs. 45.6 ml/min/1.73m2, p= 0.573) as was proteinuria (geometric means 0.45 mg/mg creatinine vs 0.45, p= 0.948). Both groups demonstrated substantial declines in renal function over time (about 4% and 5% per year, on average).
Table 2.
Descriptive statistics of ABPM outcomes, by normal and abnormal birth history.
| Outcome | Normal birth history n= 235 |
Abnormal birth history n= 97 |
P-value |
|---|---|---|---|
| Casual BP | |||
| Casual SBP z-scorea | 0.24 (-0.87, 1.35) | 0.41 (-0.75, 1.55) | 0.214 |
| Casual DBP z-scorea | 0.36 (-0.67, 1.39) | 0.40 (-0.60, 1.39) | 0.761 |
| Ambulatory BP | |||
| Wake SBP Mean | 115 (105, 128) | 115 (104,127) | 0.674 |
| Sleep SBP Mean | 102 (92, 114) | 103 (92,114) | 0.950 |
| Wake DBP Mean | 71 (63, 80) | 71 (63,81) | 0.923 |
| Sleep DBP Mean | 59 (51, 68) | 59 (51,68) | 0.882 |
| Wake MAP Mean | 87 (79, 95) | 86 (78, 95) | 0.833 |
| Sleep MAP Mean | 75 (68, 84) | 75 (67, 84) | 0.865 |
| Summarized ambulatory BP | |||
| Wake SBP Indexb | 0.90 (0.82, 0.99) | 0.91 (0.83, 1.00) | 0.413 |
| Sleep SBP Indexb | 0.91 (0.81, 1.02) | 0.92 (0.83,1.03) | 0.303 |
| Wake DBP Indexb | 0.84 (0.75, 0.94) | 0.85 (0.75, 0.96) | 0.648 |
| Sleep DBP Indexb | 0.89 (0.77, 1.02) | 0.89 (0.77, 1.03) | 0.853 |
| Wake SBP > 95th Limit | 11.1% (26) | 12.4% (12) | 0.709 |
| Sleep SBP > 95th Limit | 16.2% (38) | 20.6% (20) | 0.343 |
| Wake DBP > 95th Limit | 5.5% (13) | 10.3% (10) | 0.152 |
| Sleep DBP > 95th Limit | 19.1% (45) | 15.5% (15) | 0.531 |
| Wake SBP load > 25% | 24.7% (58) | 30.9% (30) | 0.274 |
| Sleep SBP load > 25% | 29.4% (69) | 36.1% (35) | 0.243 |
| Wake DBP load > 25% | 18.3% (43) | 25.8% (25) | 0.136 |
| Sleep DBP load > 25% | 37.0% (87) | 37.1% (36) | 1.000 |
| Abnormal ABPc | 49.8% (117) | 49.5% (48) | 1.000 |
| Ambulatory BP variability | |||
| Wake SBP SD | 9.9 (8.1, 12.3) | 9.8 (7.7, 12.5) | 0.731 |
| Sleep SBP SD | 8.1 (5.9, 11.1) | 7.9 (5.9, 10.5) | 0.514 |
| Wake DBP SD | 9.3 (7.6, 11.4) | 9.3 (7.4, 11.6) | 0.903 |
| Sleep DBP SD | 7.6 (5.7, 10.0) | 7.8 (6.1, 9.8) | 0.435 |
| Wake SBP CV | 0.09 (0.07,0.11) | 0.08 (0.07, 0.11) | 0.856 |
| Sleep SBP CV | 0.08 (0.06, 0.11) | 0.08 (0.06,0.11) | 0.581 |
| Wake DBP CV | 0.13 (0.10, 0.17) | 0.13 (0.10, 0.17) | 0.915 |
| Sleep DBP CV | 0.13 (0.10, 0.17) | 0.13 (0.10, 0.17) | 0.363 |
| Wake MAP SD | 8.7 (7.1, 10.6) | 8.8 (7.2, 10.9) | 0.399 |
| Sleep MAP SD | 7.0 (5.2, 9.3) | 6.9 (5.3, 9.0) | 0.769 |
| Wake MAP CV | 0.10 (0.08, 0.13) | 0.10 (0.08, 0.13) | 0.323 |
| Sleep MAP CV | 0.09 (0.07, 0.12) | 0.09 (0.07,0.12) | 0.691 |
| SBP % dipping | 10.6 (5.8, 19.3) | 10.2 (5.5, 18.6) | 0.561 |
| DBP % dipping | 15.8 (8.8, 28.4) | 16.3 (10.5, 25.4) | 0.599 |
| SBP % dipping < 10% | 34.5% (81) | 39.2% (38) | 0.451 |
| DBP % dipping < 10% | 14.5% (34) | 14.4% (14) | 1.000 |
| Ambulatory HR variability | |||
| Wake HR SD | 12.0 (8.8, 16.4) | 11.7 (8.8, 15.5) | 0.436 |
| Sleep HR SD | 8.4 (5.8, 12.1) | 8.3 (5.7, 12.3) | 0.960 |
| Wake HR CV | 0.14 (0.10, 0.19) | 0.13 (0.10, 0.18) | 0.334 |
| Sleep HR CV | 0.15 (0.08, 0.17) | 0.11 (0.08, 0.16) | 0.680 |
| Renal outcomes | |||
| ieGFR at entryd | 46.7 (32.5, 67.3) | 45.6 (31.4, 66.9) | 0.573 |
| Annual ieGFR changed | -8.7% (-22.5%, +7.5%) | -8.2% (-19.9%, +5.2%) | 0.753 |
| Urine protein (mg/mg Creatinine) | 0.45 (0.13, 1.54) | 0.45 (0.13, 1.53) | 0.948 |
Geometric means (-1 SD, +1 SD), with the exception of z-scores (in which means are presented).
Univariate p-values are based on t-tests and Fisher exact test (ie, unweighted and unadjusted).
Mean casual BP z-scores calculated by Fourth Report, adjusted for age, sex, and height;
Index variables calculated as mean wake or sleep BP measurements divided by 95th percentile limit;
Abnormal ABP defined as elevated SBP or DBP (ie, > 95th percentile) and abnormally high SBP or DBP loads (ie, > 25%) for either wake or sleep states [25];
ieGFR refers to GFR data based primarily on iohexol measurements, but also estimated GFR when the iohexol measurement was not obtained, as previously described [27].
Table III presents the estimated means and proportions of the same outcomes, with appropriate weighting by the propensity score matching process as well as adjustment for CKD diagnosis. Even though diagnosis was not associated with the exposure (Table I), previous reports from the CKiD Study have described different disease severity and progression of glomerular vs. non-glomerular diagnoses [35].These results present the estimated mean (or probability of having this outcome) of a subject in the 3rd quintile of propensity score (the reference group). The results were consistent with the unadjusted values, with subjects presenting with elevated BP values, a high prevalence of abnormal ABP and low ieGFR at study entry. For casual BP measurements, the differences by birth history status were attenuated compared with the univariate (unweighted and unmatched) results. A similar result was observed for ambulatory BP and HR measurements: there were no significant differences by birth history status for major BP values, BP variation and HR. There were a higher proportion of subjects with abnormal birth history with elevated DBP load (ie, DBP load > 25%) compared with normal subjects (18% vs. 11%) and this effect was borderline significant (p= 0.072). The effect sizes were relatively small, indicating that the lack of significance was not related to sample size. The models also suggested subjects with a glomerular diagnosis were not at higher risk for BP abnormalities than those with a non-glomerular diagnosis, although they were at higher risk for accelerated GFR decline, as previously reported [35].
Table 3.
Adjusted means (95%CI) of BP and GFR outcomes, by abnormal birth history.
| Variable | Normal birth history n= 212 |
Abnormal birth history n= 94 |
P-value |
|---|---|---|---|
| Casual BP | |||
| Casual SBP z-score | 0.24 (-0.06, 0.54) | 0.33 (-0.02, 0.67) | 0.526 |
| Casual DBP z-score | 0.3 (0.03, 0.56) | 0.27 (-0.04, 0.57) | 0.819 |
| Ambulatory BP | |||
| Wake SBP Mean | 116 (113, 119.36) | 116 (113, 120) | 0.917 |
| Sleep SBP Mean | 104 (101, 107) | 104 (101, 107) | 0.742 |
| Wake DBP Mean | 71 (69, 73) | 70 (68, 73) | 0.740 |
| Sleep DBP Mean | 59 (57, 61) | 59 (56, 61) | 0.551 |
| Wake MAP Mean | 86 (84, 88) | 86 (83, 88) | 0.854 |
| Sleep MAP Mean | 75 (73, 78) | 75 (73, 78) | 0.934 |
| Summarized ambulatory BP | |||
| Wake SBP Index | 0.90 (0.88, 0.92) | 0.91 (0.88, 0.93) | 0.447 |
| Sleep SBP Index | 0.92 (0.90, 0.95) | 0.93 (0.9, 0.97) | 0.364 |
| Wake DBP Index | 0.83 (0.81, 0.86) | 0.83 (0.8, 0.86) | 0.908 |
| Sleep DBP Index | 0.9 (0.86, 0.93) | 0.89 (0.85, 0.93) | 0.796 |
| Wake SBP > 95th Limit | 6.1% (2.6%, 13.7%) | 8.4% (3.1%, 20.5%) | 0.402 |
| Sleep SBP > 95th Limit | 9.2% (4.6%, 17.5%) | 11.2% (5%, 23.2%) | 0.513 |
| Wake DBP > 95th Limit | 4.5% (1.7%, 11.5%) | 7% (2.3%, 19.3%) | 0.306 |
| Sleep DBP > 95th Limit | 15.7% (9.1%, 25.6%) | 10.6% (5%, 21.2%) | 0.179 |
| Wake SBP load > 25% | 17.3% (10.6%, 27%) | 21.7% (12.1%, 35.6%) | 0.320 |
| Sleep SBP load > 25% | 17% (10.3%, 26.7%) | 20% (11.1%, 33.3%) | 0.455 |
| Wake DBP load > 25% | 12.5% (7%, 21.3%) | 19.8% (10.4%, 34.3%) | 0.072 |
| Sleep DBP load > 25% | 26% (17.5%, 36.7%) | 23.6% (14%, 36.9%) | 0.630 |
| Abnormal ABPc | 41.1% (30.8%, 52.2%) | 37.6% (25.1%, 52%) | 0.569 |
| Ambulatory BP variability | |||
| Wake SBP SD | 9.75 (9.2, 10.34) | 9.68 (9.06, 10.35) | 0.803 |
| Sleep SBP SD | 8.47 (7.81, 9.19) | 8.47 (7.72, 9.3) | 0.992 |
| Wake SBP CV | 0.08 (0.08, 0.09) | 0.08 (0.08, 0.09) | 0.662 |
| Sleep SBP CV | 0.08 (0.08, 0.09) | 0.08 (0.07, 0.09) | 0.986 |
| Wake DBP SD | 9.48 (8.99, 9.99) | 9.39 (8.84, 9.98) | 0.732 |
| Sleep DBP SD | 7.87 (7.34, 8.43) | 8.13 (7.51, 8.8) | 0.315 |
| Wake DBP CV | 0.13 (0.13, 0.14) | 0.13 (0.12, 0.14) | 0.912 |
| Sleep DBP CV | 0.13 (0.12, 0.14) | 0.14 (0.13, 0.15) | 0.181 |
| Wake MAP SD | 8.68 (8.22, 9.16) | 8.83 (8.3, 9.39) | 0.497 |
| Sleep MAP SD | 7.31 (6.79, 7.86) | 7.25 (6.67, 7.88) | 0.816 |
| Wake MAP CV | 0.1 (0.09, 0.11) | 0.1 (0.1, 0.11) | 0.387 |
| Sleep MAP CV | 0.1 (0.09, 0.1) | 0.1 (0.09, 0.1) | 0.804 |
| SBP % dipping | 9 (7.45, 10.86) | 9.04 (7.28, 11.22) | 0.958 |
| DBP % dipping | 14.61 (12.66, 16.87) | 15.33 (13.01, 18.07) | 0.479 |
| SBP % dipping < 10% | 23.2% (15.3%, 33.6%) | 26.5% (15.9%, 40.7%) | 0.503 |
| DBP % dipping < 10% | 11.3% (6%, 20.3%) | 10.4% (4.6%, 22%) | 0.812 |
| Ambulatory HR variability | |||
| Wake HR SD | 12.11 (11.23, 13.06) | 11.62 (10.67, 12.67) | 0.248 |
| Sleep HR SD | 8.19 (7.46, 9) | 8.78 (7.88, 9.78) | 0.120 |
| Wake HR CV | 0.14 (0.13, 0.15) | 0.13 (0.12, 0.15) | 0.352 |
| Sleep HR CV | 0.11 (0.1, 0.12) | 0.12 (0.11, 0.14) | 0.083 |
| Renal outcomes | |||
| ieGFR at entryd | 45.51 (41.16, 50.33) | 43.11 (38.43, 48.37) | 0.253 |
| Annual ieGFR changed | -8.6% (-12.6%, -4.4%) | -8.3% (-12.9%, -3.5%) | 0.877 |
| Urine protein (mg/mg Creatinine) | 0.35 (0.26, 0.48) | 0.38 (0.27, 0.54) | 0.545 |
Estimated adjusted means are from weighted linear regression in the log scale, based on full constrained matching, with adjustment for quintiles of propensity scores (defined by subjects with abnormal birth history) and CKD diagnosis. Proportions are calculated from logistic regressions with the same adjustment. The reference group is a subject with non-glomerular CKD and with a probability of being abnormal birth between 0.32 and 0.42 (the 40th-60th percentiles of propensity scores).
Casual BP z-scores calculated by 4th report, adjusted for age, sex, and height;
Index variables calculated as mean wake or sleep BP measurements divided by the 95th percentile limit for state-specific mean;
Abnormal ABP defined as elevated SBP or DBP (ie, > 95th percentile) and abnormally high SBP or DBP loads (ie, > 25%) for either wake or sleep states, as previously defined [25];
ieGFR refers to a combination of iohexol and estimated GFR as previously described [27].
We conducted two sensitivity analyses. First, we included proteinuria as a covariate in the weighted regression models. Second, we excluded CKD diagnosis as a covariate from the models. In both sensitivity analyses, the effect of abnormal birth history remained unchanged.
Discussion
Although the concept of perinatal programming as an important influence on the development of adult cardiovascular disease has become widely accepted in the literature, we did not see a significant effect of abnormal birth history on either BP or decline in renal function in the among children with CKD. There are a number of possible explanations for the lack of effect of birth history on BP in the CKiD cohort, including the young age of the subjects, the impact of treatment of hypertension, and, perhaps most importantly, the dominant effect of the underlying CKD on these outcomes.
According to the Barker hypothesis, low birth weight is strongly associated with the development of future cardiovascular disease. Several population-based studies have shown that for each kilogram increase in birth weight, adult systolic BP is 1-2 mmHg lower [20,36]. Other large studies have shown that low birth weight is associated with greater rates of coronary heart disease and the metabolic syndrome in adults [37,38]. The rate of early weight gain has also been shown to be an important predictor of later cardiovascular risk, with those individuals experiencing a more rapid weight gain in early childhood at increased risk [36,39,40]. The duration of time required to see these abnormalities is unclear. Most of the studies supporting the Barker hypothesis have been conducted in adults, and studies that have examined the effect of abnormal birth history on BP levels in pediatric patients have had conflicting results [16], with at least one recent study suggesting that postnatal factors may be more important than prenatal factors [41].
On the other hand, several recent studies have demonstrated that effects of birth weight on BP can be detectable during childhood using ambulatory BP monitoring. Lurbe and co-workers studied 630 healthy children, all of whom had been delivered at full term, by ABPM at a mean age of 9.9 years [42]. Although the strongest predictor of current 24-hr systolic BP was current weight, birth weight had a significant inverse relationship on both 24-hour systolic BP and BP variability – in other words, children with lower birth weight had higher 24-hr systolic BP and higher 24-hr systolic BP variability. Bayrakci et al performed ABPM in 41 children born preterm, 30 of whom were small-for-gestational age, and compared the results with those in a group of children born at term who were also appropriate-for-gestational age [43]. The preterm group had higher nocturnal systolic BP, elevated nocturnal systolic & diastolic BP loads, and blunted nocturnal dipping. The trend toward higher nocturnal systolic BP was most pronounced in the group who were most light-for-date. Additionally, using linear regression, they demonstrated that SGA status was a major predictor of nocturnal & daytime systolic BP SDS.
Despite the availability of complete ABPM data for a relatively large number of well-characterized participants with CKD, we were unable to detect significant effects of abnormal birth history on any BP measure, including variables for which ABPM is uniquely suited such as nocturnal dipping and BP variability. The young age of our cohort could be one potential explanation for the lack of significant differences between the birth history groups, although the fact that Lurbe and Bayrakci [42,43] showed significant BP abnormalities in children of similar age would argue against this. A more likely explanation is that our participants' underlying CKD is playing a more significant role than birth history. We have previously demonstrated, for example, that as in adults with CKD, children with CKD have abnormal BP variability, [44] which is likely related to abnormalities of sympathetic nervous system function that are common in patients with CKD [45]. Additionally, as demonstrated in this analysis, a large number of CKiD subjects (69%) are receiving active treatment for hypertension; despite the fact that not all CKiD subjects achieve control of hypertension [24]. It is likely that treatment of hypertension masks any contribution of abnormal birth history to BP outcomes.
With respect to the effects of birth history on renal function, the Brenner hypothesis argues that low birth weight is associated with a reduction in nephron number, which increases the risk for hypertension and chronic kidney disease [3,7,46]. Low nephron number causes focal segmental glomerulosclerosis (FSGS) in experimental animals and is theorized to cause FSGS in humans [47]. Furthermore, low birth weight is known to be a risk factor for a less favorable prognosis in a variety of chronic kidney diseases [5,6,48-50].
Given this background, we examined whether the high prevalence of abnormal birth history in the CKiD cohort would be associated with effects on renal function. However, no such effect was demonstrated in our analysis for GFR, GFR decline or initial proteinuria levels. We believe that the predominance of non-glomerular forms of CKD in the CKiD cohort is the most plausible explanation for the lack of significant differences in renal function – many of the non-glomerular forms of CKiD are diagnosed at birth or shortly thereafter, making it difficult to discern any separate effect of abnormal birth history. In addition, the CKiD cohort only includes patients with a baseline GFR within a specific range. Hence, it would not enable detection of any effect of birth history prior to enrollment in the cohort, unlike previous studies that compare GFR among patients with the same diagnosis [5,6,48]. Nonetheless, even though the GFR range for study entry was relatively wide (30 to 90 ml/min|1.73m2), children abnormal birth history did not present with substantially lower GFR levels compared with those with normal birth history.
In contrast to abnormal birth history, postnatal factors are likely more important and clinically meaningful mediators of hypertension and renal function in patients with chronic kidney disease. This is particularly important because these potentially modifiable factors allow opportunities for intervention. For example, the CKiD study has demonstrated that proteinuria is associated with increased likelihood of abnormal ambulatory BP [25]: higher levels of proteinuria and increasing proteinuria over time both increased the odds of having an abnormal ambulatory BP study. Additionally, proteinuria is associated with accelerated disease progression in the CKiD cohort [51]. Both of these findings are notable given that effective pharmacological intervention to reduce proteinuria is available. Other modifiable postnatal factors with important effects on GFR include anemia, calcium & phosphorus metabolism, and albumin [35]. Exposure to second-hand smoke in this population is associated with increased proteinuria [52], and lower family income level is a marker for individuals at higher risk of poor BP control and deficits in growth [54]. Effective therapy of modifiable factors and intensive clinical care of higher risk groups could very well have influenced the rate of decline of GFR and severity of hypertension in the CKiD cohort. Thus, the results of the present analysis, which demonstrate that non-modifiable perinatal effects do not significantly influence BP in children with CKD, are consistent with prior studies examining factors that influence CKD progression in children.
A potential limitation of this study is the use of parental recall for birth history information, which might have led to some misclassification of birth history exposures. However, parental recall has been shown to be reasonably accurate for birth weight and other early life events [54.55] and is therefore usually an accepted practice in epidemiological studies. Additionally, we used a broad definition of abnormal birth history which differs from that used in many studies of the effects of birth history on cardiovascular and renal outcomes. This was necessary because of the relatively small number of children in the CKiD cohort for whom complete ambulatory BP data were available. We actually had a larger sample than Bayrakci et al, who were able to demonstrate abnormal circadian BP variation in a small number of children born preterm using ABPM [40]. Thus, we should have been able to detect a difference had it been present. Lastly, although abnormal birth history does not appear to exacerbate the effect of CKD on BP and GFR, it should be noted that abnormal birth history is more common in CKiD than the general population [2]. Even though we are unable to determine the extent to which abnormal birth history places an individual at increased risk for pediatric CKD, our study sought to determine the impact of abnormal birth history on indicators of health in the presence of pediatric CKD.
We previously demonstrated that abnormal birth history is a novel risk factor for short stature and lower weight percentiles in children with mild to moderate CKD [2]. In contrast, this analysis indicates that abnormal birth history does not appear to exert a significant influence on BP and GFR at the time of entry to CKiD, or accelerated GFR decline, compared with subjects with normal birth history. Hence, in the presence of CKD, an abnormal birth history, although associated with a variety of morbidities including short stature, does not appear to have significant impact on BP or GFR decline in children.
Figure 1.
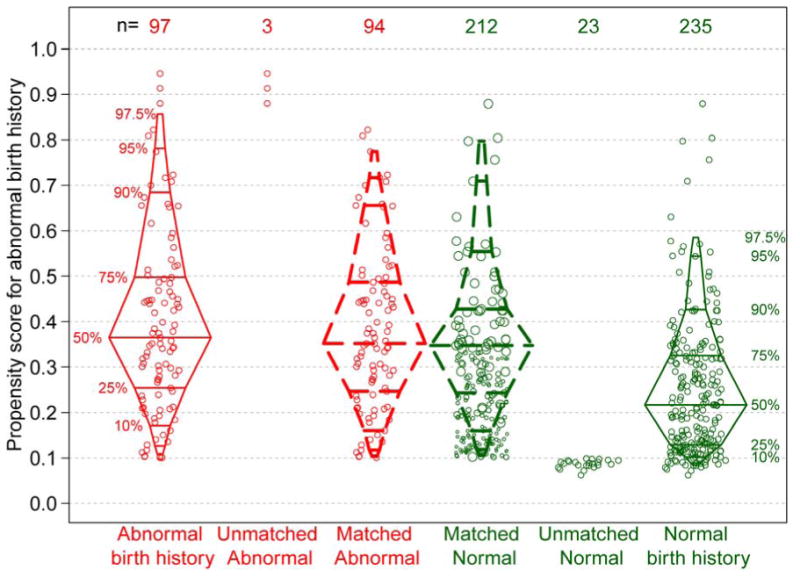
Distribution of propensity scores, by BH status and matched data with weighting, based on full constrained matching. The box plots represent the distribution of propensity scores (predicted probabilities) by BH (abnormal and normal) based on the logistic regression model described in the Methods. The unmatched data points are not included in the final analysis. The matched data points are included in the final analysis. All matched subjects with an abnormal BH have a weight equal to 1, matched subjects with a normal BH are represented by a dot size proportional to the weight based on the matching algorithm. The discontinuous boxplots represent the weighted distributions of propensity scores.
Acknowledgments
Funded by the National Institute of Diabetes and Digestive and Kidney Diseases, the National Institute of Child Health and Human Development, and the National Heart, Lung, and Blood Institute (U01-DK-66143, U01-DK-66174, U01DK-082194, U01-DK-66116).
Abbreviations
- ABP
ambulatory blood pressure
- ABPM
ambulatory blood pressure monitoring
- BP
blood pressure
- BW
birth weight
- CKD
chronic kidney disease
- CKiD
Chronic Kidney Disease in Children
- DBP
diastolic blood pressure
- GFR
glomerular filtration rate
- SBP
systolic blood pressure
Appendix. CKiD Study Investigators
| Sites | Principal Investigator |
|---|---|
| Children's Hospital of Winnipeg | Tom Blydt-Hansen, MD |
| Egleston Children's Hospital, Emory University | Larry Greenbaum, MD, PhD |
| Children's Mercy Hospital, Kansas City | Bradley Warady, MD* |
| Seattle Children's Hospital | Joseph Flynn, MD |
| University of New Mexico Children's Hospital | Craig Wong, MD |
| Cincinnati Children's Hospital and Medical Center | Jens Goebel, MDa, Mark Mitsnefes, MD |
| University of California, Los Angeles | Isidro Salusky, MD; Ora Yadin, MDa |
| Rainbow Babies and Children's Hospital | Katherine Dell, MD |
| Phoenix Children's Hospital | Bruce Morgenstern, MD |
| British Columbia Children's Hospital | Colin White, MD, FRCPC, FAAP |
| Children's Hospital of Alabama | Sahar Fathallah, MD |
| St. Louis Children's Hospital | S. Paul Hmiel, MD |
| Medical College of Wisconsin | Cynthia Pan, MD |
| Oregon Health and Science University | Amira Al-Uzri, MDa; Randall Jenkins, MD |
| UCSF Children's Hospital | Anthony Portale, MD |
| University of Texas Southwestern Medical Center | Mouin Seikaly, MD |
| Oklahoma University Health Sciences Center | Martin Turman, MD, PhD |
| Stanford University Medical Center | Cynthia Wong, MDa; Steven Alexander, MD |
| LeBonheur Children's Medical Centerb | Colleen Hastings, MD |
| Northwest Pediatric Kidney Specialistb | Randall Jenkins, MD |
| Children's Hospital of Boston | Nancy Rodig, MDa; William Harmon, MD |
| University of Wisconsinb | Sharon Bartosh, MD |
| University of California, San Diego | Nadine Benador, MDa; Robert Mak, MD, PhD |
| Cardinal Glennon Hospital | Ellen Wood, MD |
| Children's Kidney Specialists, Idahob | Randall Jenkins, MD |
| Children's Hospital of Los Angelesb | Gary Lerner, MD |
| Vanderbilt University Medical Centerc | Deborah Jones, MD |
| Children's Hospital of Philadelphia | Susan Furth, MD, PhD** |
| University of Michigan, Mott Hospital | Debbie Gipson, MD |
| Texas Children's Hospital, Baylorc | Poyyapakkam Srivaths, MD |
| East Carolina Universityb | Guillermo Hidalgo, MD |
| University of Texas, Houston | Joshua Samuels, MD |
| Children's Hospital at Montefiore | Frederick Kaskel, MD, PhD |
| Carolinas Medical Center | Susan Massengill, MD |
| University of Virginia | Victoria Norwood, MD |
| University of Maryland | Susan Mendley, MD |
| DeVos Children's Hospital at Spectrum | Yi Cai, MD |
| Riley Hospital for Children at Indiana Univ. Health | Sharon Andreoli, MD, PhD |
| Johns Hopkins Children's Center | Meredith Atkinson, MD |
| University of Rochester Medical Center, Golisano Children's Hospital at Strong | Marc Lande, MDa, George Schwartz, MD |
| Mount Sinai Medical Center | Jeffrey Saland, MD |
| University of Iowa | Patrick Brophy, MD |
| Hospital for Sick Children (Sick Kids) | Rulan Parekh, MDa; Lisa Robinson, MD |
| University of Florida | Richard Neiberger, MD |
| Nationwide Children's Hospital, Ohio State Univ. | Hiren Patel, MD |
| University of North Carolina, Chapel Hill | Maria Ferris, MD |
| Children's Hospital of Michigan | Tej Matoo, MD |
| Maimonides Medical Center | Juan Kupferman, MD |
| Robert Wood Johnson Medical School – UMDNJ | Lynne Weiss, MD |
| Ann & Robert H. Lurie Children's Hospital of Chicago | Craig Langman, MD |
| University of Illinois, Chicago | Eunice John, MD |
| INOVA Fairfax Hospital for Children | Patricia Seo-Mayer, MD |
| Children's National Medical Center | Kanwal Kher, MD |
| Maria Fareri Children's Hospital at Westchester | Dmitry Samsonov, MD |
| SUNY Downstate Medical Centerc | Anil Mongia, MD |
| Children's Hospital of Richmond at Virginia | Randala Lakkis, MD |
| Commonwealth Universityb |
Clinical Site Principal Investigator
New participating site
No longer participating site that enrolled children in the study
Midwest Clinical Coordinating Center, Principal Investigator
East Coast Clinical Coordinating Center, Principal Investigator
Footnotes
The authors declare no conflicts of interest.
Publisher's Disclaimer: This is a PDF file of an unedited manuscript that has been accepted for publication. As a service to our customers we are providing this early version of the manuscript. The manuscript will undergo copyediting, typesetting, and review of the resulting proof before it is published in its final citable form. Please note that during the production process errors may be discovered which could affect the content, and all legal disclaimers that apply to the journal pertain.
References
- 1.White SL, Perkovic V, Cass A, Chang CL, Poulter NR, Spector T, et al. Is low birth weight an antecedent of CKD in later life? A systematic review of observational studies. Am J Kidney Dis. 2009;54:248–261. doi: 10.1053/j.ajkd.2008.12.042. [DOI] [PubMed] [Google Scholar]
- 2.Greenbaum LA, Munoz A, Schneider MF, Kaskel FJ, Askenazi DJ, Jenkins R, et al. The association between abnormal birth history and growth in children with CKD. Clin J Am Soc Nephrol. 2011 Jan;6:14–21. doi: 10.2215/CJN.08481109. [DOI] [PMC free article] [PubMed] [Google Scholar]
- 3.Luyckx VA, Brenner BM. Low birth weight, nephron number, and kidney disease. Kidney Int Suppl. 2005;97:S68–S77. doi: 10.1111/j.1523-1755.2005.09712.x. [DOI] [PubMed] [Google Scholar]
- 4.Lackland DT, Barker DJ. Birth weight: a predictive medicine consideration for the disparities in CKD. Am J Kidney Dis. 2009;54:191–193. doi: 10.1053/j.ajkd.2009.04.012. [DOI] [PubMed] [Google Scholar]
- 5.Rajan T, Barbour SJ, White CT, Levin A. Low birth weight and nephron mass and their role in the progression of chronic kidney disease: a case report on identical twins with Alport disease. Nephrol Dial Transplant. 2011;26:4136–4139. doi: 10.1093/ndt/gfr252. [DOI] [PubMed] [Google Scholar]
- 6.Orskov B, Christensen KB, Feldt-Rasmussen B, Strandgaard S. Low birth weight is associated with earlier onset of end-stage renal disease in Danish patients with autosomal dominant polycystic kidney disease. Kid Int. 2012;81:919–924. doi: 10.1038/ki.2011.459. [DOI] [PubMed] [Google Scholar]
- 7.Keller G, Zimmer G, Mall G, Ritz E, Amann K. Nephron number in patients with primary hypertension. N Engl J Med. 2003;348:101–108. doi: 10.1056/NEJMoa020549. [DOI] [PubMed] [Google Scholar]
- 8.Barker DJ. The fetal and infant origins of adult disease. BMJ. 1990;301(6761):1111. doi: 10.1136/bmj.301.6761.1111. [DOI] [PMC free article] [PubMed] [Google Scholar]
- 9.Rich-Edwards JW, Stampfer MJ, Manson JE, Rosner B, Hankinson SE, Colditz GA, et al. Birth weight and risk of cardiovascular disease in a cohort of women followed up since 1976. BMJ. 1997;315(7105):396–400. doi: 10.1136/bmj.315.7105.396. [DOI] [PMC free article] [PubMed] [Google Scholar]
- 10.Gamborg M, Byberg L, Rasmussen F, Andersen PK, Baker JL, Bengtsson C, et al. Birth weight and systolic blood pressure in adolescence and adulthood: meta-regression analysis of sex- and age-specific results from 20 Nordic studies. Am J Epidemiol. 2007;166:634–45. doi: 10.1093/aje/kwm042. [DOI] [PubMed] [Google Scholar]
- 11.Järvelin MR, Sovio U, King V, Lauren L, Xu B, McCarthy MI, et al. Early life factors and blood pressure at age 31 years in the 1966 northern Finland birth cohort. Hypertension. 2004;44:838–846. doi: 10.1161/01.HYP.0000148304.33869.ee. [DOI] [PubMed] [Google Scholar]
- 12.Law CM, Shiell AW. Is blood pressure inversely related to birth weight? The strength of evidence from a systematic review of the literature. J Hypertens. 1996;14:935–941. [PubMed] [Google Scholar]
- 13.Owen CG, Whincup PH, Cook DG. Are early life factors responsible for international differences in adult blood pressure? An ecological study. IntJ Epidemiol. 2005;34:649–654. doi: 10.1093/ije/dyi046. [DOI] [PubMed] [Google Scholar]
- 14.Chen W, Srinivasan SR, Yao L, Li S, Dasmahapatra P, Fernandez C, et al. Low birth weight is associated with higher blood pressure variability from childhood to young adulthood: the Bogalusa Heart Study. Am J Epidemiol. 2012;176(Suppl 7):S99–105. doi: 10.1093/aje/kws298. [DOI] [PMC free article] [PubMed] [Google Scholar]
- 15.Chiolero A, Paradis G, Madeleine G, Hanley JA, Paccaud F, Bovet P. Birth weight, weight change, and blood pressure during childhood and adolescence: a school-based multiple cohort study. J Hypertens. 2011;29:1871–9. doi: 10.1097/HJH.0b013e32834ae396. [DOI] [PubMed] [Google Scholar]
- 16.Edvardsson VO, Steinthorsdottir SD, Eliasdottir SB, Indridason OS, Palsson R. Birth weight and childhood blood pressure. Curr Hypertens Rep. 2012;14:596–602. doi: 10.1007/s11906-012-0311-6. [DOI] [PubMed] [Google Scholar]
- 17.Moore VM, Cockington RA, Ryan P, Robinson JS. The relationship between birth weight and blood pressure amplifies from childhood to adulthood. J Hypertens. 1999;17:883–888. doi: 10.1097/00004872-199917070-00003. [DOI] [PubMed] [Google Scholar]
- 18.Strufaldi MW, Silva EM, Franco MC, Puccini RF. Blood pressure levels in childhood: probing the relative importance of birth weight and current size. Eur J Pediatr. 2009;168:619–624. doi: 10.1007/s00431-008-0813-z. [DOI] [PubMed] [Google Scholar]
- 19.Primatesta P, Falaschetti E, Poulter NR. Birth weight and blood pressure in childhood: results from the Health Survey for England. Hypertension. 2005;45:75–79. doi: 10.1161/01.HYP.0000150037.98835.10. [DOI] [PubMed] [Google Scholar]
- 20.Mzayek F, Hassig S, Sherwin R, Hughes J, Chen W, Srinivasan S, et al. The association of birth weight with developmental trends in blood pressure from childhood through mid-adulthood: the Bogalusa Heart study. Am J Epidemiol. 2007;166:413–420. doi: 10.1093/aje/kwm098. [DOI] [PubMed] [Google Scholar]
- 21.O'Sullivan J, Wright C, Pearce MS, Parker L. The influence of age and gender on the relationship between birth weight and blood pressure in childhood: a study using 24-hour and casual blood pressure. Eur J Pediatr. 2002;161:423–427. doi: 10.1007/s00431-002-0985-x. [DOI] [PubMed] [Google Scholar]
- 22.Furth SL, Cole SR, Moxey-Mims M, Kaskel F, Mak R, Schwartz G, et al. Design and methods of the chronic kidney disease in children (CKiD) prospective cohort study. Clin J Am Soc Nephrol. 2006;1:1006–1015. doi: 10.2215/CJN.01941205. [DOI] [PMC free article] [PubMed] [Google Scholar]
- 23.Schwartz GJ, Munoz A, Schneider MF, Kaskel F, Warady BA, Furth SL. New equations to estimate GFR in children with CKD. J Am Soc Nephrol. 2009;20:629–637. doi: 10.1681/ASN.2008030287. [DOI] [PMC free article] [PubMed] [Google Scholar]
- 24.Flynn JT, Mitsnefes M, Pierce C, Cole SR, Parekh RS, Furth SL, et al. Blood pressure in children with chronic kidney disease: A report from the chronic kidney disease in children study. Hypertension. 2008;52:631–637. doi: 10.1161/HYPERTENSIONAHA.108.110635. [DOI] [PMC free article] [PubMed] [Google Scholar]
- 25.Samuels J, Ng D, Flynn JT, Mitsnefes M, Poffenbarger T, Warady BA, et al. Ambulatory Blood Pressure Patterns in Children with Chronic Kidney Disease. Hypertension. 2012;60:43–50. doi: 10.1161/HYPERTENSIONAHA.111.189266. [DOI] [PMC free article] [PubMed] [Google Scholar]
- 26.National High Blood Pressure Education Program Working Group on High Blood Pressure in Children and Adolescents. The fourth report on the Diagnosis, Evaluation, and Treatment of High Blood Pressure in Children and Adolescents. Pediatrics. 2004;114:555–576. [PubMed] [Google Scholar]
- 27.Pierce CB, Cox C, Saland JM, Furth SL, Muñoz A. Methods for characterizing differences in longitudinal gfr changes between children with glomerular and non-glomerular chronic kidney disease. Am J Epidemiol. 2011;174:604–612. doi: 10.1093/aje/kwr121. [DOI] [PMC free article] [PubMed] [Google Scholar]
- 28.Schwartz GJ, Schneider MF, Maier PS, et al. Improved equations estimating GFR in children with chronic kidney disease using an immunonephelometric determination of cystatin C. Kidney Int. 2012;82:445–453. doi: 10.1038/ki.2012.169. [DOI] [PMC free article] [PubMed] [Google Scholar]
- 29.Rubin DB. On principles for modeling propensity scores in medical research. Pharmacoepidemiol Drug Saf. 2004;13:855–857. doi: 10.1002/pds.968. [DOI] [PubMed] [Google Scholar]
- 30.Stuart EA. Matching methods for causal inference: A review and a look forward. Stat Sci. 2010;25:1–21. doi: 10.1214/09-STS313. [DOI] [PMC free article] [PubMed] [Google Scholar]
- 31.Rosenbaum PR, Rubin DB. Reducing bias in observational studies using subclassification on the propensity score. J Am Stat Assoc. 1984;79:516–524. [Google Scholar]
- 32.Stuart EA, Green KM. Using full matching to estimate causal effects in nonexperimental studies: examining the relationship between adolescent marijuana use and adult outcomes. Dev Psychol. 2008;44:395–406. doi: 10.1037/0012-1649.44.2.395. [DOI] [PMC free article] [PubMed] [Google Scholar]
- 33.Ho D, Imai K, King G, Stuart E. Matching as Nonparametric Preprocessing for Reducing Model Dependence in Parametric Causal Inference. Polit Anal. 2007;15:199–236. [Google Scholar]
- 34.Ho D, Imai K, King G, Stuart E. Matchit: Nonparametric Preprocessing for Parametric Causal Inference. J Stat Softw. 2011;42:1–28. [Google Scholar]
- 35.Staples AO, Greenbaum LA, Smith JM, Gipson DS, Filler G, et al. Association between clinical risk factors and progression of chronic kidney disease in children. Clin J Am Soc Nephrol. 2010;5:2172–9. doi: 10.2215/CJN.07851109. [DOI] [PMC free article] [PubMed] [Google Scholar]
- 36.Law CM, Shiell AW, Newsome CA, Syddall HE, Shinebourne EA, Fayers PM, et al. Fetal, infant, and childhood growth and adult blood pressure: a longitudinal study from birth to 22 years of age. Circulation. 2002;105:1088–1092. doi: 10.1161/hc0902.104677. [DOI] [PubMed] [Google Scholar]
- 37.Ramadhani MK, Grobbee DE, Bots ML, Castro Cabezas M, Vos LE, Oren A, et al. Lower birth weight predicts metabolic syndrome in young adults: the Atherosclerosis Risk in Young Adults (ARYA)-study. Atherosclerosis. 2006;184:21–27. doi: 10.1016/j.atherosclerosis.2005.03.022. [DOI] [PubMed] [Google Scholar]
- 38.Lawlor DA, Ronalds G, Clark H, Smith GD, Leon DA. Birth weight is inversely associated with incident coronary heart disease and stroke among individuals born in the 1950s: findings from the Aberdeen Children of the 1950s prospective cohort study. Circulation. 2005;112:1414–1418. doi: 10.1161/CIRCULATIONAHA.104.528356. [DOI] [PubMed] [Google Scholar]
- 39.Min JW, Kong KA, Park BH, Hong JH, Park EA, Cho SJ, et al. Effect of postnatal catch-up growth on blood pressure in children at 3 years of age. J Hum Hypertens. 2007;21:868–874. doi: 10.1038/sj.jhh.1002215. [DOI] [PubMed] [Google Scholar]
- 40.Falkner B, Hulman S, Kushner H. Birth weight versus childhood growth as determinants of adult blood pressure. Hypertension. 1998;31:145–50. doi: 10.1161/01.hyp.31.1.145. [DOI] [PubMed] [Google Scholar]
- 41.Filler G, Yasin A, Kesarwani P, Garg AX, Lindsay R, Sharma AP. Big mother or small baby: which predicts hypertension? J Clin Hypertens (Greenwich) 2011;13:35–41. doi: 10.1111/j.1751-7176.2010.00366.x. [DOI] [PMC free article] [PubMed] [Google Scholar]
- 42.Lurbe E, Torro I, Rodriguez C, Alvarez V, Redon J. Birth weight influences blood pressure values and variability in children and adolescents. Hypertension. 2001;38:389–393. doi: 10.1161/01.hyp.38.3.389. [DOI] [PubMed] [Google Scholar]
- 43.Bayrakci US, Schaefer F, Duzova A, Yigit S, Bakkaloglu A. Abnormal circadian blood pressure regulation in children born preterm. J Pediatr. 2007;151:399–403. doi: 10.1016/j.jpeds.2007.04.003. [DOI] [PubMed] [Google Scholar]
- 44.Barletta GM, Flynn J, Mitsnefes M, Samuels J, Friedman L, Ng D, Poffenbarger T, Cox C, Warady B, Furth S. Heart rate and blood pressure variability in children with chronic kidney disease: a report from the CKID study. Pediatr Nephrol. 2014 doi: 10.1007/s00467-013-2737-8. in press. [DOI] [PMC free article] [PubMed] [Google Scholar]
- 45.Joles JA, Koomans HA. Causes and Consequences of Increased Sympathetic Activity in Renal Disease. Hypertension. 2004;43:699–706. doi: 10.1161/01.HYP.0000121881.77212.b1. [DOI] [PubMed] [Google Scholar]
- 46.Amann K, Plank C, Dötsch J. Low nephron number--a new cardiovascular risk factor in children? Pediatr Nephrol. 2004;19:1319–23. doi: 10.1007/s00467-004-1643-5. [DOI] [PubMed] [Google Scholar]
- 47.Rodriguez MM, Gomez A, Abitbol C, Chandar J, Montané B, Zilleruelo G. Comparative renal histomorphometry: a case study of oligonephropathy of prematurity. Pediatr Nephrol. 2005;20:945–949. doi: 10.1007/s00467-004-1800-x. [DOI] [PubMed] [Google Scholar]
- 48.Rossing P, Tarnow L, Nielsen FS, Hansen BV, Brenner BM, Parving HH. Low birth weight. A risk factor for development of diabetic nephropathy? Diabetes. 1995;44:1405–1407. doi: 10.2337/diab.44.12.1405. [DOI] [PubMed] [Google Scholar]
- 49.Nelson RG, Morgenstern H, Bennett PH. Birth weight and renal disease in Pima Indians with type 2 diabetes mellitus. Am J Epidemiol. 1998;148:650–656. doi: 10.1093/aje/148.7.650. [DOI] [PubMed] [Google Scholar]
- 50.Sheu JN, Chen JH. Minimal change nephrotic syndrome in children with intrauterine growth retardation. Am J Kid Dis. 2001;37(5):909–14. doi: 10.1016/s0272-6386(05)80005-8. [DOI] [PubMed] [Google Scholar]
- 51.Wong CS, Pierce CB, Cole SR, et al. Association of proteinuria with race, cause of chronic kidney disease, and glomerular filtration rate in the Chronic Kidney Disease in Children Study. Clin J Am Soc Nephrol. 2009;4:812–819. doi: 10.2215/CJN.01780408. [DOI] [PMC free article] [PubMed] [Google Scholar]
- 52.Omoloja A, Jerry-Fluker J, Ng DK, Abraham AG, Furth S, Warady BA, Mitsnefes M. Secondhand smoke exposure is associated with proteinuria in children with chronic kidney disease. Pediatr Nephrol. 2013;28:1243–1251. doi: 10.1007/s00467-013-2456-1. [DOI] [PMC free article] [PubMed] [Google Scholar]
- 53.Hidalgo G, Ng DK, Moxey-Mims M, Minnick ML, Blydt-Hansen T, Warady BA, Furth SL. Association of Income Level With Kidney Disease Severity and Progression Among Children and Adolescents With CKD: A Report From the Chronic Kidney Disease in Children (CKiD) Study. Am J Kidney Dis. 2013;62:1087–1094. doi: 10.1053/j.ajkd.2013.06.013. [DOI] [PMC free article] [PubMed] [Google Scholar]
- 54.Pless CE, Pless IB. How well they remember. The accuracy of parent reports. Arch Pediatr Adolesc Med. 1995;149:553–558. doi: 10.1001/archpedi.1995.02170180083016. [DOI] [PubMed] [Google Scholar]
- 55.O'Sullivan JJ, Pearce MS, Parker L. Parental recall of birth weight: how accurate is it? Arch Dis Child. 2000;82:202–203. doi: 10.1136/adc.82.3.202. [DOI] [PMC free article] [PubMed] [Google Scholar]