

Abstract
Background: In 2008, the Food and Drug Administration (FDA) accepted our type 1 diabetes mellitus (T1DM) simulator (S2008), equipped with 100 in silico adults, 100 adolescents, and 100 children, as a substitute for preclinical trials for certain insulin treatments, including closed-loop algorithms. Hypoglycemia was well described in the simulator, but recent closed-loop trials showed a much larger frequency of hypoglycemia events in patients compared with the in silico ones. In order to better describe the distribution of glucose concentration observed in clinical trials, the simulator has recently been updated, and modifications have been accepted by the FDA (S2013). The aim of this study is to assess the validity of the S2013 simulator against clinical data and compare its performance with that of the S2008.
Subjects and Methods: The database consists of 24 T1DM subjects who received dinner (70.7±3.3 g of carbohydrate) and breakfast (52.9±0.1 g of carbohydrate) in two occasions (open- and closed-loop), for a total of 96 postmeal glucose profiles. Measured plasma glucose profiles were compared with those simulated in 100 in silico adults, and the continuous glucose error grid analysis (CG-EGA) was used to assess the validity of the simulated traces. Moreover, the most common outcome metrics have been compared.
Results: The frequency of hypoglycemia episodes predicted by the S2013 well reproduces that observed during clinical trials as proven by the CG-EGA. In addition, the outcome metrics provided by the S2013 are similar to those observed in clinical trials in a set of T1DM subjects.
Conclusions: We demonstrated that the virtual subjects of the S2013 are representative of the T1DM population observed in a clinical trial. We conclude that the S2013 is a valid tool usable to test the robustness of closed-loop control algorithms for artificial pancreas.
Introduction
The conventional therapy of type 1 diabetes mellitus (T1DM) management consists in a strict daily schedule of subcutaneous insulin injections (multi-injective therapy) or in the use of continuous subcutaneous insulin infusion systems. In both cases, the optimization of insulin therapy for a specific subject is not trivial because large external disturbances, like meals, physical activity, stress, etc., affect the optimal glycemic control. In addition, intra- and interday variability of glucose metabolism further complicates diabetes management. The use of closed-loop systems, also known as the artificial pancreas, may potentially solve these problems, resulting in a better glycemic control.
Although simulation is not a substitute for human trials, it is a widely accepted belief that the development of the artificial pancreas can be accelerated by computer simulation. In particular, the availability of a T1DM simulator can be very useful for the design and evaluation of insulin infusion algorithms.
In 2008, we introduced a T1DM simulator1 (S2008). This simulator, equipped with 100 in silico adults, 100 adolescents, and 100 children, was accepted by the Food and Drug Administration (FDA) as a substitute for preclinical trials for certain insulin treatments, including closed-loop algorithms. The simulator was successfully validated against data of different experiments performed in T1DM subjects, reproducing (1) distribution of insulin correction factors in the T1DM population of children and adults, (2) glucose traces in children with T1DM, and (3) glucose traces of induced moderate hypoglycemia observed in adults in clinical trials at the University of Virginia.1 S2008 was also used in several simulation studies and allowed rapid approval by the FDA of closed-loop clinical trials by several groups. Recently, an updated version of the T1DM simulator (S2013), incorporating a model of counterregulation and a new description of glucose dynamics in hypoglycemia, has been developed.2
Here our aim is to assess the validity of S2013 versus S2008 compared with T1DM data obtained in a clinical trial. To be considered a valid tool to test a controller performance, it is not necessary that the simulator contains a perfect clone of all possible subjects, but it is sufficient that (1) for each T1DM subject, a virtual subject exists, who, if undergoing the same experimental scenario (i.e., same meals and insulin infusion/boluses), behaves similarly from a clinical point of view (i.e., it shows a similar pattern and lies in the same clinically relevant zones [hypo-, eu-, and hyperglycemia]) and (2) the distributions of the most important outcome metrics in the simulated traces reproduce those observed experimentally. In fact, the simulator is not designed to do prospective studies on a given individual (i.e., finding an in silico clone of the subject on which the control algorithm is tuned). This would require the use of sophisticated identification techniques, but, more importantly, it would entail a modest intra- and interday variability of patient behavior. Unfortunately, such a characteristic was proven to not occur in real life.3
In this study we will show that the S2008 performs well in euglycemia and hyperglycemic zones, but that it occasionally fails in describing hypoglycemic events. Conversely, the modification of glucose dynamics in hypoglycemia and the incorporation of a counterregulation model significantly improve the performance of the S2013.
Subjects and Methods
S2008
In 2008 we developed a T1DM simulator that has been accepted by the FDA as a substitute for preclinical animal trials for certain insulin treatments.1 The simulator consists of a model of glucose–insulin dynamics during a meal and a population of 300 virtual patients. The model is schematically shown in Figure 1A.
FIG. 1.

(A) The S2008 type 1 diabetes mellitus simulator. (B) The S2013 type 1 diabetes mellitus simulator, including the nonlinear response to hypoglycemia and the glucagon counterregulation model.
The S2008 is equipped with 100 virtual adults, 100 adolescents, and 100 children. These populations of T1DM virtual subjects have been generated by randomly extracting different realizations of the parameter vector from appropriate joint parameter distributions. In other words, each virtual subject in the simulator is represented by a vector containing subject-specific model parameters. These are not independent one from each other, and the relationship among them is defined by the joint parameter distributions. The virtual subjects well span the variability of the T1DM population observed in vivo. However, the frequency of hypoglycemia episodes predicted by the simulator was not completely reflecting that observed during clinical trials (see Results).
S2013
The S20132 has three new features:
1. Results in T1DM subjects suggest that, when glucose falls below a given threshold, insulin sensitivity increases, resulting in an enhanced glucose utilization, which further reduces the plasma glucose level.4–6 In order to describe this phenomenon, in the S2013 the model of glucose kinetics in hypoglycemia has been modified by allowing insulin-dependent utilization to increase, when glucose decreases below a certain threshold, according to the Low Blood Glucose (BG) Risk Index.6,7 This modification makes the virtual subjects more sensitive to insulin when glucose falls below the basal level (see Results) and leaves the behavior unchanged when glucose is above the basal level.
2. A model of glucagon kinetics, secretion, and action has been included into the model2 (Fig. 1B), in order to account for counterregulation. In particular, glucagon is secreted when the plasma glucose level decreases below a given threshold, whereas the plasma glucagon concentration stimulates, with some delay, endogenous glucose production.6
3. A refined statistical strategy for virtual subject generation has been adopted, and new rules for determining the insulin-to-carbohydrates ratio (CR) and correction factor of the virtual subjects have been implemented to better comply with clinical definitions.2
Model assessment
The S2013 has been assessed against T1DM clinical data. In particular, virtual patients were exposed to the same scenario (i.e., same carbohydrate amount, given at the same time, and same insulin boluses and basal pattern) for each subject. Performance of the S2013 is also compared with that of the S2008.
Database
The database used for model assessment consists of 24 T1DM adult subjects,8 recruited at the Universities of Virginia, Charlottesville (n=11), Padova, Italy (n=7), and Montpellier, France (n=6). Each patient had two 22-h hospital admissions (from 3 p.m. to 1 p.m. on the following day), one in open- and one in closed-loop, respectively. During the open-loop session, the subject-specific basal-bolus therapy was used. The control algorithm used during the closed-loop session was the model predictive control algorithm described by Kovatchev et al.,8 which used premeal insulin bolus. However, because we administered to the virtual subject the same insulin schedule as the one used by the real subject, the results are in principle independent from the algorithm used in the trial.
In both admissions subjects received dinner (70.7±3.3 g of carbohydrate) between 6 and 7 p.m. and breakfast (52.9±0.1 g of carbohydrate) between 7 and 8 a.m., and their plasma glucose level was frequently measured. Meals did not vary within-subject among subjects in the two admissions. A physical activity session was not included in the protocol.
Each glucose trace was subdivided into postdinner (from dinner ingestion to 7 h later), overnight (from 5 h after dinner to the beginning of breakfast), and postbreakfast (from breakfast ingestion to 5 h later) portions. In total, 96 postmeal traces have been used. In addition, the analysis takes into account eight overnight portions, showing at least one hypoglycemic episode occurred. This database was not used for the update of S2013.
Assessment
The simulator assessment was conducted on the basis of the following criteria:
1. For each real T1DM subject, a virtual subject exists who, if undergoing the same experimental scenario (i.e., same carbohydrate amount, insulin boluses, and basal pattern, given at the same time), behaves similarly from a clinical point of view (i.e., it shows a similar pattern and lies in the same clinically relevant zones [hypo-, eu-, and hyperglycemia]).
2. The distribution of the most important outcome metrics in the simulated traces reproduces those observed experimentally.
To test the first requirement, for each trace of the database, the measured plasma glucose profile has been compared with those simulated in the 100 in silico adults, who underwent the same experimental scenario (meals, basal insulin, and boluses). In particular, each virtual subject has been related to a performance index (FIT) defined as follows:
 |
where BGmeas is the measured and BGsim is the simulated BG concentration, BGmean is the average measured glucose, and N is the number of samples. Among the 100 simulated profiles, the one providing the best FIT has been selected and compared with the real glucose profile by using the continuous glucose error grid analysis (CG-EGA).9 This method was originally developed for the clinical evaluation of continuous glucose monitoring (CGM) systems in terms of both accurate BG readings and accurate direction and rate of BG fluctuations. In brief, CG-EGA compares the CGM profile with the reference BG and provides a point-error grid analysis,10 combined with a rate-error grid analysis, and an error matrix. The point-error grid analysis and rate-error grid analysis plot CGM versus BG and CGM rate of change versus BG rate of change, respectively, on a plane divided into specific zones, which takes into account the dangerousness of erroneous readings in relation to the actual glucose level.9,11 The error matrix summarizes the results of the analysis, reporting the percentage of accurate readings, benign errors, and erroneous readings of the point-error grid analysis and rate-error grid analysis. Here we use this tool to compare simulated with real glucose profiles.
To test the second requirement, the distribution of mean BG, intrasubject interquartile range, and Low and High BG Indexes,11,12 obtained in clinical and simulated experiments, have been compared. Moreover, we also evaluated the percentage of BG values below 70 mg/dL (hypoglycemia) and over 180 mg/dL (hyperglycemia), the percentage of time in which BG < 70 mg/dL (hypoglycemia) and BG > 180 mg/dL (hyperglycemia), the area between 70 mg/dL and the BG curve when BG < 70 mg/dL (hypoglycemia), the area between BG and the BG curve when BG > 180 mg/dL (hyperglycemia), and the number of hypoglycemic and hyperglycemic events.
Statistical analysis
Data are presented as mean±SD or median (interquartile range) values for normally and non-normally distributed variables, respectively. Two sample comparisons were done using the paired t test, for normally distributed variables, and the Wilcoxon signed rank test, for non-normally distributed variables, both with the significance level set at P=0.05.
Results
Clinical versus simulated profiles
Figure 2 shows the comparison between plasma glucose data measured in one T1DM subject and simulated profiles obtained with the S2013 (left panel) and S2008 (right panel) in two illustrative cases. The S2013 well reproduces the glucose patterns observed in clinical trials in all clinical zones, in particular the rapid falls in glucose level and the hypoglycemic episodes. The simulated profiles obtained with the S2008 reproduce quite well the data in euglycemia and hyperglycemia but not the hypoglycemic episodes.
FIG. 2.
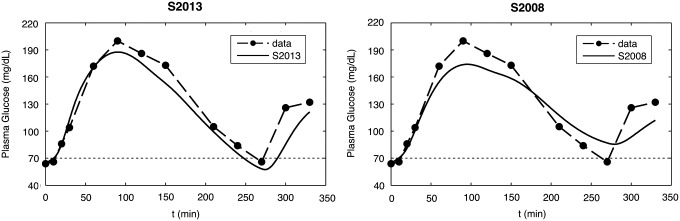
Data versus simulations in one representative subject: (left panel) S2013 versus (right panel) S2008.
CG-EGA
The average results of CG-EGA of the S2013 (Table 1, first row) are very good in hypo-, eu-, and hyperglycemia (percentage in accurate+benign zones: 86.4% in hypoglycemia, 99.9% in euglycemia and 99.2% in hyperglycemia). The results of the S2008 (Table 1, second row) show that the performance is similar to that of S2013 in euglycemia and hyperglycemia (percentage in accurate+benign zones: 99.8% in euglycemia and 99.5% in hyperglycemia) but worse in hypoglycemia (percentage in accurate+benign zones: 40.7%).
Table 1.
Continuous Glucose Error Grid Analysis: S2013 Versus S2008
| Hypoglycemia | Euglycemia | Hyperglycemia | |||||||
|---|---|---|---|---|---|---|---|---|---|
| Accurate | Benign | Bad | Accurate | Benign | Bad | Accurate | Benign | Bad | |
| S2013 | 85.9% | 0.5% | 13.5% | 98.8% | 1.1% | 0.1% | 99.2% | 0.0% | 0.8% |
| S2008 | 40.7% | 0.0% | 59.3% | 98.3% | 1.5% | 0.2% | 99.5% | 0.0% | 0.5% |
Average results of continuous glucose error grid analysis on measurements and simulations obtained with the two simulators.
Distribution of outcome metrics
The improvement presented above is confirmed by the analysis of the distribution of outcome metrics, reported in Table 2. The outcome metrics of S2013 simulations (Table 2, second column) are substantially similar to those obtained from the data, except for the percentage of time in hypoglycemia and the area under the BG curve for hypoglycemia. For the S2008 (Table 2, third column), most of the outcome metrics are significantly lower in simulation (P<0.05).
Table 2.
Outcome Metrics
| Simulator | |||
|---|---|---|---|
| Data | S2013 | S2008 | |
| Blood glucose (mg/dL) | |||
| Mean | 156.9±41.3 | 157.3±43.3 (NS) | 155.9±42.4 (NS) |
| IQR | 71.2 [50.9–96.1] | 66.0 [47.8–89.2] (NS) | 57.3 [33.1–82.5] (<0.001) |
| LBGI | 0.59 [0.02–2.22] | 0.36 [0.00–3.00] (NS) | 0.23 [0.00–1.20] (<0.001) |
| HBGI | 4.85 [1.79–8.34] | 4.63 [1.60–8.24] (NS) | 4.23 [1.19–7.86] (<0.001) |
| Percentage of values in | |||
| Hypoglycemia | 6.47±10.19 | 7.98±13.21 (NS) | 3.59±9.04 (0.001) |
| Hyperglycemia | 28.78±24.75 | 27.64±24.93 (NS) | 27.49±26.98 (NS) |
| Percentage of time in | |||
| Hypoglycemia | 4.04±7.93 | 6.22±11.81 (0.006) | 2.52±7.99 (0.020) |
| Hyperglycemia | 33.90±29.02 | 33.44±30.99 (NS) | 32.71±32.28 (NS) |
| Area under the curve (mg·h/dL) | |||
| Hypoglycemia | 2.65±8.99 | 5.00±14.50 (0.019) | 1.05±3.97 (0.023) |
| Hyperglycemia | 83.23±111.15 | 80.82±112.44 (NS) | 70.96±110.43 (<0.001) |
| Number of events | |||
| Hypoglycemia | 37 | 32 | 19 |
| Hyperglycemia | 72 | 67 | 61 |
For the comparison between data and simulations, data are mean±SD values for normally distributed variables (P value from the paired t test) or median [interquartile range (IQR)] for non-normally distributed variables (P value from the Wilcoxon signed rank test). Low Blood Glucose Index (LBGI) and High Blood Glucose Index (HBGI) are dimensionless.
NS, not significant (P>0.05).
Discussion
The ability to simulate T1DM can be very useful, particularly to test in silico the efficacy of closed-loop insulin infusion algorithms before going to more expensive and time-consuming in vivo trials. Recently, we proposed a new version of our T1DM simulator (S2013) that replaces the previous one (S2008), which was accepted by the FDA as a substitute of preclinical trials for certain insulin treatments, including closed-loop control insulin infusion algorithms. The updates concern the incorporation of counterregulation and a new description of glucose dynamics in hypoglycemia. In fact, in a previous study, it has been proved that, when the glucose level falls below a given threshold (i.e., during hypoglycemia), insulin sensitivity increases, producing an increase of glucose utilization and a consequent further reduction of plasma glucose level. In order to describe this phenomenon, the model of glucose kinetics in hypoglycemia has been properly updated by modulating the insulin-dependent utilization according to the Low BG Risk Index,6,7 so that the virtual subjects become more sensitive to insulin when the glucose level falls below the basal level. Moreover, a model of glucagon kinetics, secretion, and action has been included, allowing consideration of the effect of counterregulation. The virtual population has also been generated by adopting a refined statistical strategy for patient generation, and new rules for determining CR and correction factor of the virtual patients have been implemented to better comply with clinical definitions.2
Here we have assessed the validity of the S2013 on T1DM clinical data, and then, to better appreciate the improvement, we compared the performance of the S2013 versus that of the S2008. In particular, we evaluated the ability of the simulator to provide a population of virtual subjects representative of T1DM patients. To do this, simulations have been compared with a database of 24 T1DM adult subjects studied in two 22-h admissions, in open- and closed-loop, respectively.8
The comparison consisted, first, in determining if, for each T1DM subject, a virtual subject exists who shows a similar metabolic response and lies in the same clinically relevant zones (hypo-, eu-, and hyperglycemia) when exposed to the same scenario (meal intake and insulin administration). Our results show that the S2013 well reproduces the glucose patterns in eu-, hyper-, and, above all, hypoglycemia, where the hypoglycemic episodes predicted by the simulator well reflect those observed in clinical trials (Fig. 2, left panel). This is confirmed by the CG-EGA analysis (Table 1, first row), where the average results are satisfactory in all the three clinical zones (hypo-, eu-, and hyperglycemia). In addition, the distributions of most of the outcome metrics in in silico and real subjects are virtually identical (Table 2, second column). On the other hand, we observed that the S2008 reproduces quite well the glucose patterns in euglycemia and hyperglycemia, but not the hypoglycemic episodes, which are difficult to predict (Fig. 2, right panel). This fact is also revealed by the CG-EGA analysis (Table 1, second row), where the average results in hypoglycemia are not as good as those in euglycemia and hyperglycemia. Moreover, most of the in silico outcome metrics are significantly different from their clinical counterparts (Table 2, third column). Thus, the frequency of hypoglycemia episodes predicted by the S2008 does not fully reflect that observed during clinical trials.
We also compared some clinically relevant parameters (like CR and body weight) of the subjects with those of their virtual matches. We found that the percentage difference between subject and virtual parameters was 18% on average for body weight and 67% for CR. The higher difference found for CR is due to the fact that the virtual CR is the “optimal” one for a given patient. Thus, when doing the comparison, one should take into account the postprandial glycemic control obtained in the experiment: for instance, if the virtual CR is higher than the real one, but the real CR makes the subject experience hypoglycemia, one should have administered less insulin (i.e., applying a higher CR for that meal); conversely, if the virtual CR is lower than the real one, but the real CR makes the subject experience hyperglycemia, one should have administered more insulin (i.e., applying a lower CR for that meal). This analysis revealed that a difference between real and virtual CR >50% was present in 23 subjects. However, 14 of them would have benefitted by using a CR closer to the virtual one. We also applied the matching criterion limiting the search to the virtual subjects with CR similar to the real one. In this case a match was always found except for eight traces, which, however, presented hypoglycemia, and thus the corresponding CR were suboptimal, as explained above. This procedure also provided similar results in terms of CE-EGA.
However, it is important to stress that the simulator is not designed to do prospective studies on a given individual, given the large intrasubject variability of real life. The large intra- and interday variability was confirmed in this study. In fact, we found that none of the subjects was matched by the same virtual patient at dinner and breakfast.
We acknowledge that this study has some limitations. First, the dataset used for the assessment, consisting of 24 subjects, cannot be considered a large database, despite subjects being studied twice with two meals per trial for a total of 96 traces. Second, the dataset used for model assessment only includes inpatient data. Unfortunately, we do not have data to prove that the performance would be as robust in outpatient free-living individuals. However, it is likely that finding a match between real and simulated subjects is easier if only three or four BG values are available in a day, as happens in real life. One possibility would be to use CGM data instead. In principle, if information on the exact timing of the meals and carbohydrates content is available, we are pretty confident that the method proposed here can be applied to outpatient free-living individuals. Third, only the adult population has been considered in this article. As for what concerns the model included in the S2013, like all models, it presents some limitations. The most important one is that the model does not yet take into account the intraindividual diurnal parameter variability. This information will be incorporated into the simulator in the near future, based on recent experiments in T1DM.3 Finally, as already discussed by Dalla Man et al.,2 the inclusion of glucagon secretion into the model could be not appropriate for all T1DM patients with a long duration of T1DM, given that the counterregulatory response is known to decrease over time. As already stated by Dalla Man et al.,2 future versions of the simulator will allow the possibility for the user to include or not the counterregulation.
In conclusion, this study proves the validity of the S2013 (Fig. 1B), which incorporates a novel nonlinear response to hypoglycemia and includes a counterregulation model. The updated distribution of virtual subjects included in the simulator well represents the T1DM population observed in clinical trials, thus allowing in silico trials to be run in a more realistic scenario.
Acknowledgments
This study was supported by JDRF grant 17-2011-273 and the Italian Ministero dell'Università e della Ricerca (grant FIRB 2009).
Author Disclosure Statement
C.C. and C.D.M. hold patent applications and have received royalties related to the presented technology. R.V. and B.K. declare no competing financial interests exist.
References
- 1.Kovatchev BP, Breton M, Dalla Man C, Cobelli C: In silico preclinical trials: a proof of concept in closed-loop control of type 1 diabetes. J Diabetes Sci Technol 2009;3:44–55 [DOI] [PMC free article] [PubMed] [Google Scholar]
- 2.Dalla Man C, Micheletto F, Lv D, Breton M, Kovatchev BP, Cobelli C: The UVA/PADOVA Type 1 Diabetes Simulator: New Features. J Diabetes Sci Technol 2014;8:26–34 [DOI] [PMC free article] [PubMed] [Google Scholar]
- 3.Hinshaw L, Dalla Man C, Nandy DK, Saad A, Bharucha AE, Levine JA, Rizza RA, Basu R, Carter RE, Cobelli C, Kudva YC, Basu A: Diurnal pattern of insulin action in type 1 diabetes: implications for a closed loop system. Diabetes 2013;62:2223–2229 [DOI] [PMC free article] [PubMed] [Google Scholar]
- 4.Kovatchev BP, Farhy LS, Cox DJ, Straume M, Yankov VI, Gonder-Frederick LA, Clarke WL: Modeling insulin-glucose dynamics during insulin induced hypoglycemia. Evaluation of glucose counterregulation. J Theor Med 1999;1:313–323 [Google Scholar]
- 5.Kovatchev BP, Straume M, Farhy LS, Cox DJ: Dynamic network model of glucose counterregulation in subjects with insulin-requiring diabetes. Methods Enzymol 2000;321:396–410 [DOI] [PubMed] [Google Scholar]
- 6.Micheletto F, Dalla Man C, Vella A, Cobelli C: A model of glucagon secretion and action in healthy subjects [abstract A105]. In: Book of Abstracts. 10th Diabetes Technology Meeting. Bethesda, MD: Diabetes Technology Society, 2010 [Google Scholar]
- 7.Kovatchev BP, Straume M, Cox DJ, Farhya LS: Risk analysis of blood glucose data: a quantitative approach to optimizing the control of insulin dependent diabetes. J Theor Med 1999;3:1–10 [Google Scholar]
- 8.Kovatchev B, Cobelli C, Renard E, Anderson S, Breton M, Stephen P, Clarke W, Bruttomesso D, Maran A, Costa S, Avogaro A, Dalla Man C, Facchinetti A, Magni L, De Nicolao G, Place J, Farret A: Multinational study of subcutaneous model-predictive closed-loop control in type 1 diabetes mellitus: summary of the results. J Diabetes Sci Technol 2010;4:1374–1381 [DOI] [PMC free article] [PubMed] [Google Scholar]
- 9.Kovatchev BP, Cox DJ, Gonder-Frederick LA, Clarke WL: Evaluating the accuracy of continuous glucose-monitoring sensors: continuous glucose-error grid analysis illustrated by TheraSense Freestyle Navigator data. Diabetes Care 2004;27:1922–1928 [DOI] [PubMed] [Google Scholar]
- 10.Clarke WL: The original Clarke Error Grid Analysis (EGA). Diabetes Technol Ther 2005;7:776–779 [DOI] [PubMed] [Google Scholar]
- 11.Kovatchev BP, Cox DJ, Gonder-Frederick LA, Young-Hyman D, Schlundt D, Clarke WL: Assessment of risk for severe hypoglycemia among adults with IDDM: validation of the Low Blood Glucose Index. Diabetes Care 1998;21:1870–1875 [DOI] [PubMed] [Google Scholar]
- 12.Kovatchev BP, Cox DJ, Gonder-Frederick LA, Clarke WL: Methods for quantifying self-monitoring blood glucose profiles exemplified by an examination of blood glucose patterns in patients with type 1 and type 2 diabetes. Diabetes Technol Ther 2002;4:295–303 [DOI] [PubMed] [Google Scholar]