Abstract
Introduction
Although differences in heart failure hospitalization rates by race and sex are well documented, little is known about geographic variations in hospitalization rates for heart failure among Medicare beneficiaries.
Methods
Using exploratory spatial data analysis techniques, we examined hospitalization rates for heart failure as the first-listed discharge diagnosis among Medicare beneficiaries in a 10-state Tennessee catchment area, based on the resident states reported by Tennessee hospitals from 2000 to 2004.
Results
The age-adjusted heart failure hospitalization rate (per 1,000) among Medicare beneficiaries was 23.3 (95% confidence interval [CI], 23.3–23.4) for the Tennessee catchment area, 21.4 (95% CI, 21.4 -21.5) for the non-catchment US area and 21.9 (95% CI, 21.9–22.0) for the overall US. The age-adjusted HF hospitalization rates were also significantly higher in the catchment area than the non catchment US area and the overall US, among men, women, and whites, whereas rates among the blacks were higher outside the catchment area. Beneficiaries in the catchment area also had higher age-specific HF hospitalization rates. Among states in the catchment area, the highest mean county-level rates were in Mississippi (30.6±7.6) and Kentucky (29.2±11.5), and the lowest were in North Carolina (21.7±5.7), closely and Virginia (21.8±6.6).
Conclusions
Knowledge of geographic differences in rates of hospitalization for heart failure can be useful in identifying needs of health care providers, allocating resources, developing comprehensive heart failure outreach programs, and formulating policies designed to reduce these differences.
Keywords: geographic differences, heart failure, elderly, Medicare
Although heart failure (HF) is the most common principal (i.e., first-listed) hospital discharge diagnosis among Medicare beneficiaries, little is known about geographic variations in rates of hospitalizations for HF beyond recent findings that rates are highest in the southeastern United States.1,2 Relatively high HF hospitalization rates among women and African-Americans as well as an increasing national trend in HF hospitalizations have been well documented.4-9 Because most cardiovascular diseases ultimately lead to HF10, HF exerts a huge financial toll.11 Despite this, only a few accredited centers, in the southeastern United States provide comprehensive, high-quality care for patients with all stages of HF.12 In one accredited medical center in Tennessee, we observed that a large number of patients admitted for HF were from outside the metropolitan area and, that the outcomes of these patients may vary with their access to care. With this background, these states were defined as the Tennessee catchment area and we examined HF hospitalizations and geographical differences in HF hospitalization rates among Medicare beneficiaries, in order to inform the development and expansion of heart failure disease management programs. We hypothesize that Tennessee catchment area will have high heart failure hospitalization rates since it lies within the “Stroke Belt”13-15 and the “Coronary Valley”16 -- regions known for high stroke and heart disease mortality rates.
METHODS
Data Source
We analyzed US Medicare hospital claims and beneficiary enrollment record data for 2000-2004 from the Centers for Medicare and Medicaid Services, specifically data from the Medicare Provider Analysis and Review (MEDPAR) file, Part A, which contains billing information on inpatient care records for Medicare beneficiaries who filed hospital claims. The claims data included admission and discharge information about patients such as their age at admission, race, sex, county and state of residence, source of admission, admission diagnosis, discharge destination, and up to 10 discharge diagnoses. Beneficiary enrollment records included data on beneficiaries’ race, sex, county and state of residence, date of birth, date of death (for those who died during the year), monthly status regarding type of Medicare eligibility, and monthly status regarding membership in a health management organization.
Study Population
We limited our study population to patients who were aged ≥65 years, resided in the 50 states or the District of Columbia (DC), were entitled to Medicare Part A benefits on July 1, were not members of health maintenance organizations, and had a first-listed (principal) hospital discharge diagnosis of HF as indicated by code 428 of the International Classification of Diseases, 9th Revision—Clinical Modification (ICD-9-CM).17 The number of hospitalizations among patients who met these criteria in Tennessee hospitals ranged from 16,152 in 2000 to 17,858 in 2004; of these, 90–91% occurred among Tennessee residents, and 8–9% among residents from Alabama, Arkansas, Florida, Georgia, Kentucky, Mississippi, Missouri, North Carolina, and Virginia, which were defined as the Tennessee catchment area. Less than 1% of Medicare patients treated for HF in Tennessee hospitals during the study period were from outside the catchment area.
Patient Characteristics
We examined the distribution of the following characteristics following characteristics among our study population stratified by catchment area status: race (white, black, Hispanic, or other), age group (65-74, 75-84, or ≥85 years), sex, admission source (emergency room, physician’s office/clinic, another hospital, skilled nursing facility, or other), discharge destination (home, skilled nursing facility, other care facility including short-term and intermediate, in-hospital death, or other), and presence of conditions as indicated by ICD-9-CM codes for patients’ discharge diagnoses: hypertension (401-405), coronary heart disease (410–414), diabetes mellitus (250), atrial fibrillation (427.3), cardiomyopathy (425), valvular heart disease (394–397 or 424.0-424.3), chronic renal failure (585), and any arrhythmias (427). We also calculated the proportion the proportion of patients who had an admission diagnosis of HF and the proportion of HF patients who died within 30 days of admission (i.e., the case fatality rate).
Statistical Analysis
We used SAS software, version 9.1 (SAS Institute Inc., Cary, NC) for all statistical analyses. Hospitalization rates (per 1000 Medicare beneficiaries) were age-adjusted to the 2000 U.S. standard population ≥ 65 years.18 We calculated rates for each state within the catchment area, for the entire catchment area, for the non-catchment US area, and for the entire United States. The denominators for our rates were from Medicare enrollment records. We used chisquare tests to determine whether differences in rates were significant and considered p values <0.05 to be indicative of significant differences.
Spatial Analysis
Using exploratory spatial data analysis techniques, which describe and provide insights into processes operating in space,19, 20 we also analyzed county-level HF rates among beneficiaries who resided within the catchment area. By using a local indicator of spatial association (LISA) rather than a global measure of spatial autocorrelation such as Moran’s I 21 to compare the HF rates of counties with the rates of nearby counties, we were able to assess the degree to which rates were spatially autocorrelated at the local level and more precisely identify spatial clustering of unusually high or low county-level HF rates within the study area. On the basis of the results of these analyses, we assigned counties in the catchment area to one of the following five categories: 1) not part of a spatial cluster of counties with high or low HF rates; 2) in a cluster of counties with high HF rates; 3) in a cluster of counties with low HF rates: 4) a county with a high HF rate surrounded by counties with low rates; and 5) a county with a low HF rate surrounded by counties with high rates. The latter two categories can be considered spatial outliers, as the HF rates in these counties are atypical of the rates of contiguous and nearby areas. There are 1014 counties in the catchment area. This represents one-third (32.3%) of the total number (3141) of counties and county-equivalent areas in the United States in 2010. We characterized the population density of counties in the catchment area by combining the sixcategory Urban-Rural Classification Scheme for Counties, developed by the National Center for Health Statistics.22
RESULTS
Of 3,091,542 eligible hospital claims records with a first-listed discharge diagnosis of HF that were submitted for Medicare reimbursement during 2000-2004, 845,421 (27.3%) were for patients residing in the catchment area. Selected characteristics of Medicare beneficiaries for all three geographic aggregations are also shown in Table 1. The age-adjusted HF hospitalization rate within the catchment area was 23.3 per 1000 Medicare beneficiaries (95% CI, 23.3–23.4) per 1000 Medicare beneficiaries), which was significantly higher than the rate of 21.4 (95% CI, 21.4-21.5) outside the catchment area and 21.9 (95% CI, 21.9–22.0) for the overall United States. This difference was observed each year. Significant differences in the distribution of patient characteristics included patients aged 65-74 (30.8% in the catchment area vs. 27.8 % outside the area; black patients (15.5% in vs. 10.3% outside); patients with hypertension, the most common comorbidity in this population (53.2% in vs. 52.6% outside); patients with cardiomyopathy (17.5% in vs. 14.8% outside); beneficiaries admitted directly from a physician’s office (30.2% in vs. 26.8% outside); beneficiaries admitted from an emergency room (66.6% in vs. 69.2% outside); beneficiaries discharged home (71.1% in vs. 68.5% outside); and beneficiaries discharged to a skilled nursing facility (13.6% in vs. 15.9% outside) (all p was <0.05).
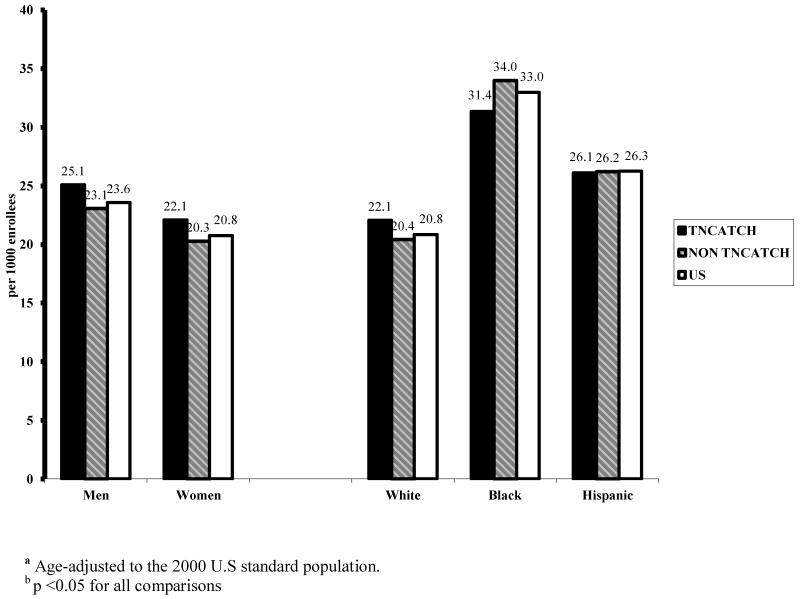
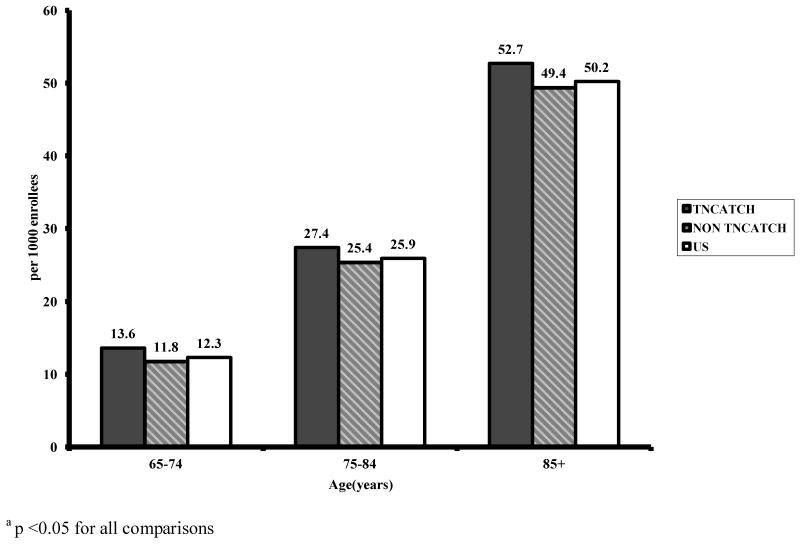
Age-adjusted HF hospitalization rates among men, women, and whites were higher in the catchment area than outside the catchment area as well as the United States, whereas rates among the blacks were higher outside the catchment area (Figure 1). Rates in all the three age groups were also higher (Figure 2).
Figure 1.
Age-adjusted hospitalization rates (per 1000 Medicare beneficiaries) with heart failure (ICD-9-CM 428) as the first-listed discharge diagnosis, by gender, race and catchment area: 2000-2004
Figure 2.
Age-specific hospitalization rates (per 1000 Medicare beneficiaries) with heart failure (ICD-9-CM 428) as the first-listed discharge diagnosis, by catchment area: Medicare, 2000-2004
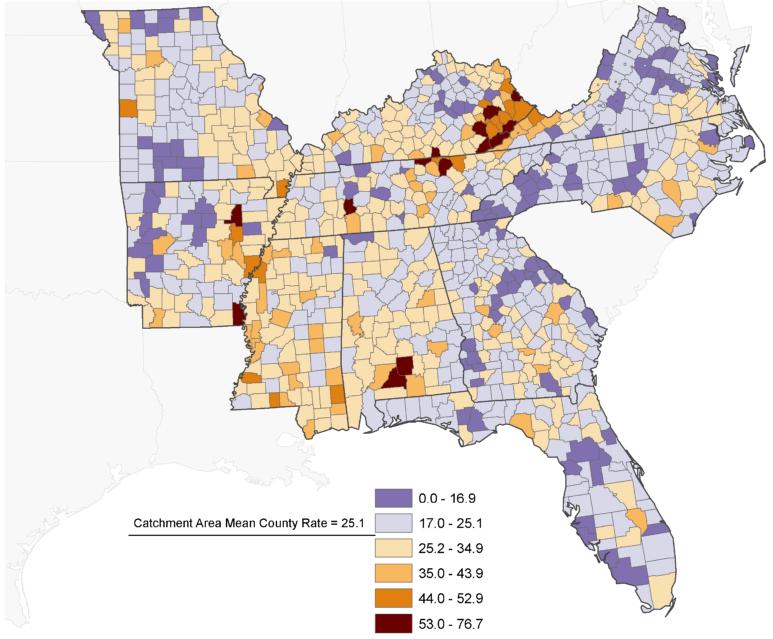
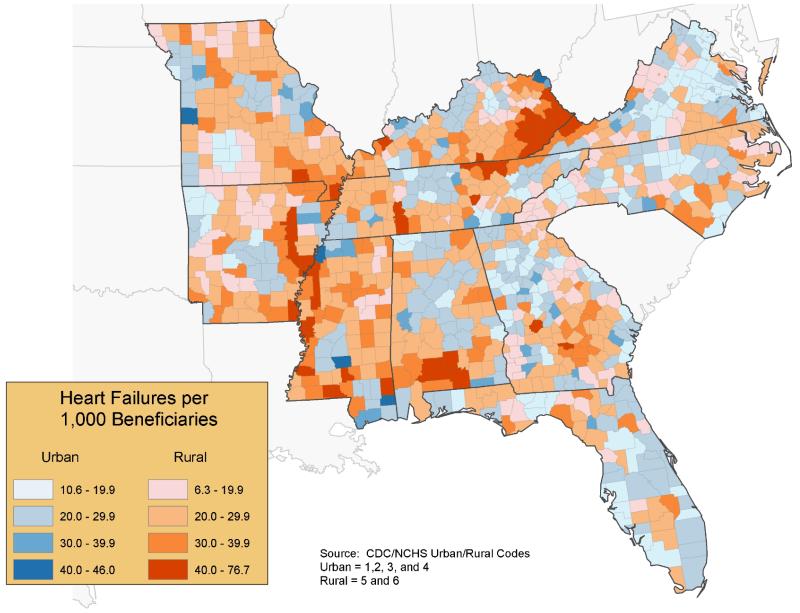
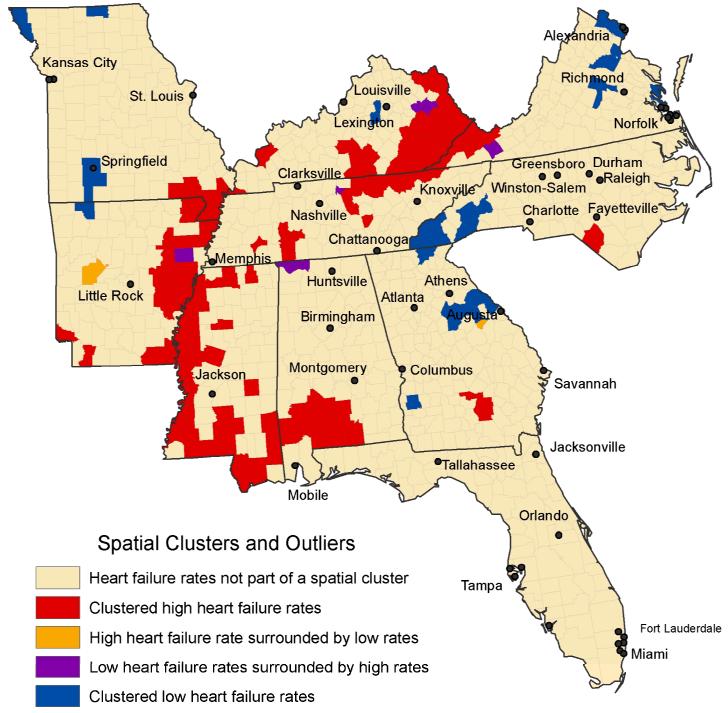
The unadjusted mean HF hospitalization rate (per 1000 Medicare beneficiaries) was 25.1 in counties within the catchment area and 21.9 in all U.S. counties. County-level rates in the catchment area ranged from 6.3 in Randolph County, Georgia, to 76.7 in Clay County, Tennessee (Figure 3). Rates were generally higher in rural counties than in urban counties (Figure 4). Mean county-level rates for states in the catchment area ranged from 30.6 (± 7.6 standard deviation) in Mississippi to 21.7 (±5.7 standard deviation) in North Carolina, and the within-state range in county-level rates ranged from 61.3 in Tennessee to 24.2 in Florida (Table 2). As shown in Figure 5, counties within the catchment area that had HF hospitalization rates (per 1,000 Medicare beneficiaries) at least two standard deviations above the mean county-level rate for the catchment area (>42.1) were concentrated in eastern Kentucky, western Virginia, north central Tennessee, south central Alabama, southern Mississippi, and portions of the Mississippi River delta along the borders of Missouri, Arkansas, and Mississippi. Conversely, counties with rates at least one standard deviation below the mean county-level rate for the catchment area (<16.7) were concentrated in portions of Virginia, North Carolina, eastern and south western Georgia north central Kentucky, central Tennessee, north central and south eastern Missouri, central and western Arkansas, and portions of Florida.
Figure 3.
Hospitalization rates for heart failure (ICD-9-CM 428) as the first-listed discharge diagnosis among Medicare beneficiaries, by county: Tennessee Catchment Area, 2000–2004
Figure 4.
Hospitalization rates for heart failure (ICD-9-CM 428) as the first-listed discharge diagnosis among Medicare beneficiaries, stratified by urban and rural counties: Tennessee Catchment Area, 2000–2004
Figure 5.
Spatial clustering of hospitalization rates for heart failure (ICD-9-CM 428) as first-listed discharge diagnosis among Medicare beneficiaries, by county: Tennessee Catchment Area, 2000–2004.
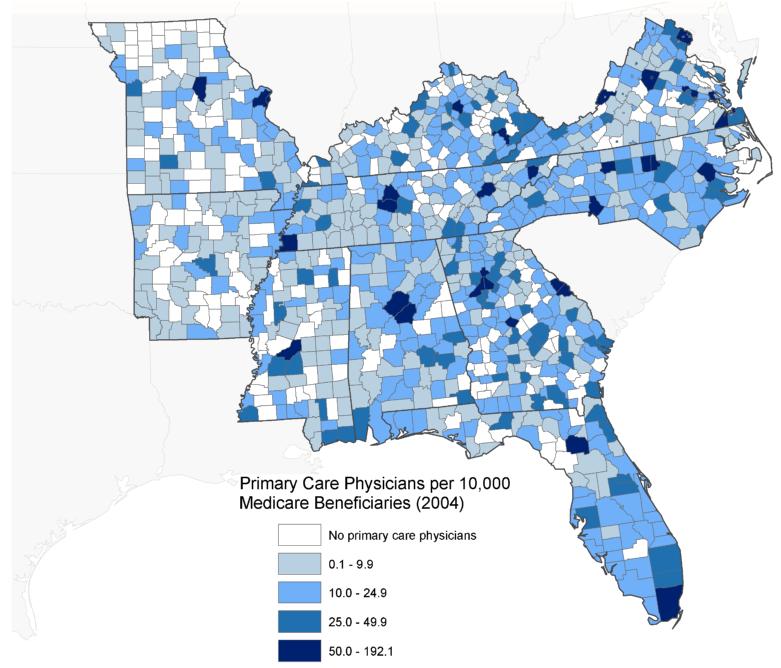
As shown in Figure 6, the ratio of primary care physicians (PCPs) to Medicare beneficiaries was generally higher in urban counties than in rural counties except for Appalachian regions in eastern Kentucky and portions of western Virginia, where the ratio was generally higher in rural counties. HF rates were generally lower in counties with high PCP-to-beneficiary ratios except in Appalachian regions of Kentucky and Virginia, which had a high ratio of PCPs to beneficiaries and high HF rates.
Figure 6.
Number of primary care physicians per 10,000 Medicare beneficiaries, by county: Tennessee Catchment Area, 2004.
DISCUSSION
Our most notable finding was that HF hospitalization rates among Medicare beneficiaries in the catchment area were generally higher in rural areas than in urban areas. Possible explanations for this difference include generally greater access to physicians in urban areas, as shown in Figure 4. However, other factors such as differences in the socioeconomic characteristics of Medicare beneficiaries in urban and rural areas may also have contributed to the generally higher rates in rural areas. Further analyses will be necessary to quantify the strength of the relationship between population density and HF hospitalization rates.
Our finding that more than 50% of the patients in the catchment area who were hospitalized for HF also had hypertension, 23 a major risk factor for the development of HF, suggests the need to promote adherence to hypertension treatment guidelines by healthcare providers in this region.24, 25 Our study provides first estimates of rural versus urban differences in HF hospitalizations. Although county-level HF hospitalization rates within the catchment area have not been assessed previously, our findings are consistent with those of prior studies of geographic variations in HF hospitalization and readmission rates among Medicare beneficiaries, that found higher hospitalization and readmission rates along the Mississippi River Valley and the Appalachian region.2, 26
Our main study limitation was its exclusion of Medicare beneficiaries <65 years of age and those enrolled in managed care plans. However, >80% of US hospital patients with a primary diagnosis of HF are aged ≥ 65 years,9 and approximately 17% of all Medicare enrollees were members of managed care organizations in 2004,27 which suggests that we can generalize our results to most patients with HF. A second limitation was that because our study was based on an analysis of Medicare hospital claims data, which does not indicate disease severity, we were unable to estimate HF hospitalization rates by disease severity or rates of mild HF that did not require hospitalization.
Despite these limitations, our results suggest how knowledge of geographical differences in HF hospitalization rates may help in identifying needs of health care providers, including staffing and education needs, as well as provide guidance in developing government strategies to reduce these differences.2 Such strategies might include the formation of partnerships between relevant stakeholders, such as partnerships between health care organizations and hospitals to provide cardiac services to rural areas. A direct result of this study, for example, was the development of an HF outreach program in a region that we identified as having one of the highest rates of HF hospitalization. Although follow-up assessments of HF hospitalization rates in this region will be necessary in order to determine the value of this program, such heart disease management programs have been shown to reduce the burden of disease and overall use of resources,28-30 and these programs should arguably be focused on areas where the heart disease burden is greatest.
Table 1. Selected characteristics of Medicare beneficiaries with heart failure (ICD-9-CM 428) as the first-listed discharge diagnosis, by Tennessee Catchment Area, 2000–2004.
| Characteristic a | Tennessee Catchment Area b [N=845,421] |
Non-Catchment Area [N=2,246,121] |
United States [N=3,091,542] |
|---|---|---|---|
| Hospitalization Rates per 1000c (95 %CI) | 23.3 (23.3–23.4) | 21.4 (21.4–21.5) | 21.9 (21.9–22.0) |
|
Hospitalization Rates per 1000c (95 %CI)
Year |
|||
| 2000 | 23.4 (23.3–23.6) | 21.8 (21.7–21.9) | 22.2 (22.2–22.3) |
| 2001 | 23.2 (23.1–23.3) | 21.5 (21.4–21.5) | 21.9 (21.9–22.0) |
| 2002 | 22.6 (22.5–22.7) | 21.0 (21.0–21.0) | 21.4 (21.4–21.5) |
| 2003 | 23.7 (23.6–23.8) | 21.6 (21.5–21.7) | 22.1 (22.1–22.2) |
| 2004 | 23.7 (23.6–23.8) | 21.2 (21.1–21.2) | 21.8 (21.8–21.9) |
| Age (years)(%) | |||
| 65–74 | 30.8 | 27.8 | 28.6 |
| 75–84 | 41.3 | 42.0 | 41.8 |
| 85+ | 27.9 | 30.2 | 29.6 |
| Women (%) | 57.6 | 57.3 | 57.4 |
| Race/Ethnicity (%) | |||
| White | 82.0 | 84.9 | 84.1 |
| Black | 15.5 | 10.3 | 11.8 |
| Hispanic | 1.1 | 2.1 | 1.8 |
| Other | 1.4 | 2.7 | 2.4 |
| Selected Comorbidities [ICD-9-CM] (%) | |||
| Hypertension [401–405] | 53.2 | 52.6 | 52.8 |
| Coronary Heart Disease [410–414] | 47.3 | 48.3 | 48.0 |
| Any Arrhythmias [427] | 43.3 | 43.8 | 43.7 |
| Atrial Fibrillation [427.3] | 36.1 | 37.0 | 36.8 |
| Diabetes Mellitus [250] | 36.1 | 36.0 | 36.0 |
| Valvular Heart Disease | 20.6 | 20.6 | 20.6 |
| [394–397, 424.0–424.3] | |||
| Cardiomyopathy [425] | 17.5 | 14.8 | 15.5 |
| Chronic Renal Failure [585] | 3.1 | 3.7 | 3.6 |
| Admission Diagnosis of Heart Failure (%) | 67.9 | 67.1 | 67.3 |
| Admission Source (%) | |||
| Emergency Room | 66.6 | 69.2 | 68.5 |
| Physician’s office/Clinic | 30.2 | 26.8 | 27.7 |
| Hospital Transfer | 2.4 | 2.5 | 2.5 |
| Skilled Nursing Facility | 0.7 | 1.3 | 1.2 |
| Other | 0.1 | 0.2 | 0.1 |
| Discharge Destination (%) | |||
| Home | 71.1 | 68.5 | 69.2 |
| Skilled nursing facility | 13.6 | 15.9 | 15.3 |
| Other facility | 8.4 | 8.5 | 8.5 |
| Died | 5.2 | 5.0 | 5.0 |
| Other | 1.7 | 2.1 | 2.0 |
| 30–day Case Fatality Rate (%) | 10.3 | 10.1 | 10.1 |
All p was significant (p<0.05)for all comparisons
Tennessee catchment consists of AL, AK, FL, GA, KY, MO, MS, NC, TN, and VA.
Rates per 1000 and 95% CI are age-adjusted to the 2000 U.S standard population.
Table 2. Hospitalization rates (per 1000 Medicare beneficiaries) and selected statistics for heart failure (ICD-9-CM 428) as the first-listed discharge diagnosis in states within the Tennessee Catchment Area, 2000–2004.
| Estimate | Alabama | Arkansas | Florida | Georgia | Kentucky | Missouri | Mississippi | North Carolina |
Tennessee | Virginia |
|---|---|---|---|---|---|---|---|---|---|---|
|
Mean
state-level rate based on county- level rates |
27.7 | 25.9 | 22.3 | 23.0 | 29.2 | 24.6 | 30.6 | 21.7 | 27.6 | 21.8 |
|
Standard
Deviation σ |
6.9 | 9.6 | 5.2 | 6.1 | 11.5 | 6.8 | 7.6 | 5.7 | 10.2 | 6.6 |
|
Maximum
County- level rate |
54.2 | 62.9 | 38.5 | 42.5 | 66.4 | 52.3 | 49.8 | 39.1 | 76.7 | 46.6 |
|
Minimum
County- level rate |
16.1 | 8.1 | 14.3 | 6.3 | 11.4 | 10.8 | 15.1 | 7.6 | 15.3 | 8.5 |
|
Within-
State Range Total Number |
38.0 65,969 |
54.8 44,3389 |
24.2 207,276 |
36.2 81,895 |
54.9 66,190 |
41.5 77,232 | 34.7 48,527 |
31.5 97,188 |
61.3 79,700 |
38.1 77,055 |
|
Age- adjusted rate for state residents (95% C.I.) |
26.0 (25.8– 26.2) |
25.5 (25.2– 25.7) |
20.7 (20.6– 20.8) |
22.9 (22.8– 23.1) |
28.8 (28.6– 29.0) |
24.7 (24.5– 24.9) |
29.9 (29.6– 30.2) |
21.5 (21.4– 21.7) |
25.2 (25.0– 25.4) |
20.8 (20.6– 20.9) |
Acknowledgments
The findings and conclusions in this article are those of the authors and do not necessarily represent the official position of the Centers for Disease Control and Prevention.
Funding/Support: This study was supported by the Centers for Disease Control and Prevention through an inter agency professional agreement with Dr. Ogunniyi.
Footnotes
Disclosure: None
References
- 1.Zhang W, Watanabe-Galloway S. Ten-year secular trends for congestive heart failure hospitalizations: an analysis of regional differences in the United States. Congest Heart Fail. 2008;14:266–71. doi: 10.1111/j.1751-7133.2008.00009.x. [DOI] [PubMed] [Google Scholar]
- 2.Casper M, Nwaise I, Croft JB, et al. Geographic differences in heart failure hospitalization rates among Medicare beneficiaries. J Am Coll Cardiol. 2010;55(4):294–9. doi: 10.1016/j.jacc.2009.10.021. [DOI] [PubMed] [Google Scholar]
- 3.The United Health Foundation . America’s Health Rankings. 2009 Edition. Minnetonka, MN: cited 2010 April 9. [Google Scholar]
- 4.Ghali JK, Cooper R, Ford E. Trends in hospitalization rates for heart failure in the United States, 1973-1986: evidence for increasing population prevalence. Arch Intern Med. 1990;150:769–73. [PubMed] [Google Scholar]
- 5.Gillum RF. Epidemiology of heart failure in the United States. Am Heart J. 1993;126:1043–47. doi: 10.1016/0002-8703(93)90738-u. [DOI] [PubMed] [Google Scholar]
- 6.Croft JB, Giles WH, Pollard RA, et al. National trends in the initial hospitalization for heart failure. J Am Geriatr Soc. 1997;45:270–75. doi: 10.1111/j.1532-5415.1997.tb00939.x. [DOI] [PubMed] [Google Scholar]
- 7.Haldeman GA, Croft JB, Giles WH, et al. Hospitalization of patients with heart failure: national hospital discharge survey, 1985 to 1995. Am Heart J. 1999;137:352–60. doi: 10.1053/hj.1999.v137.95495. [DOI] [PubMed] [Google Scholar]
- 8.Brown DW, Haldeman GA, Croft JB, et al. Racial or ethnic differences in hospitalization for heart failure among elderly adults: Medicare, 1990 to 2000. Am Heart J. 2005;150:448–54. doi: 10.1016/j.ahj.2004.11.010. [DOI] [PubMed] [Google Scholar]
- 9.Fang J, Mensah GA, Croft JB, et al. Heart failure-related hospitalization in the U.S., 1979 to 2004. J Am Coll Cardiol. 2008;52:428–34. doi: 10.1016/j.jacc.2008.03.061. [DOI] [PubMed] [Google Scholar]
- 10.Moser DK, Riegel B, editors. Improving outcomes in heart failure, an interdisciplinary approach. Aspen Publishers; Gaithersburg: 2001. [Google Scholar]
- 11.American Heart Association . Heart Disease and Stroke Statistics — 2010 Update. American Heart Association; Dallas, Texas: 2010. [Google Scholar]
- 12.Society of Chest Pain Centers . Map of Accredited Facilities. Columbus, Ohio: 2009. cited 2010 April 9. [Google Scholar]
- 13.Lanska DJ. Geographic distribution of stroke mortality in the United States: 1939-1941 to 1979-1981. Neurology. 1993;43:1839–51. doi: 10.1212/wnl.43.9.1839. [DOI] [PubMed] [Google Scholar]
- 14.Howard G, Evans GW, Pearce K, et al. Is the stroke belt disappearing? An analysis of racial, temporal, and age effects. Stroke. 1995;26:1153–58. doi: 10.1161/01.str.26.7.1153. [DOI] [PubMed] [Google Scholar]
- 15.Casper ML, Barnett E, Williams GI, Jr., et al. Atlas of Stroke Mortality: Racial, Ethnic, and Geographic Disparities in the United States. Centers for Disease Control and Prevention; Atlanta, GA: 2003. [Google Scholar]
- 16.Pickle LW, Gillum RF. Geographic variation in cardiovascular disease mortality in US blacks and whites. J Nat Med Assoc. 1999;91:545–56. [PMC free article] [PubMed] [Google Scholar]
- 17.Department of Health and Human Services . International Classification of Diseases, 9th Revision, Clinical Modification: ICD-9-CM. Department of Health and Human Services; Washington DC: 1980. DHHS publication no. (PHS) 80-1260. [Google Scholar]
- 18.Klein RJ, Schoenborn CA. Age adjustment using the 2000 projected U.S. population. National Center for Health Statistics; Hyattsville, Maryland: Jan, 2001. Healthy People Statistical Notes, no. 20. [PubMed] [Google Scholar]
- 19.Bailey TC, Gatrell AC. Interactive Spatial Data Analysis. Longman; Harlow, Essex, England: 1995. [Google Scholar]
- 20.O’Sullivan D, Unwin D. Geographic Information Analysis. Wiley; Hoboken, New Jersey: 2002. [Google Scholar]
- 21.Anselin L. Local indicators of spatial association—LISA. Geographical Analysis. 1995;27(2):93–155. [Google Scholar]
- 22.National Center for Health Statistics NCHS . Urban-Rural Classification Scheme for Counties. US Department of Health and Human Services; Hyattsville (MD): 2006. cited November 13, 2009. [Google Scholar]
- 23.Perry MH, Roccella EJ. Conference report on stroke mortality in the southeastern United States. Hypertension. 1998;31:1206–15. doi: 10.1161/01.hyp.31.6.1206. [DOI] [PubMed] [Google Scholar]
- 24.Komajda M, Lapuerta P, Hermans N, et al. Adherence to guidelines is a predictor of outcome in chronic heart failure: the MAHLER survey. Eur Heart J. 2005;26:1653–59. doi: 10.1093/eurheartj/ehi251. [DOI] [PubMed] [Google Scholar]
- 25.Braun E, Landsman K, Zuckerman R, et al. Adherence to guidelines improves the clinical outcome of patients with acutely decompensated heart failure. Isr Med Assoc J. 2009;11(6):348–53. [PubMed] [Google Scholar]
- 26.Krumholz HM, Merrill AR, Schone EM, et al. Patterns of hospital performance in acute myocardial infarction and heart failure 30-day mortality and readmission. Circ Cardiovasc Qual Outcomes. 2009;2:407–13. doi: 10.1161/CIRCOUTCOMES.109.883256. [DOI] [PubMed] [Google Scholar]
- 27.Centers for Disease Control and Prevention Racial disparities in total knee replacement among Medicare enrollees—United States, 2000-2006. Morbid Mortal Weekly Rep. 2009;58:133–139. [PubMed] [Google Scholar]
- 28.Sidorov J. Reduced health care costs associated with disease management for chronic heart failure: a study using three methods to examine the financial impact of a heart failure disease management program among Medicare Advantage enrollees. J Card Fail. 2006;12(8):594–600. doi: 10.1016/j.cardfail.2006.07.006. [DOI] [PubMed] [Google Scholar]
- 29.Chan DC, Heidenreich PA, Weinstein MC, et al. Heart failure disease management programs: a cost-effectiveness analysis. Am Heart J. 2008;155(2):332–88. doi: 10.1016/j.ahj.2007.10.001. [DOI] [PubMed] [Google Scholar]
- 30.Hebert PL, Sisk JE, Wang JJ, et al. Cost-effectiveness of nurse-led disease management for heart failure in an ethnically diverse urban community. Ann Intern Med. 2008;149(8):540–8. doi: 10.7326/0003-4819-149-8-200810210-00006. [DOI] [PMC free article] [PubMed] [Google Scholar]


