Abstract
How does the mammalian retina detect motion? This classic problem in visual neuroscience has remained unsolved for 50 years. In search of clues, we reconstructed Off-type starburst amacrine cells (SACs) and bipolar cells (BCs) in serial electron microscopic images with help from EyeWire, an online community of “citizen neuroscientists.” Based on quantitative analyses of contact area and branch depth in the retina, we found evidence that one BC type prefers to wire with a SAC dendrite near the SAC soma, while another BC type prefers to wire far from the soma. The near type is known to lag the far type in time of visual response. A mathematical model shows how such “space-time wiring specificity” could endow SAC dendrites with receptive fields that are oriented in space-time and therefore respond selectively to stimuli that move in the outward direction from the soma.
Compared to cognitive functions such as language, the visual detection of motion may seem trivial, yet the underlying neural mechanisms have remained elusive for half a century1,2. Some retinal outputs (ganglion cells) respond selectively to visual stimuli moving in particular directions, while retinal inputs (photoreceptors) lack direction selectivity (DS). How does DS emerge from the microcircuitry connecting inputs to outputs?
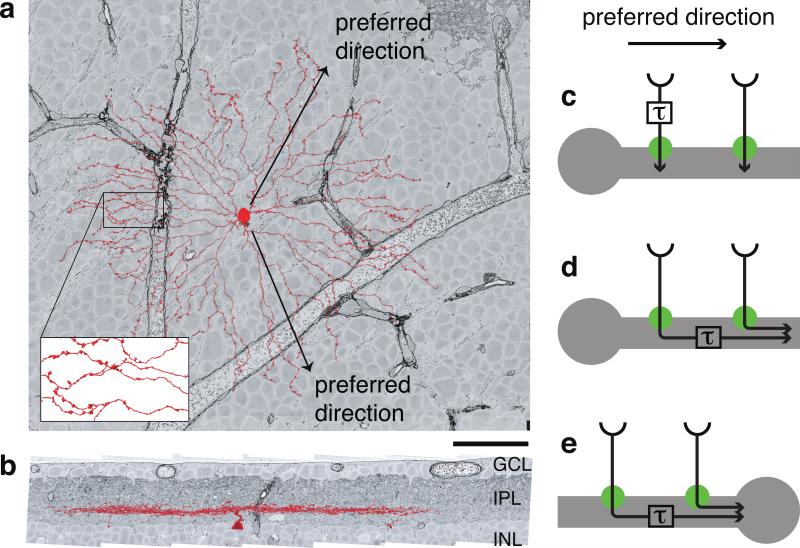
Research on this question has converged upon the starburst amacrine cell (SAC, Figs. 1a, b). A SAC dendrite is more activated by motion outward from the cell body to the tip of the dendrite, than by motion in the opposite direction3. Therefore a SAC dendrite exhibits DS, and outward motion is said to be its “preferred direction.” Note that it is incorrect to assign a single such direction to a SAC, because each of the cell's dendrites has its own preferred direction (Fig. 1a). DS persists after blocking inhibitory synaptic transmission4, when the only remaining inputs to SACs are bipolar cells (BCs), which are excitatory. Since the SAC exhibits DS, while its BC inputs do not5, we say that DS emerges from the BC-SAC circuit.
Figure 1. Starburst amacrine cell and its direction selectivity.
Off SAC (red) viewed opposite (a) and perpendicular (b) to the light axis. GCL, IPL, INL are ganglion cell, inner plexiform, inner nuclear layers. Grayscale images from the e2198 dataset9. Swellings of distal dendrites are presynaptic boutons (inset). Scale bar is 50 μm. c, We hypothesize that a SAC dendrite is wired to pathways with different time lags of visual response. d, A previous model invoked the time lag due to signal conduction in a passive dendrite24. e, The previous model predicts an inward preferred direction for the somatic voltage, contrary to empirical observations3.
Mouse BCs have been classified into multiple types6, with different time lags in visual response7,8. Motion is a spatiotemporal phenomenon: an object at one location appears somewhere else after a time delay. Therefore we wondered whether DS might arise because different locations on the SAC dendrite are wired to BC types with different time lags. More specifically, we hypothesized that the proximal BCs (wired near the SAC soma) lag the distal BCs (wired far from the soma).
Such “space-time wiring specificity” could lead to DS as follows (Fig. 1c). Motion outward from the soma will activate the proximal BCs followed by the distal BCs. If the stimulus speed is appropriate for the time lag, signals from both BC groups will reach the SAC dendrite simultaneously, summing to produce a large depolarization. For motion inward towards the soma, BC signals will reach the SAC dendrite asynchronously, causing only small depolarizations. Therefore the dendrite will “prefer” outward motion, as observed experimentally3.
3D reconstruction by crowd and machine
We tested our hypothesis by reconstructing Off BC-SAC circuitry using e2198, an existing dataset of mouse retinal images from serial block-face scanning electron microscopy (SBEM)9. The e2198 dataset was oversegmented by an artificial intelligence (AI) into groups of neighboring voxels that were subsets of individual neurons. These “supervoxels” were assembled by humans into accurate 3D reconstructions of neurons. For this activity, we hired and trained a small number of workers in the lab, and also transformed work into play by mobilizing volunteers through EyeWire, a web site that turns 3D reconstruction of neurons into a game of coloring serial EM images.
Through EyeWire, we wanted to enable anyone, anywhere, to participate in our research. The approach is potentially scalable to extremely large numbers of “citizen scientists”10. More importantly, the 3D reconstruction of neurons requires highly developed visuospatial abilities, and we wondered whether a game could be more effective11 than traditional methods of recruiting and creating experts.
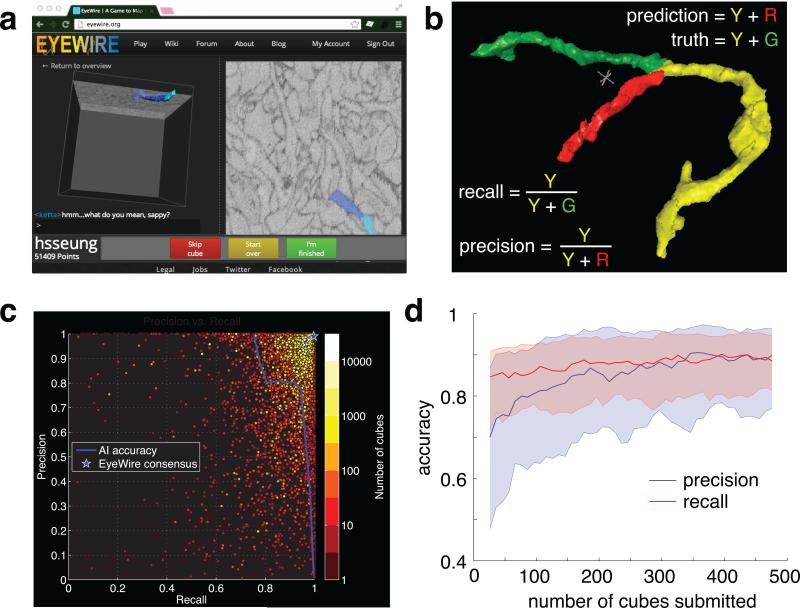
In gameplay mode, EyeWire shows a 2D slice through a “cube,” an e2198 subvolume of 2563 grayscale voxels (Fig. 2a). Gameplay consists of two activities: coloring the image near some location, or searching for a new location to color. Coloring is done by clicking at any location in the 2D slice, which causes the supervoxel containing that location to turn blue. Searching is done by translating and orienting the slice within the cube, and interacting with a 3D rendering of the colored supervoxels.
Figure 2. EyeWire combines crowd and artificial intelligence.
a, 3D and 2D views in the neuron reconstruction game. b, Precision and recall are two measures of accuracy. c, Accuracy of artificial intelligence (AI), 5881 EyeWirers, and EyeWirer consensus on reconstruction of a ganglion cell. d, EyeWirer precision and recall increase with number of cubes submitted. Solid lines are median values across 208 EyeWirers who submitted at least 500 cubes, and shaded regions indicate 25th to 75th percentile.
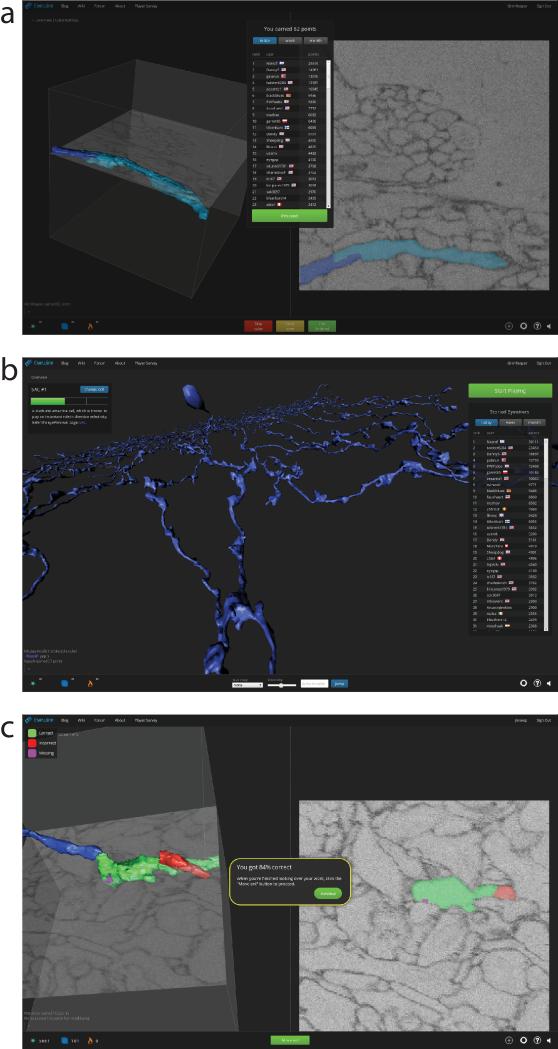
When the player first receives a cube, it already comes with a “seed,” a contiguous set of colored supervoxels. The challenge is to color all the rest of the supervoxels that belong to the same neuron, and avoid coloring other neurons. Gameplay for a cube terminates when the player clicks “Submit,” receives a numerical score (Extended Data Fig. 1a), and proceeds to the next cube. Because our AI is sufficiently accurate, coloring supervoxels is faster than manually coloring voxels, an older approach to 3D reconstruction12.
Extended Data Figure 1. EyeWire screenshots.
a, Numerical score after gameplay of a cube, with leaderboard below. b, Overview mode with neuron under reconstruction (center), global chat (bottom left), progress bar for neuron (upper left), leaderboard (right), settings and help (bottom right). c, Tutorial play.
The scoring system is designed to reward accurate coloring. This is nontrivial because EyeWire does not know the correct coloring. Each cube is assigned to multiple players (typically 5 to 10), and high scores are earned by players who color supervoxels that other players also color. In other words, the scoring system rewards agreement between players, which tends to be the same as rewarding accuracy.
Consensus is used not only to incentivize individual players, but also to enhance the accuracy of the entire system. Any player's coloring is equivalent to a set of supervoxels. Given the colorings of multiple players starting from the same seed in the same cube, a consensus can be computed by voting on each supervoxel. EyeWirer consensus was much more accurate than any individual EyeWirer (Fig. 2b,c).
Coloring a neuron is more challenging than it sounds. Images are corrupted by noise and other artifacts. Neurites take paths that are difficult to predict, and can branch without warning. Careless errors result from lapses in attention. Extensive practice is required to achieve accuracy. The most accurate EyeWirers (Fig. 2c, upper right corner) often had experience with thousands of cubes. Improvements in accuracy were observed over the course of hundreds of cubes, corresponding to tens of hours of practice (Fig. 2d). According to subjective reports of EyeWirers, learning continues for much longer than that. In contrast, previous successes at “crowdsourcing” image analysis involved tasks that did not require such extensive training10,13.
Reconstructing an entire neuron requires tracing its branches through thousands of cubes. This process is coordinated by an automatic spawner, which inspects each consensus cube for branches that exit the cube. Each exit generates a new cube and seed, which are added to a queue. EyeWirers are automatically assigned to cubes by an algorithm that attempts to balance the number of plays for each cube.
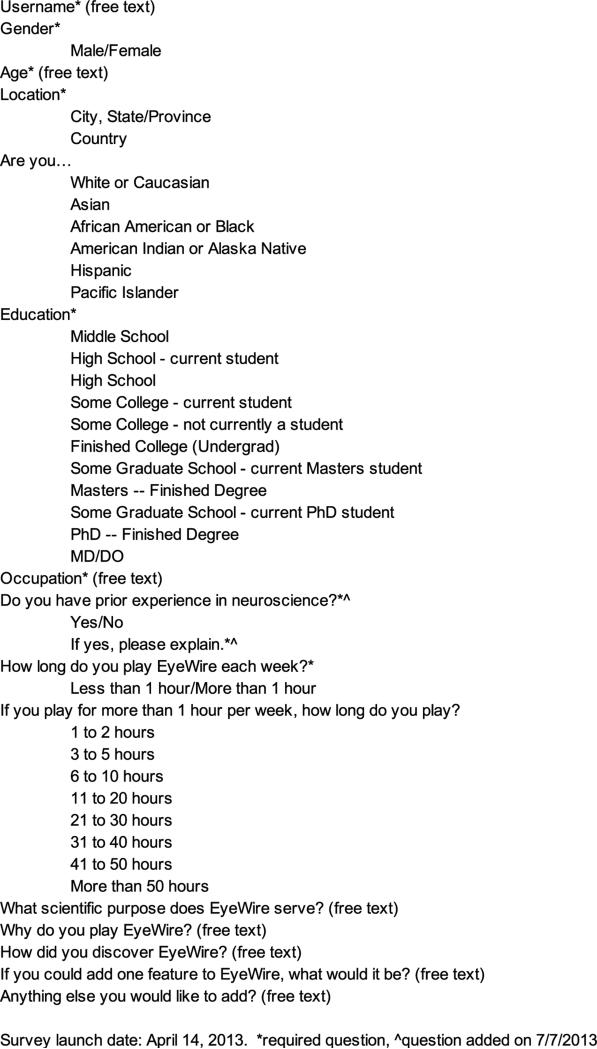
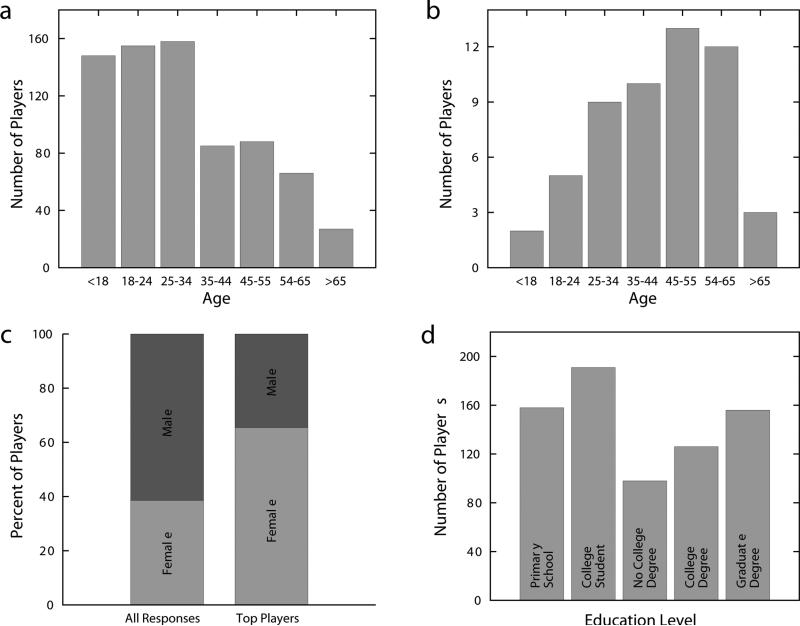
Over 100,000 registered EyeWirers have been recruited by news reports, social media, and the EyeWire blog. Players span a broad range of ages and educational levels, come from over 130 countries, and the great majority have no formal training in neuroscience (Extended Data Figs. 2 and 3; Supplementary Notes). These statistics show that EyeWire indeed widens participation in neuroscience research. At the same time, the most avid players constitute an elite group with disproportionate achievements. For example, the top 100 players have contributed about half of all cubes completed in EyeWire.
Extended Data Figure 2.
Questionnaire administered to EyeWirers.
Extended Data Figure 3. EyeWire demographics.
Data based on 729 responses to the questionnaire in Extended Data Fig. 2. Age distribution of (a) all respondents and (b) those among the top 100 players ranked by number of cubes submitted. c, Gender distribution of all respondents and those among the top 100 players. d, Distribution of educational levels.
Lab workers also reconstructed neurons independently of EyeWire, with a more sophisticated version of the user interface (Methods). Their reconstructions were pooled with those of EyeWirers for the analyses reported below. Reconstruction error was quantified (Methods), and was treated like other kinds of experimental error when calculating confidence intervals from our data.
Contact analysis
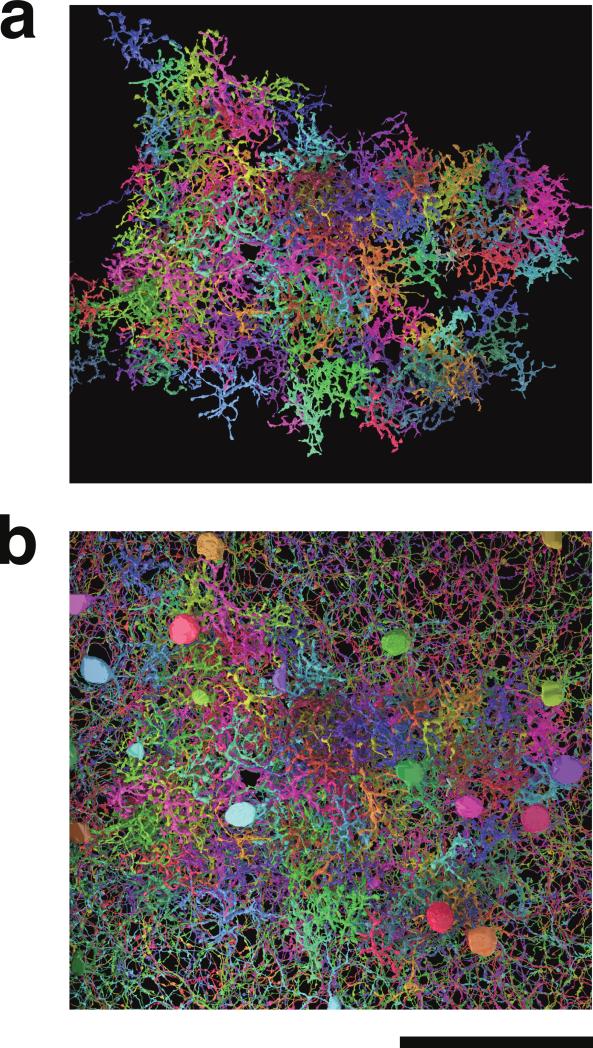
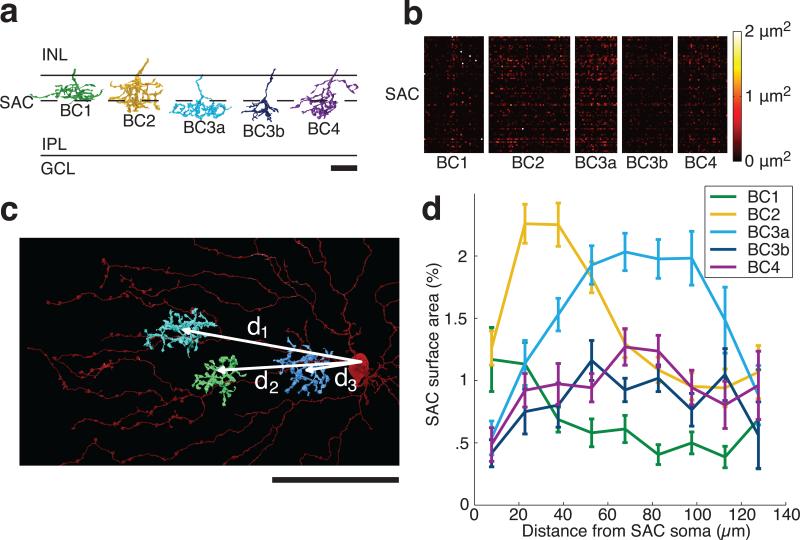
We reconstructed 195 Off BC axons and 79 Off SACs from e2198 (Fig. 3b, Extended Data Fig. 4). The e2198 retina was stained in an unconventional way that did not mark intracellular structures such as neurotransmitter vesicles9, and reliable morphological criteria for identification of BC presynaptic terminals are unknown. As an indirect measure of connectivity, contact areas were computed for all BC-SAC pairs. The resulting “contact matrix” was analyzed through two subsequent steps.
Figure 3. 3D reconstructions of Off BCs and SACs.
Cells viewed opposite the light axis. a, BCs alone. b, BCs with SACs. Scale bar is 50 μm.
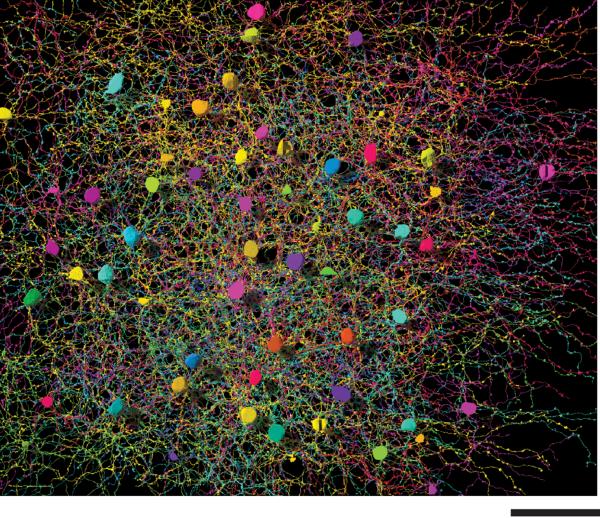
Extended Data Figure 4. Entirety of reconstructed SACs.
Only the central region of this plexus of SAC dendrites is portrayed in Figure 3b. Scale bar is 50 μm.
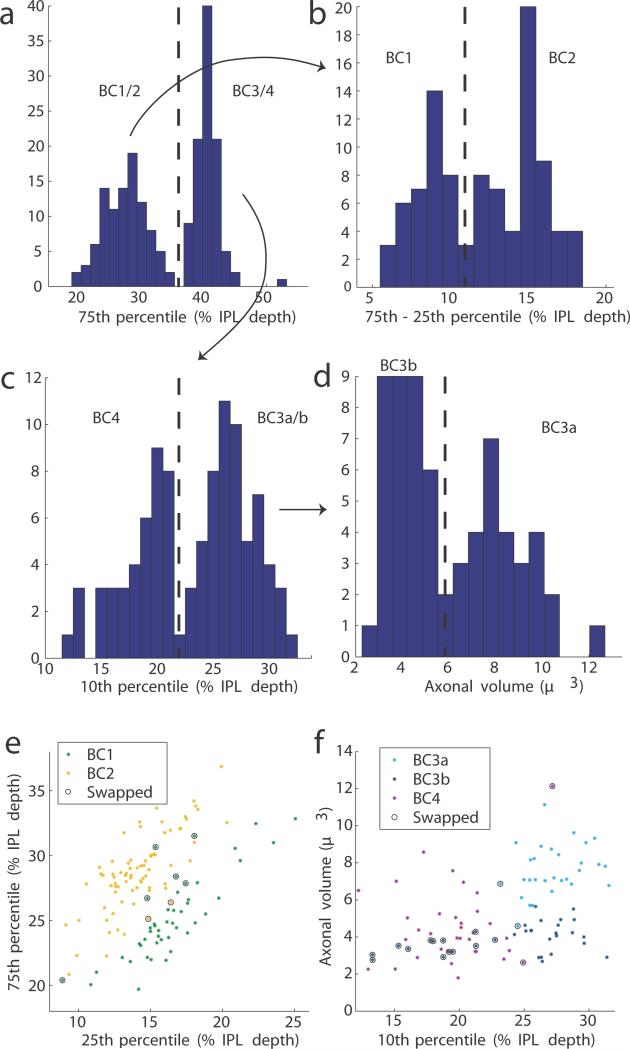
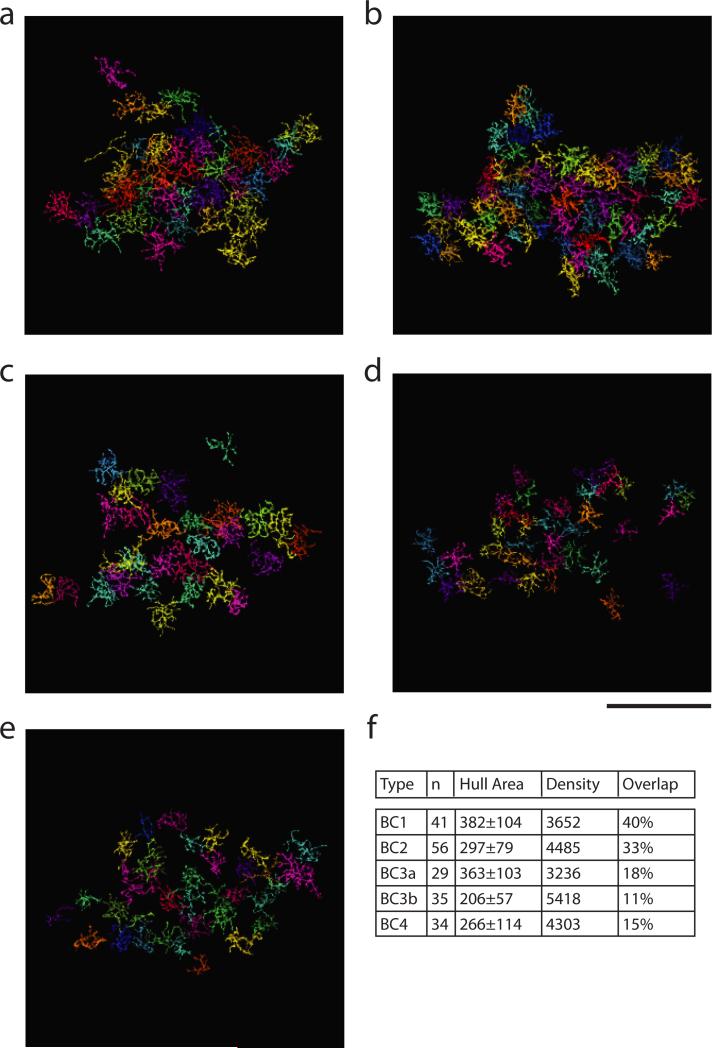
In the first step, Off BC axons were classified into five cell types, following structural criteria14 established to correspond with previous molecular definitions6 (Methods, Extended Data Fig. 5). BC types stratify at characteristic depths in the inner plexiform layer (IPL), and vary in size (Fig. 4a). The BCs of each type formed a “mosaic,” meaning that cells were spaced roughly periodically (Extended Data Fig. 6a-e). This is generally accepted as an important defining property of a retinal cell type. Type densities (Extended Data Fig. 6f) were roughly consistent with previous reports6. When the columns of the contact matrix were sorted by BC type (Fig. 4b), it became evident that BC2 and BC3a contact SACs more than other BC types.
Extended Data Figure 5. Clustering procedure for BCs.
a, Cells were divided by the 75th percentile of their stratification profiles. b, The shallow cluster BC1/2 was separated into BC1 and BC2 using stratification width, defined as the difference between 75th and 25th percentiles. c, The deep cluster BC3/4 was divided by 10th percentile into BC4 and BC3. d, BC3 was divided by axonal volume to yield BC3a and BC3b. Scatter plots of the (e) BC1/2 and (f) BC3/4 divisions show swaps made to eliminate mosaic violations. No swaps between BC1/2 and BC3/4 were needed.
Figure 4. BC-SAC contact.
a, Off BCs were divided into five types6,14, based on IPL depth and size. Scale bar is 10 μm. b, Contact areas of BC-SAC pairs, sorted by BC types. c, Pairs were further sorted by the distance of the BC axon from the SAC soma, as measured in the tangential plane. Scale bar is 50 μm. d, Average BC-SAC contact vs. distance, normalized to percentage of SAC surface area at that distance (Extended Data Fig. 3b). Standard error is based on the number of pairs for each BC type and distance.
Extended Data Figure 6. Mosaics of Off BC types.
Reconstructed BCs of types 1, 2, 3a, 3b, and 4 (a through e, respectively). BC1/2 mosaics appear complete. BC3/4 mosaics show some gaps, probably because some thin axons were missed in the INL (Methods). Scale bar is 50 μm. f, Statistics of BC types. Means and standard deviation of the hull area (area of the convex hull around the cell) are in μm2. Type densities are the number of cells (n) divided by the area of the union of hulls of that cell type, and are in cells/mm2 without compensation for tissue shrinkage (Methods). Our densities resemble those of Wassle et al. (2009), who found 2233, 3212, 1866, 3254, and 3005 cells/mm2.
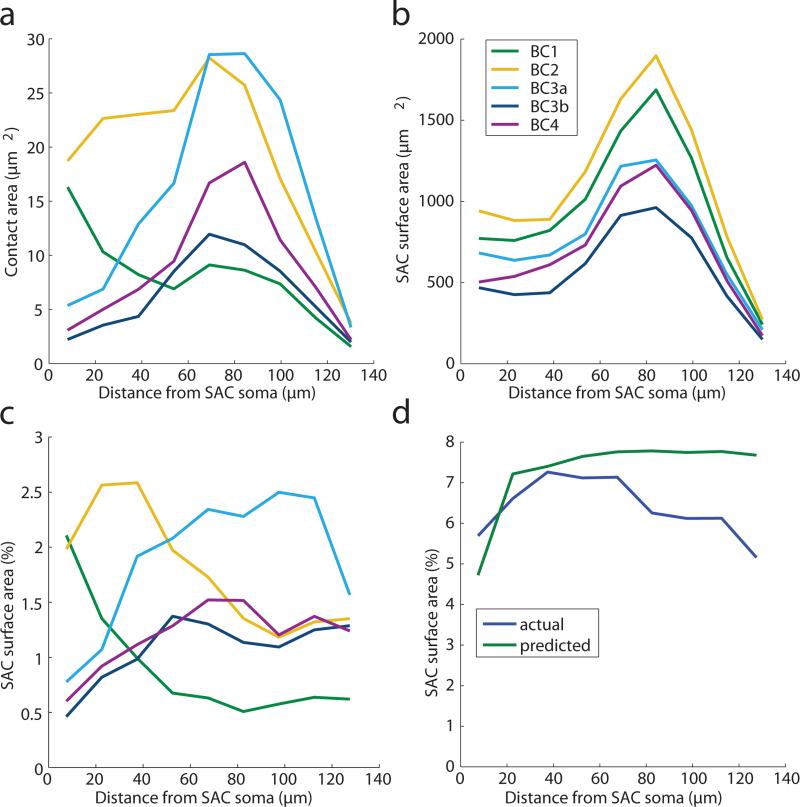
In the second step, we averaged contact area over BC-SAC pairs of the same BC type and similar distance between the BC axon and the SAC soma in the plane tangential to the retina (Fig. 4c). These absolute areas were normalized to convert them into the percentage of SAC surface area covered by BCs of a given type (Methods). The resulting graphs show that BC2 prefers to contact SAC dendrites close to the SAC soma, whereas BC3a prefers to contact far from the soma (Fig. 4d, Extended Data Fig. 7c).
Extended Data Figure 7. Alternative contact analysis.
Analysis based on summing over BC-SAC pairs rather than averaging as in main text. a, Total BC-SAC contact vs. distance from the SAC soma. b, Total SAC area within the union of convex hulls of each BC type versus distance. The peak at 80 μm is the location of maximum dendritic branching. The sharp decrease at larger distances is due to thinning and termination of branches. The graphs differ across BC types, which in our sample do not cover exactly the same retinal areas. c, Fraction of SAC area in contact with BC types, estimated by dividing contact area (a) by SAC area (b). This estimate is similar to that of Figure 4d, but lacks error bars. d, Fraction of SAC area contacted by all BC types, the sum of the contact fractions in (c). Also plotted is the contact predicted by co-stratification, the sum of the curves from Figure 5b.
Imaging of intracellular calcium in BC axons7 and extracellular glutamate around BC axons8 indicate that BC2 lags BC3a in visual responses by 50 to 100 ms. Therefore BC-SAC wiring appears to possess the space-time specificity appropriate for an outward preferred direction, as we hypothesized (Fig. 1c).
Co-stratification analysis
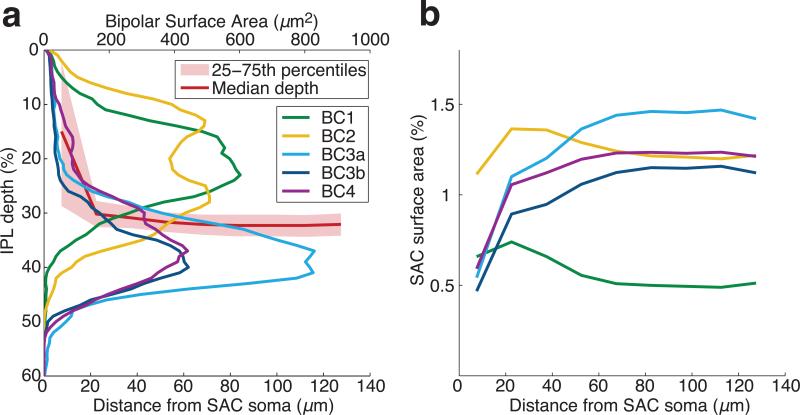
Off SACs stratify at a particular depth in the IPL (Fig. 1b). Why this depth and not some other? From Fig. 4a, it is obvious that this depth is appropriate for wiring with BC2 and BC3a, as required by our model of DS emergence. Following this logic one step further, we wondered whether the observed dependence of contact on distance from the SAC soma might be reflected in fine aspects of SAC morphology. We hypothesized that SAC dendrites are “tilted,” moving deeper into the IPL with distance from the SAC soma. Such a change in depth would be compatible with more overlap with BC2 near the soma, and more overlap with BC3a far from the soma, since BC3a is deeper in the IPL than BC2 (Fig. 4a and Supplementary Video).
The hypothesized tilt turns out to exist (Fig. 5a). Very close to the SAC soma, the dendrites dive sharply into the IPL from the INL. Surprisingly, IPL depth continues to increase as distance from the SAC soma in the tangential plane ranges from 20 to 80 μm. The slight increase is not evident in a single dendrite (Fig. 1b), but emerges from statistical averaging.
Figure 5. BC-SAC co-stratification.
a, SAC dendrites move deeper into the IPL (median depth, red line) with increasing distance from the SAC soma in the tangential plane. Stratification profiles of BC types, defined as density of surface area over the depth of the IPL. b, Co-stratification predictions of BC-SAC contact area vs. distance from the SAC soma. The curves are normalized by SAC area at each distance, and are therefore directly comparable with those of Figure 4d.
Could dendritic tilt be the cause of the observed variation in BC-SAC contact with distance (Fig. 4d)? We cannot address causality based on our data, but we can test how well the tilt predicts contact variation. We computed the stratification profiles of BC types (Fig. 5a), defined as the one-dimensional density of BC surface area along the depth of the IPL. We also computed the stratification profile of SAC dendrites at various distances from the SAC soma (quartiles, Fig. 5a). Assuming that BC and SAC arbors are statistically independent of each other, we estimated contact from “co-stratification,” defined as the integral over IPL depth of the product of BC and SAC stratification profiles (Methods).
We found that actual BC2 contact depends more strongly on distance than predicted; the slight change in IPL depth after the initial plunge appears too small to account for the large change in actual BC2 contact. In other failures of contact prediction, BC3a, BC3b, and BC4 stratify at the same IPL depths (Fig. 5a), yet BC3a makes much more contact than BC3b or BC4. Also, actual BC3a contact plummets near the tips of SAC dendrites (Fig. 4d), while predicted contact does not change at all because the IPL depth of SAC dendrites is constant in this region (Fig. 5b). Overall, the total contact from all BC types seems low in this region (Extended Data Fig. 7d), suggesting that BCs avoid making synaptic inputs to the most distal SAC dendrites. This runs counter to the conventional belief that input synapses are uniformly distributed over the entire length of SAC dendrites15. The unreliability of inferring contact from co-stratification is illustrated by numerous examples of SAC dendrites that pass through BC axonal arbors without making any contact at all (Extended Data Fig. 8).
Extended Data Figure 8. Proximity versus contact.
Neurons that intermingle may or may not contact each other. a, b. Type 2 and 3a BCs (respectively) contacting SACs. The cells are roughly 24 and 21 μm wide. c, d. Other SACs are well within the arbors of the same two BCs, yet make no contact at all.
Model of direction selectivity
Above we mentioned that BC2 lags BC3a in visual response. There is another important difference: BC3a responds more transiently to step changes in illumination, while BC2 exhibits more sustained responses. The implications of the sustained-transient distinction for DS can be understood using a mathematical model. The activity of a retinal neuron is often approximated as a linear spatiotemporal filtering of the visual stimulus followed by a nonlinearity16,17. Such a “linear-nonlinear” model for the output O(t) of the SAC dendrite can be written as
| (1) |
For simplicity, the dendrite and visual stimulus I(x,t) are restricted to a single spatial dimension x, and the nonlinearity is a half-wave rectification, [z]+=max{z,0}. We interpret the integral in Eq. (1) as the summed input from the BCs presynaptic to the SAC. The nonlinearity could arise from various biophysical mechanisms, such as synaptic transmission from SACs to other neurons. The spatiotemporal filter W(x,t) is a sum of two functions,
| (2) |
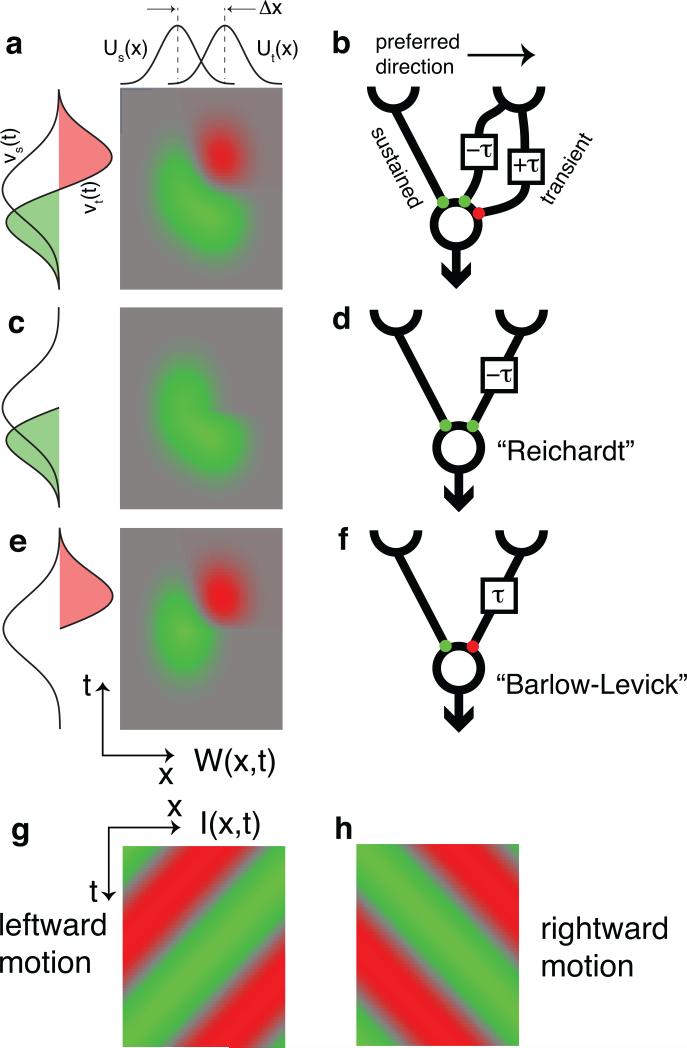
corresponding to contributions from BC2 and BC3a. The sustained temporal filter νs(t) is monophasic, while the transient filter νt(t) is biphasic (Fig. 6a). The spatial filter Us(x) represents the entire set of all BC2 inputs to the dendrite, and can be estimated from the BC2 contact area graph in Figure 4d. Similarly, Ut(x) can be estimated from the BC3a contact area graph. The two spatial filters are displaced relative to each other (Fig. 6a), because BC3a tends to contact SAC dendrites at more distal locations than BC2.
Figure 6. Mathematical model of the BC-SAC circuit.
a, Spatiotemporal filter of Eq. (2). Green is positive, red is negative, and gray is zero. b, The transient pathway effectively combines a positive channel that leads the sustained pathway by τ and a negative channel that lags by τ. c, Removing the negative channel yields a Reichardt detector (d). e, Removing the positive channel yields a Barlow-Levick detector (f). A moving visual stimulus I(x,t) is oriented in space-time (g, h), and so are the spatiotemporal filters (a, c, e).
It is well known that direction selectivity (DS) can be generated by a model like Eqs. (1) and (2), which is based on the sum of two space-time separable filters18,19. This is illustrated by Fig. 6 using the fact that the convolution in Eq. (1) is equivalent to “sliding” the spatiotemporal filter W in time over the stimulus I, and computing the overlap at each time. The filter W(x,t) is oriented in space-time (Fig. 6a), and so also is a moving stimulus I(x,t) (Fig. 6g,h). The overlap with a rightward-moving stimulus (Fig. 6h) is greater than for a leftward one (Fig. 6g), so the model is DS, and rightward is the preferred direction.
How is DS affected by the biphasic shape of the transient temporal filter, νt(t)? If we remove the negative lobe (Fig. 6c), then νt(t) will become monophasic like νs(t) and their relation closer to a simple time lag (Fig. 6d). We will refer to this model as a “Reichardt detector,” in honor of the pioneering researcher Werner Reichardt, although it more closely resembles a subunit of his model20. On the other hand, removing the positive lobe of νt(t) makes it monophasic but with inverted sign relative to the sustained filter (Fig. 6e). The result (Fig. 6f) resembles a DS model originally proposed by Barlow and Levick21.
Both modified models (Figs. 6d,f) exhibit DS. In the Reichardt detector, the inputs from the two arms enhance each other for motion in the preferred direction. In the Barlow-Levick detector, the two inputs cancel each other for motion in the null direction. Since our sustained-transient model (Fig. 6b) employs both mechanisms, it should exhibit more DS than either detector. Our model is related to versions of the Reichardt detector with low-pass and high-pass filters on the two arms22.
In the original Barlow-Levick model, the negative filter corresponded to synaptic inhibition. Since BCs are believed to be excitatory, negative BC input in our model represents a reduction of excitation relative to the resting level, rather than true inhibition. Signaling by reduced excitation may be possible, at least for low contrast stimuli, as BC ribbon synapses may have a significant resting rate of transmitter release23.
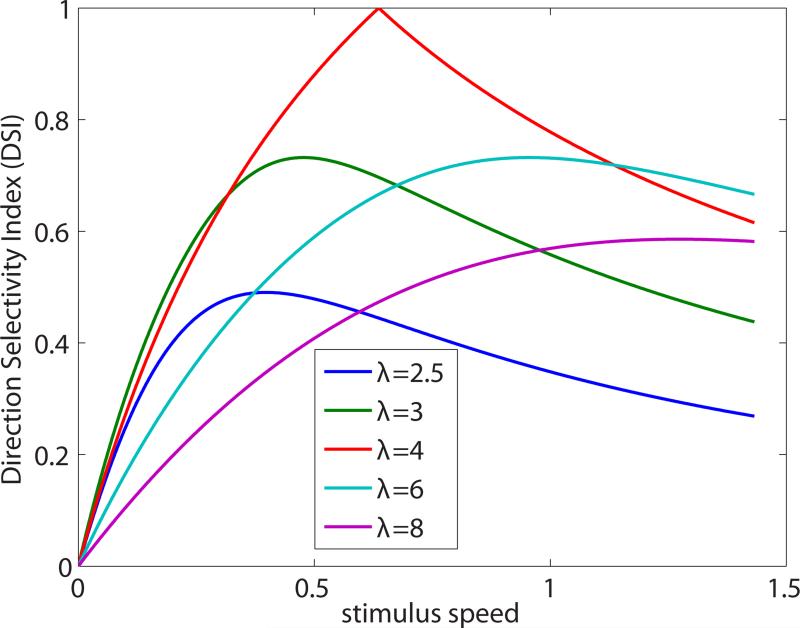
The model of Eqs. (1) and (2) is a useful starting point for many theoretical investigations that are outside the scope of this article. For example, DS dependences on the spatial and temporal frequency of a sinusoidal traveling wave stimulus are calculated in the Supplementary Equations, and DS dependence on stimulus speed is graphed in Extended Data Figure 9.
Extended Data Figure 9. Model direction selectivity index (DSI) versus stimulus speed.
The graphs are for traveling sine waves of various wavelengths λ (units of Δx). Speed is in units of Δx/τ. The preferred speed (horizontal location of each peak) is λ/(2π). Note that responses are cut off at high speeds by the temporal filters of the model, but the DSI can decay more slowly.
Discussion
In our DS model, SAC dendrites are wired to BC types with different time lags. A previous model did not distinguish between BC types, and instead relied on the time lag of signal conduction within the SAC dendrite itself24 (Fig. 1d). Like most other amacrine cells, SACs lack an axon; their output synapses are found in the distal zones of their dendrites15 (Fig. 1a, inset). Due to dendritic conduction delay, proximal BC inputs should take longer to reach the output synapses than distal BC inputs (Fig. 1d). Therefore this time lag is also consistent with the empirical finding of an outward preferred direction. To summarize the novelty of our hypothesis, we place the time lag before BC-SAC synapses, whereas the previous model places it after BC-SAC synapses.
The postsynaptic delay model has a major weakness. If dendritic conduction were the only source of time lag, the somatic voltage would exhibit DS with an inward preferred direction, but this is inconsistent with intracellular recordings3 (Fig. 1e). In contrast, the presynaptic delay model is compatible with approximating an SAC dendrite as isopotential (Fig. 1c), so preferred direction is predicted to be independent of the location of the voltage measurement, consistent with empirical data3. It may also be possible to make the postsynaptic delay model consistent with experiments by adding active dendritic conductances4.
The presynaptic and postsynaptic delay models are not mutually exclusive. If they work together, passive cable theory suggests that presynaptic delay dominates, because estimated postsynaptic delay is much shorter than the time lag between BC2 and BC3a (Supplementary Equations). Can we gauge the relative importance of the delays empirically rather than theoretically? One way would be intracellular recording at the SAC soma of responses to visual stimulation at various dendritic locations. If postsynaptic delay dominates, then response latency will grow with distance of the visual stimulus from the soma. If presynaptic delay dominates, then distal stimulation will evoke somatic responses with shorter latency than proximal stimulation. This prediction may seem counterintuitive, but is an obvious outcome of our model.
Many other models of DS emergence in SACs invoke inhibition as well as excitation25-28. We have focused on excitatory mechanisms, as blocking inhibition does not abolish DS3. However, inhibition may have the effect of enhancing DS, and its role should be investigated further.
This work focused on Off BC-SAC circuitry. An analogous sustained-transient distinction can also be made for On BC types7,8. It remains to be seen whether their connectivity with On SACs depends on distance from the soma. If this turns out to be the case, then the model of Figure 6 could serve as a general theory of motion detection by both On and Off SACs. The model filter of Figure 6a also resembles the spatiotemporal receptive field of the J type of ganglion cell (Fig. 3b of Ref. 29).
Neural activity imaging30 and connectomic analysis31 have recently identified a plausible candidate for the site of DS emergence in the fly visual system. If our theory is correct, then the analogies between insect and mammalian motion detection1 are more far-reaching than previously suspected, with fly T4 and T5 cells corresponding to On and Off SAC dendrites in both connectivity and function.
A glimmer of space-time wiring specificity can even be seen in the structure of the SAC itself. Since BC types with different time lags arborize at different IPL depths, IPL depth can be regarded as a time axis. Therefore, the slight tilt of the SAC dendrites in the IPL (Fig. 5a) could be related to the orientation of the SAC receptive field in space-time (Fig. 6a). However, dendritic tilt alone is not sufficient to predict our model, as co-stratification sometimes fails to predict contact (Figs. 4d, 5b). For example, co-stratification predicts strong BC4 connectivity to distal SAC dendrites. This would favor an inward preferred direction, contrary to what is observed, because BC2 leads (not lags) BC4 in visual responses7.
The idea that contact (or connectivity) can be inferred from co-stratification is sometimes known as Peters’ Rule32, and has also been applied to estimate neocortical connectivity33-35. The present work shows that fairly subtle violations of Peters’ Rule may be important for visual function. Previous research suggests that On-Off direction selective ganglion cells (DSGCs) inherit their DS from SAC inputs due to a strong violation of Peters’ Rule9,36-38.
Our findings were made possible by using AI to reduce the amount of human effort required for 3D reconstruction of neurons. Even after the labor savings, our research required great human effort from a handful of paid workers in the lab and a large number of volunteers through EyeWire. Our experiences do not support claims that the “wisdom of the crowd” should replace experts39. Instead, EyeWire depends on cooperation between lab experts and online amateurs (Methods). Furthermore, some amateurs developed remarkable expertise and were promoted to increasingly sophisticated roles within the EyeWire community (Supplementary Notes). We believe that crowd wisdom requires amplifying the expert voices within the crowd, and also empowering individuals to become experts. Fortunately, such goals are well-matched to the game format.
The EyeWire AI was based on a deep convolutional network40,41. Similar networks have been successfully applied to serial EM images obtained using conventional staining techniques that mark intracellular organelles42. Extending EyeWire to such images, in which synapses are clearly visible, would enable a true connection analysis that goes beyond the contact and co-stratification analyses employed here.
Our work demonstrates that reconstructing a neural circuit can provide surprising insights into its function. Much more will be learned as reconstruction speed grows. The combination of crowd and artificial intelligence promises a continuous upward path of improvement, as human input from the crowd is not only useful for generating neuroscience discoveries, but also for making the AI more capable through machine learning.
Methods
We worked with the e2198 dataset9 rather than the e2006 dataset14 because e2198 is large enough to encompass entire SAC dendrites (~150 μm). All dimensions are uncorrected for tissue shrinkage, which was previously estimated at 14% by comparison of two-photon and serial EM images14.
Machine learning
The boundaries between neurons in subvolumes of the e2198 and e2006 datasets were manually traced. Using this as ground truth, a convolutional network (CN) was trained to detect boundaries between neurons using the MALIS method40. The CN had the same architecture as one used previously14, and produced as output an affinity graph connecting nearest neighbor voxels41. Any subvolume of e2198 could be oversegmented by applying a modified watershed algorithm to the appropriate subgraph. The regions of the oversegmentation are called supervoxels.
Reconstruction by workers
A team of part-time workers, numbering about half a dozen at any given time, reconstructed neurons using a more sophisticated version of the EyeWire interface. Workers were hired based on an interview and a test of software use passed by 3/4 of the applicants. They were trained for 40 to 50 hours before generating reconstructions used for research. Their skills typically improved for months or even years after the initial training period, and were superior to those of professional neuroscientists without reconstruction experience.
As with EyeWire, the task of reconstructing an entire neuron was divided into subtasks, each of which involved reconstructing the neuron within a subvolume starting from a supervoxel “seed.” However, the subvolumes were roughly 100 times larger than EyeWire cubes, and only two workers were assigned to each subvolume.
In the first stage of error correction, disagreements were detected by computer, and resolved by one of the two workers, or a third worker. The third occasionally detected and corrected errors that were not disagreements between the first two. Most disagreements were the result of careless errors, and were easily resolved. More rarely, there were disagreements caused by fundamental ambiguities in the image. These locations were noted for later examination in a further stage of error correction.
This second stage relied on 3D reconstructions of entire neurons assembled from multiple subvolumes and inspected by one of the authors (J.S.K.). Suspicious branches or terminations, as well as overlaps between reconstructions of different neurons were detected. The original image was reexamined at these locations to check for errors. The process was repeated until no further errors could be detected.
The precision of our final reconstruction relative to the truth is probably comparable to the precision of the penultimate reconstruction relative to the final reconstruction, 0.99 for SACs and 0.96 for BCs. Recall is likely somewhat poorer, because missing branches are more difficult to detect than superfluous branches. Recall must be reasonably good for SACs, as missing branches would be detected by deviations from the typical SAC shape and radius.
Reconstruction by EyeWirers
Some reconstruction errors slip past the consensus mechanism. These are detected through visual inspection of an “overview” mode, which displays 3D renderings of entire neurons currently under reconstruction (Extended Data Fig. 1b). False branches become obvious once they are long enough, and are reported by EyeWirers through chat or email. They are chopped off by GrimReaper, a special EyeWirer played by lab experts endowed with the superpower of overruling the consensus. GrimReaper also extends branches that have terminated prematurely. Correction by GrimReaper is similar to the second stage of error correction described above, so the final reconstruction presumably has similar accuracy.
SAC reconstructions are extremely difficult for two reasons: (1) SAC dendrites are very thin and may falsely appear to terminate, due to limited spatial resolution and imperfect staining, and (2) the interiors of many SAC boutons contained irregular darkenings, which could falsely appear like cellular boundaries. (The reason for the darkening is unclear, as the extracellular staining procedure was not intended to mark intracellular structures.)
Novices tend to prematurely terminate SAC dendrites. Experts know that most cubes do not contain termination points, and therefore try harder to find continuations, employing a variety of sophisticated search strategies. GrimReaper is also allowed to view how the cube fits into the entire reconstructed neuron. This additional spatial context can be used to disambiguate difficult cubes, given knowledge of the typical appearance of a SAC.
Before learning in normal gameplay (Fig. 2d), all EyeWirers are required to go through a training session immediately after registering for the site. This consists of a sequence of tutorial cubes, each of which was previously colored by an expert (Extended Data Fig. 1c). Each cube teaches through instructions and per-click feedback about accuracy based on comparing the EyeWirer's selections with those of the expert. After submitting a tutorial cube, the EyeWirer is given a chance to view mistakes.
Accuracy is monitored on a weekly basis by computing the precision and recall of each EyeWirer with respect to the truth, defined as neuron reconstructions based on EyeWire consensus followed by GrimReaper corrections. Less accurate EyeWirers are given less weight in the vote.
Players’ daily, weekly, and monthly scores are publicly displayed on a leaderboard (Extended Data Fig. 1b, right), motivating players to excel through competition. Players communicate with each other through online “chat” (Extended Data Fig. 1b, left) and discussion forums.
A “beta test” version of EyeWire was deployed in February 2012, and attracted a small group of users, who helped guide software development. EyeWire officially launched in December 2012.
Reconstruction of Off SACs
Off SACs were recognized by their somata in the INL, narrow IPL stratification at roughly one third of the depth from the INL to the ganglion cell layer (GCL), and characteristic “starburst” appearance (Fig. 1a).
Off SACs were reconstructed by (1) forward tracing from the soma to dendritic tips and (2) backward tracing from varicosities on candidate SAC dendrites to the soma. In the forward method, a candidate SAC soma was identified as a supervoxel with a characteristic pattern of dendritic stubs bearing spiny protrusions. By the time reconstruction progressed to approximately half of the average SAC radius, an Off SAC could be conclusively recognized by its starburst shape and narrow stratification at the appropriate IPL depth. More than 90% of candidates turned out to be SACs.
In the backward method, we located a thin dendrite with varicosities at the appropriate IPL depth. This was reconstructed back to the soma, and then the rest of the dendrites were reconstructed from the soma to the tips. The cell could be discarded at any point during this process, if its dendrites escaped from the appropriate IPL depth or failed to exhibit the proper morphological characteristics. Less than 25% of initial candidates ended up confirmed as SACs.
In total, 79 Off SACs were reconstructed, 39 by forward tracing and 52 by backward tracing. This is more than half the entire population in e2198, judging from the published density44. After candidates were identified by one of the authors (J.S.K.), reconstructions were performed by lab workers (59 cells) or by EyeWirers (29 cells). Overlapping numbers (12 for forward/backward, 9 for workers/EyeWirers) mean the combination of the two.
In March 2012, lab workers began reconstruction of SACs. In March 2013, EyeWirers were invited to the “Starburst Challenge,” a sequence of tutorial cubes drawn from SACs. Those who passed with sufficient accuracy were an elite group allowed to reconstruct SACs (Supplementary Information). EyeWirers eventually shouldered most of the burden of SAC reconstruction, with only 8% of SAC cubes needing correction by GrimReaper. This enabled lab workers to shift their focus to BCs, as described below.
Reconstruction of Off BCs
The somata of Off BCs were generally outside e2198, which extended only partially into the INL (Fig. 1 of Ref. 9). The trunks of candidate BC axons were located in the interstices of the INL, and followed into the IPL. If the axons arborized in the Off region of the INL, they were fully reconstructed. Cells that violated known BC structures were identified as amacrine cells and discarded14.
BC axons were difficult to reconstruct due to poor staining, and their highly irregular shapes. They could not be accurately reconstructed (either by online volunteers or lab experts) within the 2563 cubes of EyeWire, which were too small to provide sufficient spatial context. Therefore BCs were reconstructed only by lab workers using the large subvolumes mentioned above.
Coordinate system
For more precise quantification of structural properties, a new coordinate system was defined by applying a nonlinear transformation to neurons so as to flatten the IPL and make it perpendicular to one of the coordinate axes. The nonlinear transformation was found by the following steps. First a global planar approximation to the Off SAC surface was computed. Then the centroid of all the SACs was projected onto this global plane to define the origin of the coordinate system. The projection was along the coordinate axis of the e2198 volume closest in direction to the light axis.
To correct for curvature, an azimuthal equidistant projection45 of the Off SAC surface onto the global plane was made about the origin. Then local planar approximations to the SAC surface were computed in the neighborhoods of every node in a triangular lattice. At each point in a triangle, the SAC surface was approximated by computing the mean of the planar approximations (as quaternions with yaw constrained to be zero) for the triangle's vertices, weighted by distance of the point from the vertices.
The Off SACs were defined as 32% IPL depth. We also reconstructed a few On SACs, and defined them as 62%. These choices placed the edge of the INL at 0%. Structural properties of all cells were computed based on the locations of their surface voxels after transformation into the new coordinates.
Classification of Off bipolar cells
BC stratification profiles were computed by dividing surface voxels into 100 bins spanning 0 to 100% IPL depth. Classification into cell types was done by using methods similar to those described previously14. The BCs were split into shallow (BC1/2) and deep (BC3/4) clusters using the 75th percentile depth of the stratification profile. The BC1/2 cluster was further subdivided into two clusters by stratification width, defined as the difference between 75th and 25th percentile depths. Based on cells per square millimeter (Extended Data Fig. 6f), we inferred that the wider cluster was BC2 and the narrower cluster was BC1. These two types were originally defined by molecular criteria6, and our inferred correspondence with structural definitions is transposed relative to a previous report14. The BC3/4 cluster was subdivided into BC4 and BC3 by the 10th percentile depth, because the molecularly defined BC4 stratifies closer to the INL6. Finally, BC3 was subdivided into BC3a and BC3b based on axonal arbor volume, with BC3a having the larger axonal volume. Each of the above subdivision steps was based on a feature with a roughly bimodal histogram (Extended Data Fig. 5).
The result still contained a small number of classification errors, detected when adjacent BCs of the same type overlapped enough to violate the mosaic property. Corrections were made by an automatic algorithm that greedily swapped cells from one cluster to another such that the total overlap between convex hulls of cells of a given type was minimized. Two swaps were vetoed by an expert (J.S.K) on the basis of morphological features. In all, six cells were swapped within BC1/2 and 13 within BC3/4. In the final classification, 41, 56, 29, 35, and 34 BCs were identified as types 1, 2, 3a, 3b, and 4, respectively (Extended Data Fig. 6). Cells that violated the mosaic of all types (7) or had irregular stratification profiles (9) were discarded as possible reconstruction errors or amacrine cells.
Contact analysis
Edges of the affinity graph connecting BC with SAC voxels were defined as BC-SAC contact edges. For each pair, the sum of the edges yielded an estimate of contact area. The Euclidean distance separating each BC-SAC pair was computed after projecting their centers onto the SAC plane. Centers of SAC somata were manually annotated, and centers of BC arbors were computed as the centroids of their surface voxels. The pairs were binned by distance of the BC from the SAC soma. For every pair in a bin, the fraction of SAC surface area devoted to BC-SAC contact within the convex hull of the BC was computed as the ratio of BC-SAC contact edges to SAC surface edges within the convex hull. The latter was estimated by the number of SAC surface voxels multiplied by a geometric conversion factor of 1.4 SAC surface edges per surface voxel. (This factor was estimated by dividing the total number of SAC surface edges by the total number of SAC surface voxels in the volume.) BC-SAC pairs with fewer than 10,000 SAC surface voxels inside the hull were excluded from the computation to reduce the effect of fluctuations. The ratios for BCs of the same type were averaged for each distance bin and multiplied by a mosaic overlap factor to yield the values in Figure 4d. The mosaic overlap factor represents the extent to which neighboring convex hulls overlap one another, which varies by cell type. This factor was computed by dividing the sum of the hull areas for each cell by the area of the union of hulls for each cell type. For absolute rather than fractional areas, edges in the affinity graph were converted to area in μm2, using the conversion factor of 291.5 μm2 per edge. This factor averages over the different edge orientations and compensates for voxelization effects. A result very similar to Figure 4d can also be obtained by an alternative method that is simpler but does not yield error bars (Extended Data Figure 7c).
Co-stratification analysis
All SAC surface voxels were binned by distance from the soma center in the SAC plane. Within each bin, the stratification profile was computed as for the BCs. The quartiles (median and 25th and 75th percentiles) are graphed in Figure 5a. The prediction of contact from co-stratification is based on the following formalism.
We define the arbor density ρa(r) as the surface area per unit volume at location r of a type a cell with soma centered at the origin. Its integral is the total surface area of the arbor. We assume that the contact density received by one cell of type a from all cells of type b is equal to
| (3) |
The sum over the b mosaic can be approximated by a function that is independent of x and y,
| (4) |
where σb is the number of type b neurons per retinal area and
| (5) |
is the stratification profile of a cell of type b. The SAC arbor density is assumed radially symmetric, , where ρSAC(r) can be regarded (up to normalization) as the SAC stratification profile as a function of distance from the SAC soma. Integrating the contact density (3) and normalizing yields the fraction ϕb(r) of SAC area contacted by cell type b as a function of r,
| (6) |
Supplementary Material
Acknowledgements
This research was made possible by funding from the Gatsby Charitable Foundation, the Howard Hughes Medical Institute, the Human Frontier Science Program, an anonymous donor, and the National Institutes of Health. K.L was supported by a Samsung Scholarship. Support from the AWS Research Grants Program gave EyeWire global reach through Amazon Cloudfront. We thank K. Briggman for providing the e2198 dataset. J. Mutch created the CNS framework on which CNPKG is based. D. Jia, R. Shearer, and B. Warne assisted in early stages of software development, and W. Silversmith with recent modifications. R. Prentki, L. Trawinski, M. Sorek, A. Ostojic, C. David, R. Avery, S. Temple, A. Bost, M. Greenstein, and M. Evans worked in the lab to reconstruct neurons, and the first six also served as GrimReaper and hosted EyeWire competitions. Additional reconstructions were provided by R. Han, M. Gavrin, G. Lu, A. Ortiz, and D. Udvary. All were trained by R. Prentki, who also created training videos for EyeWirers. We are grateful to A. Norton for 3D renderings, and to E. Almeida for EyeWire graphics. We acknowledge helpful discussions with T. Baden, M. Berry, B. Borghuis, A. Borst, E. J. Chichilnisky, D. Chklovskii, D. Clark, J. Demb, T. Euler, M. Helmstaedter, A. Huberman, S. Lee, R. Masland, J. Sanes, and Z. Zhou.
Footnotes
Author contributions
J.S.K. created algorithms, software, and procedures for crowd intelligence and learning, and applied them to generate neuron reconstructions. J.S.K. and M.J.G. classified bipolar cells. M.J.G. analyzed contact and co-stratification, aided by code from A.Z. and input from W.D. H.S.S. devised the model with help from B.F.B. and M.C. S.C.T. trained the convolutional network. M.P. and M.B. implemented software and algorithms created by A.Z. for interactive segmentation and 3D visualization, with guidance from S.C.T. M.R. created the EyeWire game and M.B. its data infrastructure. K.L. quantified EyeWirer accuracy and learning. A.R. mobilized and studied the EyeWire community. EyeWirers reconstructed neurons and built extensions to EyeWire. H.S.S. wrote the paper with help from J.S.K., M.J.G, and A.R.
Supplementary Information is linked to the online version of the paper at www.nature.com/nature.
References
- 1.Borst A, Euler T. Seeing things in motion: models, circuits, and mechanisms. Neuron. 2011;71:974–94. doi: 10.1016/j.neuron.2011.08.031. [DOI] [PubMed] [Google Scholar]
- 2.Vaney DI, Sivyer B, Taylor WR. Direction selectivity in the retina: symmetry and asymmetry in structure and function. Nat. Rev. Neurosci. 2012;13:194–208. doi: 10.1038/nrn3165. [DOI] [PubMed] [Google Scholar]
- 3.Euler T, Detwiler PB, Denk W. Directionally selective calcium signals in dendrites of starburst amacrine cells. Nature. 2002;418:845–52. doi: 10.1038/nature00931. [DOI] [PubMed] [Google Scholar]
- 4.Hausselt SE, Euler T, Detwiler PB, Denk W. A dendrite-autonomous mechanism for direction selectivity in retinal starburst amacrine cells. PLoS Biol. 2007;5:e185. doi: 10.1371/journal.pbio.0050185. [DOI] [PMC free article] [PubMed] [Google Scholar]
- 5.Yonehara K, et al. The first stage of cardinal direction selectivity is localized to the dendrites of retinal ganglion cells. Neuron. 2013;79:1078–85. doi: 10.1016/j.neuron.2013.08.005. [DOI] [PubMed] [Google Scholar]
- 6.Wässle H, Puller C, Müller F, Haverkamp S. Cone contacts, mosaics, and territories of bipolar cells in the mouse retina. The Journal of Neuroscience. 2009;29:106–117. doi: 10.1523/JNEUROSCI.4442-08.2009. [DOI] [PMC free article] [PubMed] [Google Scholar]
- 7.Baden T, Berens P, Bethge M, Euler T. Spikes in mammalian bipolar cells support temporal layering of the inner retina. Curr Biol. 2013;23:48–52. doi: 10.1016/j.cub.2012.11.006. [DOI] [PubMed] [Google Scholar]
- 8.Borghuis BG, Marvin JS, Looger LL, Demb JB. Two-photon imaging of nonlinear glutamate release dynamics at bipolar cell synapses in the mouse retina. J Neurosci. 2013;33:10972–85. doi: 10.1523/JNEUROSCI.1241-13.2013. [DOI] [PMC free article] [PubMed] [Google Scholar]
- 9.Briggman KL, Helmstaedter M, Denk W. Wiring specificity in the direction-selectivity circuit of the retina. Nature. 2011;471:183–8. doi: 10.1038/nature09818. [DOI] [PubMed] [Google Scholar]
- 10.Lintott C, et al. Galaxy Zoo: morphologies derived from visual inspection of galaxies from the Sloan Digital Sky Survey. Monthly Notices of the Royal Astronomical Society. 2008;389:1179–1189. [Google Scholar]
- 11.Cooper S, et al. Predicting protein structures with a multiplayer online game. Nature. 2010;466:756–60. doi: 10.1038/nature09304. [DOI] [PMC free article] [PubMed] [Google Scholar]
- 12.Fiala JC. Reconstruct: a free editor for serial section microscopy. J Microsc. 2005;218:52–61. doi: 10.1111/j.1365-2818.2005.01466.x. [DOI] [PubMed] [Google Scholar]
- 13.Von Ahn L, Dabbish L. Proceedings of the SIGCHI conference on human factors in computing systems. ACM; 2004. Labeling images with a computer game. pp. 319–326. [Google Scholar]
- 14.Helmstaedter M, et al. Connectomic reconstruction of the inner plexiform layer in the mouse retina. Nature. 2013;500:168–74. doi: 10.1038/nature12346. [DOI] [PubMed] [Google Scholar]
- 15.Famiglietti EV. Synaptic organization of starburst amacrine cells in rabbit retina: analysis of serial thin sections by electron microscopy and graphic reconstruction. J Comp Neurol. 1991;309:40–70. doi: 10.1002/cne.903090105. [DOI] [PubMed] [Google Scholar]
- 16.Berry MJ, II, Meister M. Refractoriness and neural precision. J Neurosci. 1998;18:2200–11. doi: 10.1523/JNEUROSCI.18-06-02200.1998. [DOI] [PMC free article] [PubMed] [Google Scholar]
- 17.Baccus SA, Meister M. Fast and slow contrast adaptation in retinal circuitry. Neuron. 2002;36:909–19. doi: 10.1016/s0896-6273(02)01050-4. [DOI] [PubMed] [Google Scholar]
- 18.Watson AB, Ahumada AJ., Jr. Model of human visual-motion sensing. J Opt Soc Am A. 1985;2:322–41. doi: 10.1364/josaa.2.000322. [DOI] [PubMed] [Google Scholar]
- 19.Adelson EH, Bergen JR. Spatiotemporal energy models for the perception of motion. J Opt Soc Am A. 1985;2:284–99. doi: 10.1364/josaa.2.000284. [DOI] [PubMed] [Google Scholar]
- 20.Reichardt W. Autocorrelation, a principle for the evaluation of sensory information by the central nervous system. Sensory communication. 1961:303–317. [Google Scholar]
- 21.Barlow HB, Levick WR. The mechanism of directionally selective units in rabbit's retina. J Physiol. 1965;178:477–504. doi: 10.1113/jphysiol.1965.sp007638. [DOI] [PMC free article] [PubMed] [Google Scholar]
- 22.Borst A, Reisenman C, Haag J. Adaptation of response transients in fly motion vision. II: Model studies. Vision Res. 2003;43:1309–22. doi: 10.1016/s0042-6989(03)00092-0. [DOI] [PubMed] [Google Scholar]
- 23.Lagnado L, Gomis A, Job C. Continuous vesicle cycling in the synaptic terminal of retinal bipolar cells. Neuron. 1996;17:957–67. doi: 10.1016/s0896-6273(00)80226-3. [DOI] [PubMed] [Google Scholar]
- 24.Tukker JJ, Taylor WR, Smith RG. Direction selectivity in a model of the starburst amacrine cell. Visual neuroscience. 2004;21:611–625. doi: 10.1017/S0952523804214109. [DOI] [PubMed] [Google Scholar]
- 25.Borg-Graham LJ, Grzywacz NM. Single neuron computation, chap. Vol. 13. Academic San Diego; 1992. A model of the directional selectivity circuit in retina: transformations by neurons singly and in concert. pp. 347–76. [Google Scholar]
- 26.Gavrikov KE, Dmitriev AV, Keyser KT, Mangel SC. Cation–chloride cotransporters mediate neural computation in the retina. Proc Natl Acad Sci U S A. 2003;100:16047–52. doi: 10.1073/pnas.2637041100. [DOI] [PMC free article] [PubMed] [Google Scholar]
- 27.Münch TA, Werblin FS. Symmetric interactions within a homogeneous starburst cell network can lead to robust asymmetries in dendrites of starburst amacrine cells. J Neurophysiol. 2006;96:471–7. doi: 10.1152/jn.00628.2005. [DOI] [PubMed] [Google Scholar]
- 28.Lee S, Zhou ZJ. The synaptic mechanism of direction selectivity in distal processes of starburst amacrine cells. Neuron. 2006;51:787–99. doi: 10.1016/j.neuron.2006.08.007. [DOI] [PMC free article] [PubMed] [Google Scholar]
- 29.Kim I-J, Zhang Y, Yamagata M, Meister M, Sanes JR. Molecular identification of a retinal cell type that responds to upward motion. Nature. 2008;452:478–82. doi: 10.1038/nature06739. [DOI] [PubMed] [Google Scholar]
- 30.Maisak MS, et al. A directional tuning map of drosophila elementary motion detectors. Nature. 2013;500:212–6. doi: 10.1038/nature12320. [DOI] [PubMed] [Google Scholar]
- 31.Takemura S.-y., et al. A visual motion detection circuit suggested by Drosophila connectomics. Nature. 2013;500:175–81. doi: 10.1038/nature12450. [DOI] [PMC free article] [PubMed] [Google Scholar]
- 32.Braitenberg V, Schüz A. Cortex: statistics and geometry of neuronal connectivity. 2nd edition edn. Springer Berlin; 1998. [Google Scholar]
- 33.Kalisman N, Silberberg G, Markram H. Deriving physical connectivity from neuronal morphology. Biol Cybern. 2003;88:210–8. doi: 10.1007/s00422-002-0377-3. [DOI] [PubMed] [Google Scholar]
- 34.Binzegger T, Douglas RJ, Martin KAC. A quantitative map of the circuit of cat primary visual cortex. J Neurosci. 2004;24:8441–53. doi: 10.1523/JNEUROSCI.1400-04.2004. [DOI] [PMC free article] [PubMed] [Google Scholar]
- 35.Stepanyants A, Chklovskii DB. Neurogeometry and potential synaptic connectivity. Trends Neurosci. 2005;28:387–94. doi: 10.1016/j.tins.2005.05.006. [DOI] [PubMed] [Google Scholar]
- 36.Fried SI, Münch TA, Werblin FS. Mechanisms and circuitry underlying directional selectivity in the retina. Nature. 2002;420:411–4. doi: 10.1038/nature01179. [DOI] [PubMed] [Google Scholar]
- 37.Yonehara K, et al. Spatially asymmetric reorganization of inhibition establishes a motion-sensitive circuit. Nature. 2010;469:407–410. doi: 10.1038/nature09711. [DOI] [PubMed] [Google Scholar]
- 38.Wei W, Hamby AM, Zhou K, Feller MB. Development of asymmetric inhibition underlying direction selectivity in the retina. Nature. 2010;469:402–406. doi: 10.1038/nature09600. [DOI] [PMC free article] [PubMed] [Google Scholar]
- 39.Surowiecki J. The Wisdom of Crowds. Anchor; 2005. [Google Scholar]
- 40.Turaga S, Briggman K, Helmstaedter M, Denk W, Seung S. Bengio Y, Schuurmans D, Lafferty J, Williams CKI, Culotta A, editors. Maximin affinity learning of image segmentation. Advances in Neural Information Processing Systems. 2009;22:1865–1873. [Google Scholar]
- 41.Turaga SC, et al. Convolutional networks can learn to generate affinity graphs for image segmentation. Neural Comput. 2010;22:511–38. doi: 10.1162/neco.2009.10-08-881. [DOI] [PubMed] [Google Scholar]
- 42.Ciresan D, Giusti A, Schmidhuber J, et al. Deep neural networks segment neuronal membranes in electron microscopy images. Advances in Neural Information Processing Systems. 2012;25:2852–2860. [Google Scholar]
- 43.Mutch J, Knoblich U, Poggio T. Tech. Rep. MIT-CSAIL-TR-2010-013 / CBCL-286. Massachusetts Institute of Technology; Cambridge, MA: 2010. CNS: a GPU-based framework for simulating cortically-organized networks. [Google Scholar]
- 44.Jeon C-J, Strettoi E, Masland RH. The major cell populations of the mouse retina. J Neurosci. 1998;18:8936–8946. doi: 10.1523/JNEUROSCI.18-21-08936.1998. [DOI] [PMC free article] [PubMed] [Google Scholar]
- 45.Snyder JP. Map projections–A working manual. 1395. USGPO; 1987. [Google Scholar]
Associated Data
This section collects any data citations, data availability statements, or supplementary materials included in this article.


