

Abstract
Introduction
Pemetrexed is an S-phase targeted drug in front-line or maintenance therapy of advanced non-squamous non-small cell lung cancer (NSCLC) but methods are needed for predicting the drug response. Dexamethasone is typically administered the day before, the day of and the day after pemetrexed. As dexamethasone strongly regulates many genes including p53 through the glucocorticoid receptor (GR), we hypothesized that dexamethasone influences tumor response to pemetrexed.
Methods
Eight non-squamous NSCLC cell line models with varied p53 and GRα/GRβ status were used for gene expression and cell cycle analyses and for loss/gain-of-function experiments.
Results
In three cell lines dexamethasone profoundly, but reversibly, suppressed the fraction of S-phase cells. Dexamethasone also reversibly repressed expression of thymidylate synthase and dihydrofolate reductase which are primary targets of pemetrexed but are also quintessential S-phase enzymes as well as the S-phase dependent expression of thymidine kinase 1. Dexamethasone also decreased expression of the major pemetrexed transporters, the reduced folate carrier and the proton coupled folate transporter. Only cells expressing relatively high GRα showed these dexamethasone effects, regardless of p53 status. In cells expressing low GRα, the dexamethasone response was rescued by ectopic GRα. Further, depletion of p53 did not attenuate the dexamethasone effects. The presence of dexamethasone during pemetrexed treatment protected against pemetrexed cytotoxicity, in only the dexamethasone responsive cells.
Conclusions
The results predict that in non-squamous NSCLC tumors, reversible S-phase suppression by dexamethasone, possibly combined with a reduction in the drug transporters, attenuates responsiveness to pemetrexed and that GR status is a principal determinant of tumor variability of this response.
Keywords: Non-small cell lung cancer, Pemetrexed, p53, Glucocorticoid Receptor
INTRODUCTION
Non-small cell lung cancer (NSCLC) comprises 85% of all lung cancer cases and the majority of those patients have regional or systemic metastases. Therefore systemic chemotherapy forms an important component of the management of NSCLC. The efficacy of various chemotherapeutic agents utilized for the treatment of NSCLC was, for many years, similar among the different histologic subtypes. Randomized clinical trials have now shown that the efficacy of pemetrexed is superior to other chemotherapy drugs in non-squamous NSCLC and inferior to other drugs in squamous cell lung cancer when given as mono-therapy or in combination with a platinum compound [1–4]. Pemetrexed has now received approval by regulatory agencies in the U.S. and in Europe for non-squamous NSCLC patients for front-line therapy in advanced stage disease in combination with cisplatin, as maintenance therapy following front-line therapy, and in patients with recurrent disease. Based on these data and in consideration of its limited toxicity profile, pemetrexed has become the preferred chemotherapy drug in the management of non-squamous NSCLC.
Despite its widespread use, the efficacy of pemetrexed in advanced stage NSCLC is modest, with a median progression-free survival of 5.5 months in the front-line setting when combined with cisplatin and only 3.5 months as single agent in patients with recurrent non-squamous NSCLC. These data suggest that the clinical benefit from pemetrexed is quite variable even among patients with non-squamous NSCLC highlighting the need to identify predictors of clinical benefit from pemetrexed. Such predictors would enable treatment decisions that would greatly benefit individual patients, while avoiding extended chemotherapies that are ineffective.
Pemetrexed is transported into the cell through two pharmacologically relevant principal membrane transporters, the reduced folate carrier (RFC) and the proton coupled folate transporter (PCFT) [5]. Polyglutamation of pemetrexed by folyl-polyglutamate synthase (FPGS) results in increased cellular retention of the drug and increases its affinity for some of its target enzymes [6]. Pemetrexed inhibits nucleotide biosynthesis principally by inhibiting thymidylate synthase (TS) but at pharmacologic doses it is also an inhibitor of dihydrofolate reductase (DHFR), glycinamide ribonucleotide formyltransferase (GARFT) and 5-aminoimidazole-4-carboxamide ribonucleotide formyltransferase (AICARFT) [7]. It is generally accepted that TS inhibition causes cytotoxicity via deprivation of dTMP needed for DNA synthesis and the associated ‘thymineless death’[8] and also via elevation of dUMP and its misincorporation into DNA [9]. Clearance of pemetrexed through the kidneys is rapid, resulting in a systemic half-life of only 3.5 hours, with up to 90 percent of the drug being eliminated in the urine within 24 hours [10]. The multi-targeted action of pemetrexed, together with its prolonged cellular retention due to its relatively higher affinity for FPGS results in greater anti-tumor activity compared with older generation antifolate drugs such as methotrexate.
The synthetic glucocorticoid dexamethasone (Dex) is used in standard practice as a concomitant medication during treatment with pemetrexed. Dex is typically dosed at 4 mg twice daily the day before, the day of and the day after therapy with pemetrexed. An important role of Dex is to reduce the possibility of severe skin rash caused by pemetrexed. Dex is also included for its anti-emetic properties particularly when pemetrexed is combined with cisplatin or carboplatin. The pharmacological actions of Dex are mediated by the glucocorticoid receptor (GR), which principally acts as a transcription factor [11]. Glucocorticoids regulate cell proliferation and apoptosis as well as inflammation and immune response [12]. The nature of the physiological response as well as sensitivity to synthetic glucocorticoids such as Dex is tissue-dependent and variable. This variability occurs among different individuals as well as among different tissues in the same individual [13].
A single GR gene generates two major splice variants, GRα and GRβ; each isoform has variants that result from multiple translation start sites within their mRNAs [13]. Although GRβ only diverges from GRα by substitution of the carboxyl-terminal 50 amino acids in GRα by a non-homologous 15 amino acid sequence, GRβ is unable to bind GR ligands [14]. GRβ heterodimerizes with GRα to exert a dominant-negative effect on the transcriptional activity of GRα [14]. Therefore the degree of Dex sensitivity of a tissue may be related to the functional GR status, determined by the level of GR expression as well as the ratio of GRα to GRβ. Whereas GRα is expressed ubiquitously, GRβ expression is potentially also significant in the present study of lung cancer because the limited types of tissues expressing this isoform include epithelial cells of the terminal bronchioles [14].
Given the profound tissue-specific effects of Dex, its ability to regulate many genes and the reported ability of Dex to modulate cellular senescence in lung cancer cells [15], it was of interest to examine the possibility that Dex may act on NSCLC cells to influence their responsiveness to pemetrexed. Immunohistochemical analysis of clinical NSCLC tumors shows considerable heterogeneity in total GR expression with relatively high total GR observed in approximately half of the tumors [16]. Further, approximately 33% of lung adenocarcinomas harbor p53 mutations [17] and the p53 gene is a known target for activation by Dex [18]. It was therefore of interest to explore both the GR status and the p53 status (wild type p53, p53 deletions or p53 mutations) of NSCLC cells as possible determinants of responsiveness to Dex, particularly molecular and cellular effects of Dex that could influence the action of pemetrexed.
MATERIALS AND METHODS
Cell Culture and Reagents
The non-squamous NSCLC cell lines A549, H1299, H358, H226, H460, H1650, ADLC-5M2 and H292 were grown in RPMI 1640 medium supplemented with 10% fetal bovine serum (FBS) (Gibco, Life Technologies), 100 units/ml penicillin, 100 μg/ml streptomycin and 2mM glutamine. The origin, growth conditions and responsiveness to selected agents of the NSCLC cell lines used in this study have been previously described [19]. All cell lines had been authenticated by SNP profiling within less than 12 months of in vitro propagation. The MTT assay reagents were from MP Biomedicals (Solon, OH). Charcoal-stripped fetal bovine serum was from Life Technologies (Carlsbad, CA). Dexamethasone was purchased from EMD Millipore (Billerica, MA). Dimethyl sulfoxide (DMSO) and crystal violet were purchased from Fisher Scientific (Pittsburgh, PA). Propidium iodide (PI)/RNase solution was purchased from BD Biosciences (San Jose, CA). PCR primers and TaqMan probes were either purchased from the Life Technologies inventory or custom synthesized by Integrated DNA Technologies (Coralville, IA). The GRα-expressing lentivirus was from GenTarget Inc. (San Diego, CA). p53shRNA expressing lentivirus was a kind gift from Dr. Yubin Ge at Karmanos Cancer Institute. Blasticidin and puromycin were from Life Technogies, Carlsbad, CA and Sigma-Aldrich, St. Louis, MO. Anti-DHFR antibody (sc-14778) was purchased from Santa Cruz Biotechnology (Santa Cruz, CA) and anti-TS antibody (# 9045) was purchased from Cell Signaling Technology (Danvers, MA).
Measurement of Gene Expression
To measure gene expression, mRNA was quantified by real time reverse transcription PCR. Total RNA from cells was isolated using RNeasy minikit (Qiagen, Georgetown, MD) according to the manufacturer’s protocol. Reverse transcription was performed using 500ng of total RNA and High-Capacity cDNA Archive kit (Life Technologies, Carlsbad, CA) according to the vendor’s protocol. cDNA was measured by quantitative real-time PCR using the StepOnePlus Real-Time PCR System (Life Technologies, Carlsbad, CA) and TaqMan Fast Universal PCR Master Mix (Life Technologies, Carlsbad, CA). All of the mRNA measurements were carried out using biological triplicate samples and CT values were normalized to those of GAPDH. The mRNA levels are represented as RQ (Relative Quantification), which is calculated using the formula RQ = 2−ΔΔCT, where ΔΔCT = ΔCT sample – ΔCT calibrator (ΔCT = CT of gene of interest – CT of GAPDH).
Western blot analysis
Cell lysates were generated using RIPA buffer (150mM NaCl, 1% NP-40, 0.5% sodium deoxycholate, 0.1% SDS, 50mM Tris of pH 8.0) containing protease inhibitor cocktail (Pierce Biotechnology, Thermo Fisher Scientific, Rockford, IL) and incubated on ice for 1 h. Total protein concentration was determined by Bradford assay (Bio-Rad Laboratories, Hercules, CA). Protein samples (20μg) were resolved by electrophoresis on 8% SDS-polyacrylamide gels and electrophoretically transferred to PVDF membranes (Millipore Corporation, Bedford, MA) for 1 h at 100mV. The blots were probed with the appropriate primary antibody and the appropriate horse radish peroxidase conjugated secondary antibody. The protein bands were visualized using enhanced chemiluminescence reagents (Hyglo Quick Spray, Denville Scientific) following the vendor’s instructions.
Cell Proliferation Assay
Cells (2000 per well) were seeded in 96-well plates in phenol-red-free medium supplemented with charcoal-stripped FBS. Treatments were initiated after the cells were attached. At the appropriate time points, cell viability was determined by MTT assay. 10μl of MTT (5mg/ml in phosphate buffered saline) was added to each well followed by incubation at 37°C for 2 h. The formazan crystal sediments were dissolved in 100μl DMSO and absorbance was measured at 570nm using the BioTek Synergy 2 Microplate Reader (BioTek, Winooski, VT). Each treatment was performed in six replicate wells.
Colony Formation Assay
Cells were trypsinized and 2000, 1000 and 500 cells per well were plated in duplicate 6-well plates in phenol-red-free medium supplemented with charcoal-stripped FBS. Colonies were formed after 6 days. The cells were fixed with ice cold methanol and stained with crystal violet. Images were obtained using the Oxford Optronix GelCount colony counter. Colonies were counted using the Oxford Optronix GelCount Software Version 1.1.2.0 (Oxford Optronix Ltd., Abingdon, UK). The colony formation assays were repeated at least three times and concordant results were obtained.
Cell Cycle Analysis
Cells were trypsinized and harvested in phenol-red-free medium supplemented with charcoal stripped FBS. Cells (1 × 10⁶) were washed and suspended in 500μl phosphate-buffered saline. The cells were fixed with ice cold 100% ethanol added drop wise with constant agitation and incubated on ice for 20 min. The cell pellet was obtained by centrifugation and suspended in 500μl of PI/RNase solution and incubated in the dark at room temperature for 20 min. Cell cycle distribution was determined using the BD LSR II analyzer (BD Biosciences, San Jose, CA) at the Microscopy, Imaging and Cytometry Resources Core at Karmanos Cancer Institute. The data was analyzed using ModFit software.
Gene Transduction and Selection of Recombinant Cells
To generate recombinant cells overexpressing GRα, cells were plated in a 24-well plate to 75% confluence and transduced with 50μl lentivirus. 72 h later, blasticidin (4μg/ml or 6μg/ml) was added to the cells. The cells were treated with blasticidin for 72 h and then subcultured in complete media. Blasticidin was added to the media at every third passage of the subculture. The recombinant cells expressing p53 shRNA were generated by an identical procedure except that the antibiotic used for selection was puromycin.
Statistical Analyses
Statistical significance was determined using one way ANOVA. The error bars in all graphs represent standard deviation of the mean. The P values are indicated in the figure legends.
RESULTS
Effect of Dex on the Expression of Genes Involved in Pemetrexed Action
As Dex is known to regulate the transcription of many genes through GR, we tested its effect on the expression of genes whose products have direct roles in the action of pemetrexed. For this purpose, we first chose two commonly used lung adenocarcinoma cell line models, A549 and H1299. The cells were plated in hormone depleted media and then treated with Dex (100 nM) for 48 h. This concentration of Dex was chosen because it is the highest plasma concentration of Dex when humans are administered a single dose of 4mg Dex [20]. Gene expression was quantified by real time RT-PCR. As seen in Figure 1A, in A549 cells, Dex suppressed the expression of TS and DHFR by 75 percent and also the expression of RFC (by 45 percent) and PCFT (by 60 percent). The expression levels of GARFT, AICARFT and FPGS were unaltered by Dex. In contrast, Dex did not significantly influence the expression of any of the genes tested in H1299 cells (Figure 1B). Western blots confirmed that both TS and DHFR were downregulated by Dex at the protein level in A549 cells (Figure 1C) but their expression was unaffected in H1299 cells (Figure 1D). The experiments were extended to additional lung cancer cell lines and they exhibited both sensitivity (H292 and H226 cells) and insensitivity (H460, H358, ADLC-5M2 and H1650 cells) to Dex (Table 1). The Dex sensitivity of lung cancer cell line models were thus variable with respect to the regulation of the genes whose products are directly involved in mediating the cytotoxicity of pemetrexed.
Figure 1. Differential effects of Dex on the expression of genes involved in pemetrexed action in A549 vs. H1299 cells.
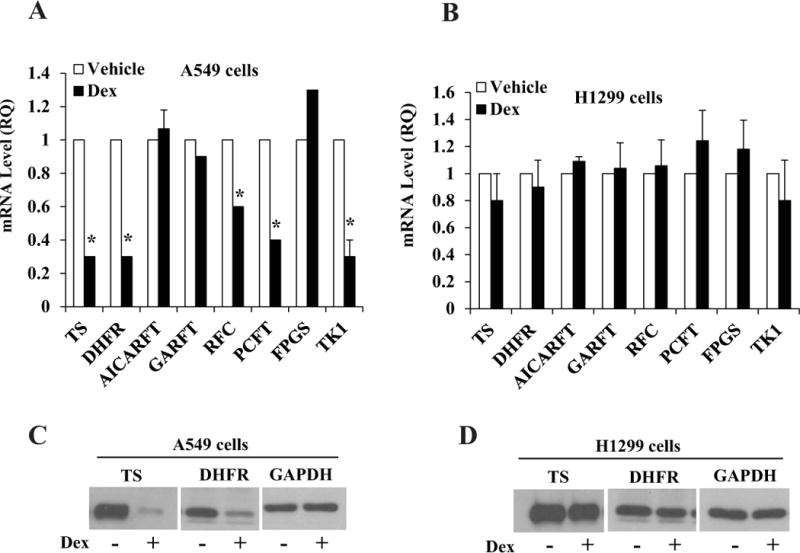
A549 cells (Panels A, C) and H1299 cells (Panels B, D) were plated at 20 percent confluence in media containing charcoal-stripped serum for 24 h for hormone depletion. Cells were then treated with either vehicle (ethanol) or Dex (100 nM) for 48 h. Cells were harvested and total RNA extracted to measure mRNA levels by real time RT-PCR (Panels A and B). Whole cell lysates were also extracted from the cells to measure the protein levels of TS and DHFR by western blot; GAPDH was used as the loading control (Panels C and D). * P < 0.01. All of the mRNA measurements were carried out using biological triplicate samples.
Table 1.
GR isoform expression and p53 status of model NSCLC cell lines and their response to Dex
| Cell line | p53 status |
GRα levela |
GRβ levela |
Effect of Dex on | ||
|---|---|---|---|---|---|---|
| TSb | DHFRb | S-phase | ||||
| A549 | wt | 1 | 0.008 | Decrease | Decrease | Suppressed |
| H292 | wt | 1.2 | 0.005 | Decrease | Decrease | Suppressed |
| H226 | P72R | 0.4 | 0.003 | Decrease | Decrease | Suppressed |
| H460 | wt | 0.2 | 0.002 | No effect | No effect | No effect |
| H358 | null | 0.2 | 0.001 | No effect | No effect | No effect |
| H1299 | null | 0.2 | 0.001 | No effect | No effect | No effect |
| ADLC-5M2 | P72R | 0.01 | 0.002 | No effect | No effect | No effect |
| H1650 | wt | 0.003 | 0.0002 | No effect | No effect | No effect |
Levels of GRα and GRβ mRNAs are normalized values relative to the level of GRα in A549 cells. Percent error of the assay was < 5.
TS and DHFR gene expression levels were determined by measuring mRNA by real time RT-PCR.
Effect of Dex on Cell Cycle Progression
As TS and DHFR are essential S-phase enzymes, we also tested the effect of Dex on thymidine kinase 1 (TK1), another S-phase dependent enzyme. TK1 was also decreased by Dex in A549 cells but not in H1299 cells (Figure 1A and 1B). Hence, it was of interest to test the effect of Dex on cell cycle phase distribution in the lung cancer cell lines. Treatment with Dex caused a striking suppression of S-phase in A549 cells (Figure 2A) but did not significantly alter the cell cycle phase distribution in H1299 cells (Figure 2B). Thus, the differential sensitivity of A549 and H1299 cells to transcriptional regulation by Dex noted above is associated with the differential ability of Dex to suppress the S-phase fraction of cells. This association also extended to the other NSCLC cell line models (Table 1).
Figure 2. Effect of Dex on cell cycle phase distribution in A549 and H1299 cells.
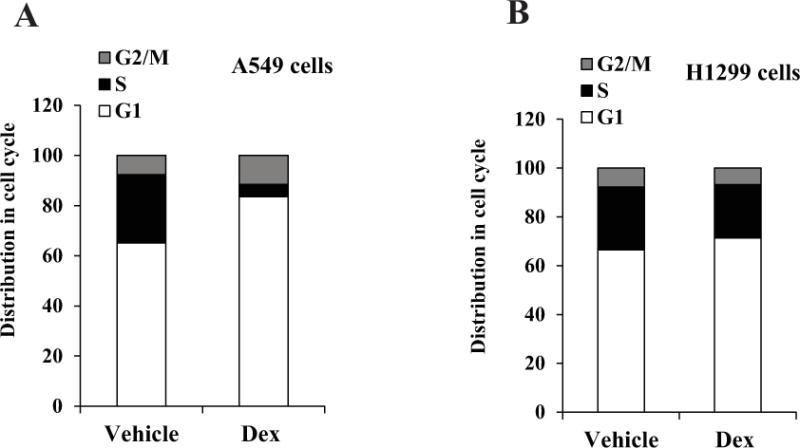
A549 cells (Panel A) and H1299 cells (Panel B) were plated at 20 percent confluence in media containing charcoal-stripped serum for 24 h for hormone depletion. Cells were then treated with either vehicle (ethanol) or Dex (100 nM) for 48 h and harvested for flow cytometry analysis. The experiments were repeated at least three times. Within each experiment, the percent error for replicate samples was < 10 percent. The P values for Dex induced changes noted in the text were < 0.0001.
Reversibility of the Effects of Dex
Next, we tested the duration of the transcriptional and cellular effects of Dex in A549 cells. Withdrawal of Dex restored the S-phase fraction to the original level (Figure 3A); the reversal occurred within 24 hours of Dex withdrawal. Further, the S-phase recovery was accompanied by full restoration of TS and DHFR expression (Figure 3B). These results demonstrate that the effects of Dex on the lung cancer cells are fully reversible.
Figure 3. Reversibility of Dex effects in A549 cells.
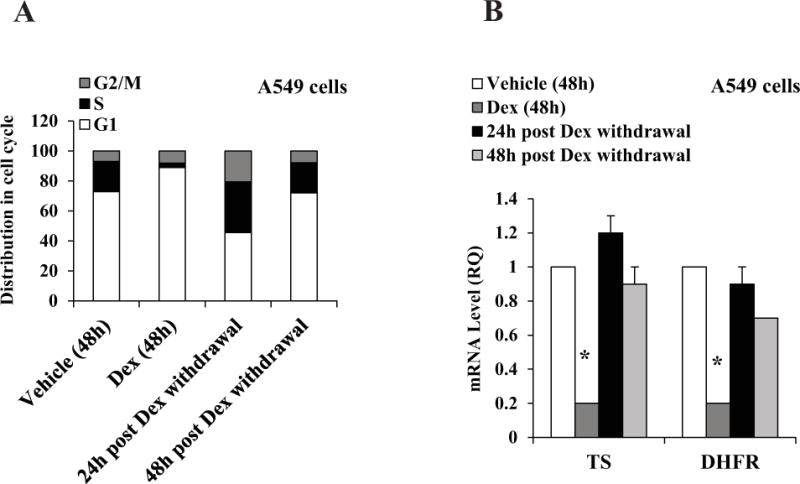
A549 cells were plated at 20 percent confluence in media containing charcoal-stripped serum for 24 h for hormone depletion. Cells were then treated with either vehicle (ethanol) or Dex (100 nM). After 48 h, Dex was removed by washing the cells twice and replacing with fresh media. Cells were cultured for additional periods of 24 h and 48 h. Cells were harvested for flow cytometry analysis (Panel A). The experiments were repeated at least three times. Within each experiment, the percent error for replicate samples was < 10 percent. The P values for Dex induced changes noted in the text were < 0.0001. In parallel, cells were harvested for mRNA measurement by real time RT-PCR (Panel B). * P < 0.01. All of the mRNA measurements were carried out using biological triplicate samples.
Relationship of the Dex Effects to GR Status
The cell line models chosen for this study showed variable levels of GRα and GRβ determined by quantitative RT-PCR (Table 1). Despite the fact that epithelial cells of the terminal bronchioles express GRβ, the expression of GRβ in the NSCLC cell lines was low compared to GRα (Table 1). The down-regulation of TS and DHFR or the suppression of S-phase by Dex occurred in A549 and H292 cells that expressed relatively the highest GRα and in H226 cells that expressed a moderate level of GRα. In contrast, the remaining cell lines that expressed lower levels of GRα were insensitive to Dex (Table 1). However, when GRα was transduced in the low GRα-expressing H1299 cells (H1299-GRα cells in Figure 4A), the Dex effect was restored, both in terms of down-regulation of TS and DHFR (Figure 4B compared with Figure 1B) and suppression of S-phase (Figure 4C compared with Figure 2B). Therefore, variability in GRα expression level alone could be an important factor underlying the differences among NSCLC cells in terms of their ability to respond to Dex.
Figure 4. Effect of restoring GRα on responsiveness to Dex in H1299 cells.
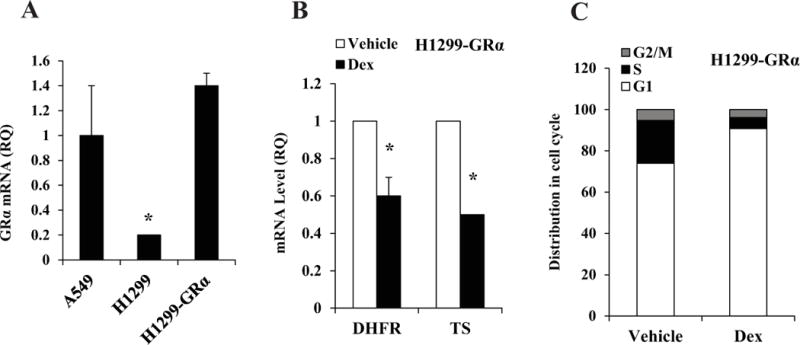
H1299-GRα cells were generated as described under Materials and Methods. RNA extracted from A549 cells, H1299 cells and H1299-GRα cells was used to measure the relative mRNA levels for GRα (Panel A). H1299-GRα cells were plated at 20 percent confluence in media containing charcoal-stripped serum for 24 h for hormone depletion. Cells were then treated with either vehicle (ethanol) or Dex (100 nM) for 48 h. Cells were harvested for mRNA measurement by real time RT-PCR (Panel B). * P < 0.01. In parallel, cells were harvested for cell cycle analysis (Panel C). The experiments were repeated at least three times. Within each experiment, the percent error for replicate samples was < 10 percent. The P values for Dex induced changes noted in the text were < 0.0001. All of the mRNA measurements were carried out using biological triplicate samples.
Relationship of the Dex Effects to p53 Status
The cell line models chosen also have variable p53 status, including wt p53, mutant p53 and p53 deletions (Table 1). Ectopic GRα rescued the Dex effects in the p53-null H1299 cells, indicating that in the presence of optimal GRα expression the cells may be responsive to Dex regardless of their p53 status (Figure 4). However H226 cells, which expressed the P72R mutant p53 were responsive to Dex although they expressed a moderate level of GRα in contrast to ADLC-5M2 cells that also harbored the same p53 mutation but expressed much less GRα (Table 1). As the P72R mutant is known to share functional similarities with wt p53 [21], it was of interest to test for a possible role of the mutant p53 in mediating the Dex effects in H226 cells. In H226 cells depleted of p53 by lentiviral transduction of p53shRNA (H226-p53KD cells, Figure 5A), Dex still inhibited the expression of TS, DHFR and the additional S-phase marker thymidine kinase 1 (TK1) (Figure 5B); the effects of Dex in the transduced cells were comparable in degree to its effects in the parental H226 cells (Figure 5C). In H226 cells, inhibition of the S-phase enzymes (Figure 5C) as well as suppression of the S-phase fraction of cells (data not shown) was moderate compared with A549 cells, likely reflecting the moderate expression level of GRα in H226 cells (Table 1). Taken together, the above results demonstrate that in non-squamous NSCLC cells, an optimal expression level of GRα sensitizes cells to Dex independent of p53 status.
Figure 5. Effect of knocking down p53 on responsiveness to Dex in H226 cells.
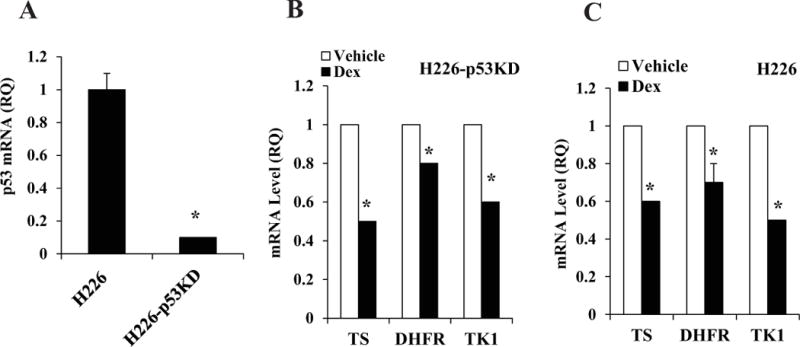
The relative p53 expression levels in the parental H226 cells vs. H226-p53KD cells were determined by real time RT-PCR (Panel A). H226-p53KD cells (Panel B) or the parental H226 cells (Panel C) were plated at 20 percent confluence in media containing charcoal-stripped serum for 24 h for hormone depletion. Cells were then treated with either vehicle (ethanol) or Dex (100 nM) for 48 h and then harvested for mRNA measurement by real time RT-PCR. * P < 0.01. All of the mRNA measurements were carried out using biological triplicate samples.
Effect of Dex on Cytotoxicity of Pemetrexed
As previously noted, the standard clinical regimen for pemetrexed treatment includes administration of Dex prior to, during and following pemetrexed. The reversible Dex effects observed above implies that in Dex-sensitive non-squamous NSCLC tumors, Dex could protect the tumor cells against the actions of pemetrexed for the duration of the drug treatment by temporarily suppressing transition through S-phase. To test the effect of Dex on sensitivity to pemetrexed, A549 and H1299 cells were pre-treated with Dex and a pharmacologically relevant dose (5 μM) of pemetrexed was introduced for a 24 hour period prior to withdrawing Dex. Following the treatments, the effect of Dex on susceptibility of the cells to pemetrexed was examined both by the standard MTT growth assay and by monitoring clonogenic survival. In the absence of Dex treatment pemetrexed profoundly inhibited the growth (Figure 6) and clonogenicity (Figure 7) of both A549 and H1299 cells, although when the cells were treated with Dex, there was a striking difference in the response of A549 cells versus H1299 cells. Dex had a protective effect on A549 cells against inhibition of growth and clonogenicity by pemetrexed (Figures 6A, 7A and 7D); in contrast, Dex treatment did not affect the sensitivity of H1299 cells to pemetrexed (Figures 6B, 7B and 7E). However, Dex did protect against pemetrexed in H1299 cells transduced with GRα (Figure 7C and 7F). Therefore, in a clinically relevant in vitro context, Dex-sensitive non-squamous NSCLC cells are protected by Dex against growth inhibition by pemetrexed and this effect is dependent on the expression of an optimal level of GRα.
Figure 6. Differential effects of Dex on growth inhibition by pemetrexed in A549 vs. H1299 cells.
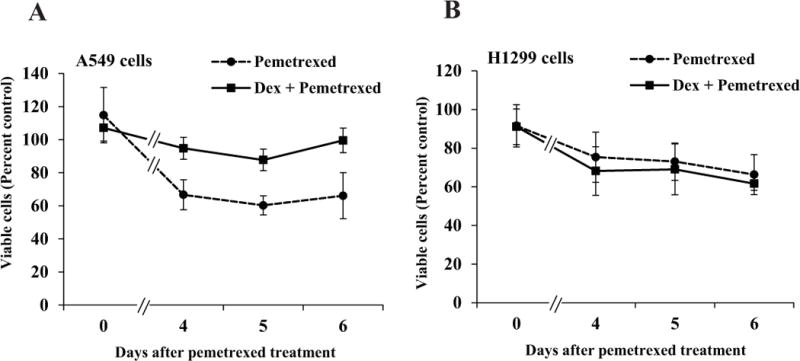
A549 cells (Panel A) and H1299 cells (Panel B) were plated in six replicate wells in 96 well plates in media containing charcoal-stripped serum as described under Materials and Methods for MTT assays. 24 h after plating, the cells were treated with vehicle (ethanol) or Dex (100 nM) for 72 h – 96 h. The cells were exposed to pemetrexed (5 μM) or vehicle (water) for a 24 hour window in the midst of the Dex (or vehicle) treatment. MTT assays were performed on the indicated days, beginning with the day of pemetrexed treatment (Day 0). At each time point, the ratio of the absorbance for pemetrexed treatment to its vehicle control was used to determine the percentage of viable cells.
Figure 7. Influence of Dex on inhibition of colony formation by pemetrexed in relation to GRα status.
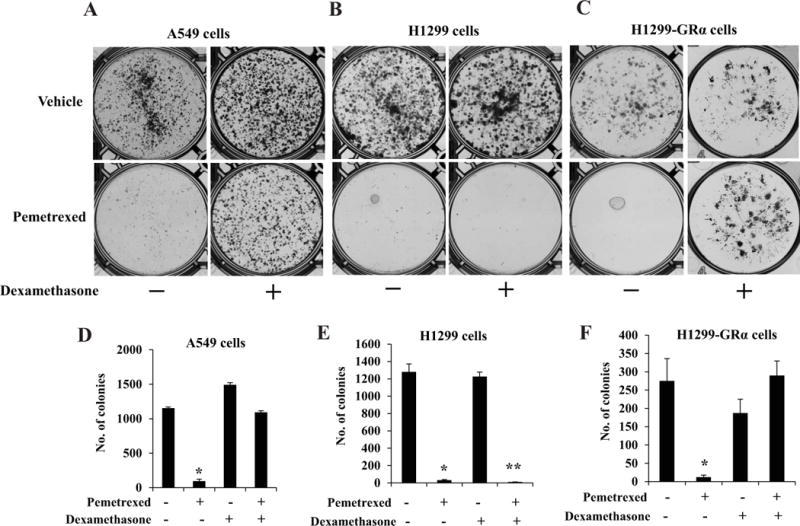
A549 cells (Panels A, D), H1299 cells (Panels B, E) and H1299-GRα cells (Panels C, F) were first plated at 20 percent confluence in 10 cm dishes in media containing charcoal-stripped serum for hormone depletion. 24 h later cells were treated with vehicle (ethanol) or Dex (100 nM) for 72 h – 96 h. The cells were exposed to pemetrexed (5 μM) or vehicle (water) for a 24 hour window in the midst of the Dex (or vehicle) treatment. The cells were then plated for the colony formation assay as described under Materials and Methods. After the colonies were formed, they were stained with crystal violet. The colony counts from replicate wells are represented in form of histograms (Panels D, E and F). *,** P < 0.0001.
DISCUSSION
Our studies of diverse non-squamous NSCLC cell line models indicate that NSCLC cells are variable in their ability to respond to a pharmacological concentration of Dex. In the responsive cells, Dex slowed cell cycle progression, specifically by suppressing progression into S-phase. Concomitantly, Dex suppressed the expression of TS and DHFR, both of which are principal target enzymes of pemetrexed as well as critical S-phase enzymes. Among other determinants of pemetrexed cytotoxicity, Dex also decreased the expression of RFC and PCFT, the pharmacologically relevant principal membrane transporters of pemetrexed. The effects of Dex were reversible such that, following withdrawal of Dex, both the S-phase fraction of the cells as well as the levels of TS and DHFR were restored within 24 hours. As a predictable consequence of these reversible effects of Dex, the cytotoxicity of pemetrexed was attenuated by Dex when the cells were exposed to Dex prior to, concomitant with and following pemetrexed treatment. Similar treatment with Dex did not influence pemetrexed cytotoxicity in cells in which it was unable to regulate the cell cycle or the expression of gene products involved in pemetrexed action.
Among the eight non-squamous NSCLC model cell lines examined, the cells expressing a relatively high level of GRα were sensitive to Dex regardless of their p53 status. Further the Dex effects were restored upon ectopic expression of GRα, in cells expressing relatively low endogenous GRα, even if they were p53 null. Cells that expressed a moderate level of GRα were moderately sensitive to Dex. In these cells, the studies also ruled out any contribution to Dex sensitivity in NSCLC cells attributable to the P72R mutant of p53 which reportedly [21] could be more effective in inducing stress response and apoptosis than wt p53 in different cell types. Although the p53 gene is a known target of glucocorticoids, p53 status is unlikely to have a major influence on response to Dex in non-squamous NSCLC cells. Remarkably, despite the fact that epithelial cells of the terminal bronchioles which may be progenitors of lung adenocarcinoma express GRβ [14], expression of GRβ was low in all of the NSCLC cell line models.
Patient response to pemetrexed has previously been shown to correlate negatively with tumor expression of TS and positively with tumor expression of folate receptor type α (FRα) [22, 23] but their relative expression is not a powerful independent predictor of clinical response. Moreover, this association cannot be attributed to a direct mechanistic link between drug sensitivity and the tumor levels of TS or FRα due to the following reasons: (i) the range of variability in tumor levels of TS determined by immunohistochemistry and related to pemetrexed treatment outcome is considerably narrower than that known to cause significant differences in cellular drug sensitivity at pharmacologic doses. For example, in the study of Christoph et al [23] patient response correlated with a mean H-score for TS expression of 187±5 and a median score of 180 whereas the non-responders had a mean score of 201±4 with a median of 210. In contrast, in vitro studies of lung cancer cell lines [24] have shown that variability in IC50 values for pemetrexed occurs over a much larger dynamic range of TS levels. Among various cell lines, the variability in TS levels that correlated with the variability in IC50 for pemetrexed occurred over a TS expression range of two orders of magnitude. Further, within a single cell line, TS induction partially or fully contributing to pemetrexed resistance ranged from 2.5-fold to 20-fold [24]. (ii) FRα is not the pharmacologically relevant transporter of pemetrexed except in unusual situations when its expression level may be very high, combined with defects in RFC- or PCFT- mediated transport [5]. On the other hand, as lower TS and higher FRα are known to be associated with reduced cell growth, they could reflect a smaller proportion of proliferating tumor cells. Therefore, it is quite likely that relative total TS and FRα values in the treatment-naive tumors may simply reflect the relative intrinsic growth rates of the tumors and hence relate to duration of survival following drug treatment. The present study advances a mechanism-based approach to understanding tumor responsiveness to pemetrexed, based on the effects of Dex and offers a rational basis for predicting individual responses.
It is believed that despite the rapid systemic clearance of pemetrexed [10], cellular retention of pemetrexed by polyglutamation confers a special advantage with effective outcomes through less frequent treatment cycles compared to other chemotherapy drugs. Indeed, both reduced FPGS expression and elevated γ-glutamyl hydrolase have been associated with pemetrexed resistance [25]. However, clearance of Dex is relatively slow, with physiologically effective concentrations remaining in circulation for several days following Dex withdrawal [26]. This consideration, combined with the protective effects of Dex observed under the in vitro conditions used in the present study, strongly suggests that Dex sensitive non-squamous NSCLC tumors will be less responsive to standard pemetrexed treatment regimens. The findings in this study of the effects of Dex on NSCLC cell susceptibility to pemetrexed would likely extend to other S-phase acting chemotherapy drugs as well. However, in the clinical setting, Dex may have a lower impact on the action of platinum drugs that can form DNA adducts at any stage of the cell cycle, with the downstream cellular effects manifesting after the clearance of Dex. Our findings warrant clinical studies of non-squamous NSCLC tumor responsiveness to pemetrexed in relation to Dex sensitivity and GR status of the tumors.
Acknowledgments
The authors acknowledge Jessica Back, Ph.D. for assistance with flow cytometry and the Microscopy, Imaging and Cytometry Resources Core at the Karmanos Cancer Institute, Wayne State University. The Microscopy, Imaging and Cytometry Resources Core is supported, in part, by NIH Center grant P30CA22453 to The Karmanos Cancer Institute, Wayne State University and the Perinatology Research Branch of the National Institutes of Child Health and Development, Wayne State University. The authors thank Dr. Yubin Ge for sharing p53 shRNA lentivirus.
References
- 1.Ciuleanu T, et al. Maintenance pemetrexed plus best supportive care versus placebo plus best supportive care for non-small-cell lung cancer: a randomised, double-blind, phase 3 study. Lancet. 2009;374(9699):1432–40. doi: 10.1016/S0140-6736(09)61497-5. [DOI] [PubMed] [Google Scholar]
- 2.Hanna N, et al. Randomized phase III trial of pemetrexed versus docetaxel in patients with non-small-cell lung cancer previously treated with chemotherapy. J Clin Oncol. 2004;22(9):1589–97. doi: 10.1200/JCO.2004.08.163. [DOI] [PubMed] [Google Scholar]
- 3.Scagliotti G, et al. The differential efficacy of pemetrexed according to NSCLC histology: a review of two Phase III studies. Oncologist. 2009;14(3):253–63. doi: 10.1634/theoncologist.2008-0232. [DOI] [PubMed] [Google Scholar]
- 4.Scagliotti GV, et al. Phase III study comparing cisplatin plus gemcitabine with cisplatin plus pemetrexed in chemotherapy-naive patients with advanced-stage non-small-cell lung cancer. J Clin Oncol. 2008;26(21):3543–51. doi: 10.1200/JCO.2007.15.0375. [DOI] [PubMed] [Google Scholar]
- 5.Chattopadhyay S, Moran RG, Goldman ID. Pemetrexed: biochemical and cellular pharmacology, mechanisms, and clinical applications. Mol Cancer Ther. 2007;6(2):404–17. doi: 10.1158/1535-7163.MCT-06-0343. [DOI] [PubMed] [Google Scholar]
- 6.Mendelsohn LG, et al. Enzyme inhibition, polyglutamation, and the effect of LY231514 (MTA) on purine biosynthesis. Semin Oncol. 1999;26(2 Suppl 6):42–7. [PubMed] [Google Scholar]
- 7.Shih C, et al. Multiple folate enzyme inhibition: mechanism of a novel pyrrolopyrimidine-based antifolate LY231514 (MTA) Adv Enzyme Regul. 1998;38:135–52. doi: 10.1016/s0065-2571(97)00017-4. [DOI] [PubMed] [Google Scholar]
- 8.Touroutoglou N, Pazdur R. Thymidylate synthase inhibitors. Clin Cancer Res. 1996;2(2):227–43. [PubMed] [Google Scholar]
- 9.Wilson PM, et al. Inhibition of dUTPase induces synthetic lethality with thymidylate synthase-targeted therapies in non-small cell lung cancer. Mol Cancer Ther. 2012;11(3):616–28. doi: 10.1158/1535-7163.MCT-11-0781. [DOI] [PubMed] [Google Scholar]
- 10.Rinaldi DA. Overview of phase I trials of multitargeted antifolate (MTA, LY231514) Semin Oncol. 1999;26(2 Suppl 6):82–8. [PubMed] [Google Scholar]
- 11.Mangelsdorf DJ, et al. The nuclear receptor superfamily: the second decade. Cell. 1995;83(6):835–9. doi: 10.1016/0092-8674(95)90199-x. [DOI] [PMC free article] [PubMed] [Google Scholar]
- 12.Vilasco M, et al. Glucocorticoid receptor and breast cancer. Breast Cancer Res Treat. 2011;130(1):1–10. doi: 10.1007/s10549-011-1689-6. [DOI] [PubMed] [Google Scholar]
- 13.Lu NZ, Cidlowski JA. Glucocorticoid receptor isoforms generate transcription specificity. Trends Cell Biol. 2006;16(6):301–7. doi: 10.1016/j.tcb.2006.04.005. [DOI] [PubMed] [Google Scholar]
- 14.Oakley RH, et al. Expression and subcellular distribution of the beta-isoform of the human glucocorticoid receptor. Endocrinology. 1997;138(11):5028–38. doi: 10.1210/endo.138.11.5501. [DOI] [PubMed] [Google Scholar]
- 15.Ge H, et al. Dexamethasone reduces sensitivity to cisplatin by blunting p53-dependent cellular senescence in non-small cell lung cancer. PLoS One. 2012;7(12):e51821. doi: 10.1371/journal.pone.0051821. [DOI] [PMC free article] [PubMed] [Google Scholar]
- 16.Lu YS, et al. Glucocorticoid receptor expression in advanced non-small cell lung cancer: clinicopathological correlation and in vitro effect of glucocorticoid on cell growth and chemosensitivity. Lung Cancer. 2006;53(3):303–10. doi: 10.1016/j.lungcan.2006.05.005. [DOI] [PubMed] [Google Scholar]
- 17.Toyooka S, Tsuda T, Gazdar AF. The TP53 gene, tobacco exposure, and lung cancer. Hum Mutat. 2003;21(3):229–39. doi: 10.1002/humu.10177. [DOI] [PubMed] [Google Scholar]
- 18.Crochemore C, et al. Enhancement of p53 activity and inhibition of neural cell proliferation by glucocorticoid receptor activation. FASEB J. 2002;16(8):761–70. doi: 10.1096/fj.01-0577com. [DOI] [PubMed] [Google Scholar]
- 19.Zhou J, et al. Modulation of the ribonucleotide reductase-antimetabolite drug interaction in cancer cell lines. J Nucleic Acids. 2010;2010:597098. doi: 10.4061/2010/597098. [DOI] [PMC free article] [PubMed] [Google Scholar]
- 20.Dandona P, et al. Effect of dexamethasone on reactive oxygen species generation by leukocytes and plasma interleukin-10 concentrations: a pharmacodynamic study. Clin Pharmacol Ther. 1999;66(1):58–65. doi: 10.1016/S0009-9236(99)70054-8. [DOI] [PubMed] [Google Scholar]
- 21.Whibley C, Pharoah PD, Hollstein M. p53 polymorphisms: cancer implications. Nat Rev Cancer. 2009;9(2):95–107. doi: 10.1038/nrc2584. [DOI] [PubMed] [Google Scholar]
- 22.Bepler G, et al. Clinical efficacy and predictive molecular markers of neoadjuvant gemcitabine and pemetrexed in resectable non-small cell lung cancer. J Thorac Oncol. 2008;3(10):1112–8. doi: 10.1097/JTO.0b013e3181874936. [DOI] [PMC free article] [PubMed] [Google Scholar]
- 23.Christoph DC, et al. Significance of folate receptor alpha and thymidylate synthase protein expression in patients with non-small-cell lung cancer treated with pemetrexed. J Thorac Oncol. 2013;8(1):19–30. doi: 10.1097/JTO.0b013e31827628ff. [DOI] [PMC free article] [PubMed] [Google Scholar]
- 24.Ozasa H, et al. Significance of thymidylate synthase for resistance to pemetrexed in lung cancer. Cancer Sci. 2010;101(1):161–6. doi: 10.1111/j.1349-7006.2009.01358.x. [DOI] [PMC free article] [PubMed] [Google Scholar]
- 25.Schneider E, Ryan TJ. Gamma-glutamyl hydrolase and drug resistance. Clin Chim Acta. 2006;374(1–2):25–32. doi: 10.1016/j.cca.2006.05.044. [DOI] [PubMed] [Google Scholar]
- 26.Weijtens O, et al. Dexamethasone concentration in vitreous and serum after oral administration. Am J Ophthalmol. 1998;125(5):673–9. doi: 10.1016/s0002-9394(98)00003-8. [DOI] [PubMed] [Google Scholar]