

Abstract
Glucocorticoid steroids affect almost every type of tissue and thus are widely used to treat a variety of human pathological conditions. However, the severity of numerous side effects limits the frequency and duration of glucocorticoid treatments. Of the numerous approaches to control off-target responses to glucocorticoids, small molecules and pharmaceuticals offer several advantages. Here we describe a new, extended high-throughput screen in intact cells to identify small molecule modulators of dexamethasone-induced glucocorticoid receptor (GR) transcriptional activity. The novelty of this assay is that it monitors changes in both GR maximal activity (Amax) and EC50 (the position of the dexamethasone dose-response curve). Upon screening 1280 chemicals, 10 with the greatest changes in the absolute value of Amax or EC50 were selected for further examination. Qualitatively identical behaviors for 60% to 90% of the chemicals were observed in a completely different system, suggesting that other systems will be similarly affected by these chemicals. Additional analysis of the 10 chemicals in a recently described competition assay determined their kinetically defined mechanism and site of action. Some chemicals had similar mechanisms of action despite divergent effects on the level of the GR-induced product. These combined assays offer a straightforward method of identifying numerous new pharmaceuticals that can alter GR transactivation in ways that could be clinically useful.
Glucocorticoid steroids are essential for normal human functioning and affect virtually every tissue in the body. This broad tissue sensitivity to glucocorticoids has led to glucocorticoids being prescribed for a variety of human pathological conditions including inflammation, cancer, and cardiovascular disease (1). Conversely, the same widespread tissue response to glucocorticoids leads to numerous consequences other than the desired one, otherwise considered as side effects. Some side effects, such as bone and muscle atrophy, stunted growth, and increased incidence of diabetes (2), can severely limit the applications of glucocorticoids. In most cases, the effects of glucocorticoids are thought to be expressed via a sequence of events starting with entry of the steroid into the target (and off-target) cell, followed by binding to the intracellular cognate receptor (glucocorticoid receptor [GR]) and activation or transformation to a form of the receptor-steroid complex that migrates into the nucleus and associates with both biologically active and inactive DNA sequences with increased affinity (3). After a series of mostly poorly defined steps, both in number and biochemical reaction, the physiological responses are observed, usually over several hours. At the level of gene expression, these responses are about equally divided between gene induction and gene repression (4–6). Gene induction usually proceeds via direct binding to the DNA of GR-steroid complexes. Gene repression is most frequently characterized by GR complexes associating with, or tethering to, other transcription factors that are already DNA-bound (7).
A major impediment to the more frequent usage of glucocorticoids in endocrine therapies has been the difficulty in making the final responses more selective and thus reducing the number of unwanted side effects (8). Several approaches have been pursued over the years, including modifications in the structure of agonist steroids to alter bioavailability, body clearance half-life, metabolism, affinity for receptor, and selectivity of nuclear binding sites. The discovery of selective receptor modulators, which are steroids with less than full agonist activity in a manner that varies with the gene examined, appears to be an additional promising avenue (5, 9). These steroids thus have various amounts of antisteroid activity, depending on the gene. The most useful have been the antiestrogens, tamoxifen and raloxifene, which are effective in reducing the growth of estrogen-dependent breast tumors while preserving near normal estrogenic responses in several other tissues. X-ray crystallographic determinations of the structure of ligands bound to the highly organized C-terminal ligand-binding domain (LBD) of GRs has been an additional approach to designing new ligands (10).
Unfortunately, none of the above avenues have yielded the increased specificity needed to widely expand the clinical applications of glucocorticoids. One reason is that the LBD, of both GRs and other steroid receptors, is much more malleable than expected and thus is deformed to accommodate ligands that initially were not expected to fit (11–13). Other reasons include the increased awareness that numerous additional influences of GR gene expression exist. These include chromatin conformation and DNA accessibility, DNA sequence (14, 15), cofactor interactions (6), and the role of the intrinsically disordered N-terminal domain of all steroid receptors, which also contains an activation function domain (AF1) that is usually the most transcriptionally active region in the receptor (8, 16). Finally, there are >350 cofactors that have been found to alter the maximal amount of steroid receptor–induced activity (Amax) (17).
The first cofactors were found to interact with the activation function present in the LBD, ie, AF2. However, interactions with both the AF1 and AF2 domains, or just AF1, have also been reported (18–21). Interestingly, most of the cofactors that have been examined modulate not only the Amax but also the concentration of steroid required for half-maximal activity (EC50). Depending on the concentration of circulating ligand in an organism, changes in EC50 can have as much or greater effects than changes in Amax (22–26). For example, changes in the EC50 values of target genes are responsible for the ordered expression of developmental genes by ecdysone during Drosophila postembryonic development (27). This modulation is not a binary on/off mode but rather is like a rheostat in that the magnitude of the changes in Amax and EC50 is sensitive to changes in the concentration of cofactors (6, 23). Finally, the interactions of cofactors with the intrinsically disordered AF1 domain appear to be directly involved in the variations in Amax and EC50 of GR transactivation and perhaps transrepression (21, 28, 29).
Given the abundant influences that have not been investigated for increasing the selectivity of GR-regulated gene expression, there is still reason for optimism that such control might eventually be achieved. One particularly attractive approach is to regulate the interactions of specific cofactors with either the AF1 or AF2 regions of GRs. The interactions with AF1 are a particularly fertile field given the numerous induced conformational changes in AF1 that appear to result from the binding of various cofactors (8, 16). Such interactions with estrogen receptor α have been disrupted by assorted peptides in a tissue-specific manner (30, 31). Even more promising are small organic molecules because of their ease of synthesis, handling, administration, and intracellular accessibility. Because of the lack of known binding sites for such chemicals, though, the number of agents that disrupt cofactor binding to receptors is relatively small. However, research in this area has increased and shown that such inhibitors do exist for androgen, estrogen, and thyroid receptors (32–37). These advances have been greatly accelerated by the use of high-throughput screening (33, 34, 38–40). The results suggest that such small molecule modulators of GR transactivation might also exist.
The purpose of this study was to use a high-throughput screening approach to identify small molecules with the potential to perturb GR transactivation. We used the LOPAC1280 (Library of Pharmacologically Active Compounds) compound library, which is a well-validated collection of small molecules and approved drugs with known activity, covering many major drug target classes. In addition, it has been extensively used and reported on as a tool for high-throughput screen validation, so a variety of activity data for these compounds are available. The library has considerable coverage of the GR signaling pathway, as well as those of other G protein–coupled receptors, and thus is a useful tool for interrogating modulation of the GR response in cells. Two major modifications to this approach were made in the present study, both to increase the scope of the screening and to rapidly characterize the initial hits. First, virtually all screens to date examine only changes in Amax. As was described above, many factors also alter the EC50 of GR transactivation. Therefore, we have developed a high-throughput screen that examines both Amax and EC50. Second, we have linked the screen with a recently described competition assay that allows one to readily determine not only the site but also the kinetically defined mode of action of any factor that alters GR transactivation properties (41–44). With these 2 procedural modifications, we have identified and characterized 10 chemicals that modify various steps in GR transactivation. This approach can thus be used to rapidly identify many more chemicals for all steroid receptors, some of which may prove to be clinically useful.
Materials and Methods
Unless otherwise indicated, all cell growth was at 37°C, and all other operations were performed at room temperature.
Chemicals and plasmids
Dexamethasone (Dex) and the LOPAC1280 library were from Sigma-Aldrich. The Renilla-thromboxane synthase (TS) reporter, rat GR (pSG5-GR), and GREtkLUC have been described previously (45).
Preparation of GREtkLUCGREtkAcGFP1-1 reporter
PCRs of glucocorticoid response element (GRE) 1, GRE2, and tk to clone into AcGFP1-1 vector
Oligonucleotides were used to generate a SmaI site (CGGCCCGGGCTAGAACATCCTGTACAGGATCCGTAG) in the 5′ end and an AgeI site (CGGACCGGTACCAACAGTACCGGAATGCCAAGCTTCG) in the 3′ end of the GREtkLUC from bp 437 to 684 containing the GRE1 and GRE2 GR binding elements and the tk promoter from the GREtkLUC reporter using a Fast Start PCR Master Mix (12-140-314-001; Roche). PCR was performed at 95°C for 4 minutes, followed by 30 cycles of 95°C for 30 seconds plus 65°C for 30 seconds and 73°C for 30 seconds and 72°C for 7 minutes and then held at 4°C. The PCR product was confirmed on a 2% agarose gel and purified with a QIAquick gel extraction kit (28704; QIAGEN).
Cloning GREtkGFP with GREtk PCR fragments into AcGFP1-1 vector
The GREtk PCR product and promotor-less vector pAcGFP1-1 (632497; Clontech) were sequentially digested with AgeI (FD1464; Fermentas) and SmaI (FD0664; Fermentas) at 37°C for 1 hour each. The vector was purified with a QIAprep spin miniprep kit (27104; Qiagen). The PCR product was purified with a QIAquick gel extraction kit. The digested and purified GREtk PCR product and vector were ligated with T4 DNA ligase (EL0014; Fermantas) at 16°C overnight and then transformed into subcloning efficiency DH5α cells (18265-017; Invitrogen). Clones were screened by PCR and confirmed by sequencing. GREtkGFP Dex-dependent expression was confirmed in transiently transfected U2OS.rGR cells by fluorescence microscopy and quantitative RT-PCR (qRT-PCR) with the following primers: AcGFP, 5′-TTGCCATCCTCCTTGAAATC; AcGFP, 3′-CACATGAAGCAGCACGACTT; GREtkLUC, 5′-AATCTGACGCAGGCAGTTCT; and GREtkLUC, 3′-CCAGGGATTTCAGTCGATGT.
Cloning GREtkLUC or tkLUC into GREtkAcGFP1-1
The GREtkLUC reporter and tkLUC reporter were digested with SmaI, SalI, and ScaI (Fermentas Fast Digest) and the corresponding fragments were separated on a 1% Tris acetate-EDTA (TAE) gel and purified with a QIAquick gel extraction kit. The GREtkAcGFP1-1 reporter was digested with SmaI and SalI and purified with a QIAprep spin miniprep kit. The digested and purified GREtkLUC or tkLUC PCR products and vector were ligated with T4 DNA ligase at 16°C overnight and then transformed into subcloning efficiency DH5α cells, and the insert was confirmed by digesting with SmaI and SalI.
Creation of stably transfected 293 cells
293 cells were seeded at 2 × 10⁵ cells/well in a 24-well plate in 10% fetal bovine serum in high-glucose DMEM. The next day they were transfected with 2 μg of GR/pCMVneo plus 2 μg of reporter (either GREtkLUCGREtkAcGFP1-1 or tkLUCGREtkAcGFP1-1) using 4 μL/4 μg of DNA Lipofectamine 2000 (Invitrogen). On the following day, fresh medium was added, and 24 hours later the cells were plated into 150-mm dishes and allowed to establish individual colonies in the presence of 0.5 mg/mL G418 (Geneticin, 11811-031; Gibco) for 1 week. The colonies were then treated with 1 mM Dex for 20 hours. Cells were trypsinized and resuspended at 1 × 10⁶ cells/mL. They were then filtered through a BD Falcon 40-μm cell strainer and triturated with EDTA (added to 5 mM) to disperse and placed on ice. Cells were sorted by fluorescence-activated cell sorting (FACS) in a FACSAriaII using FACSDiva version 6.1.3 software. Cells expressing medium and high levels of green fluorescent protein (GFP) fluorescence were sorted and seeded in a 24-well plate with G418-selective medium and expanded to 100-mm dishes.
Cells were then trypsinized and resuspended at 0.5 cell/well in 100 μL of medium containing 0.5 mg/mL G418 and seeded into 96-well plates. Colonies were allowed to grow and then were examined under a fluorescence microscope. All autofluorescing colonies were eliminated. Colonies were then treated with 1 μM Dex without G418. Positive Dex-dependent fluorescent colonies, compared with those for the ethanol (EtOH) vehicle treatment, were transferred to 24-well plates and expanded into 100-mm dishes. Clones were then analyzed for Dex dose responsiveness. Those clones displaying the greatest fold induction of luciferase activity with Dex (GREtkLUCGREtkAcGFP1-1 clone [DR41] and tkLUCGREtkAcGFP1-1 clone [tk90]) were then further sorted by FACS to select for higher Dex-induced GFP expression. qRT-PCR was used to confirm that the clones were expressing both LUC and GFP as appropriate for the reporter.
GR modulation quantitative high-throughput screening (qHTS) assay
A stepwise description of the 1536-well GR modulation assay is shown in Table 1. In brief, cells were plated using a Multidrop Combi dispenser (Thermo Fisher Scientific) into sterile, 1536-well, white tissue culture plates (Greiner Bio-One). Dex stocks were prepared in dimethylsulfoxide (DMSO), diluted in medium, and added to plates to yield final concentrations of 0 (DMSO only), 0.1, 1, 10, and 100 nM Dex. Plates were sealed with gasketed stainless steel lids with holes for gas exchange (Wako USA). After cell attachment, library compounds were transferred by a Pintool (Wako USA) using 10-nL slotted pins. The LOPAC1280 library was serially diluted in DMSO and was added to plates to yield final concentrations of 0 (DMSO only), 0.37, 1.84, and 9.2 μM library compound. After an 18-hour incubation, medium was aspirated from each well using a Kalypsys 1536-well aspiration manifold (Wako USA), leaving 1 μL remaining, and passive lysis buffer (Promega) was added to gently lyse cells. Luciferase Assay System I reagent (Promega) was rapidly dispensed using a BioRAPTR Flying Reagent Dispenser (Beckman Coulter), and plates were immediately read using a ViewLux microplate imager (PerkinElmer) to detect luminescence. Each plate contained negative and positive control wells (DMSO and 2 μM Dex-treated cells, respectively), which were used to normalize signals for each plate. Screening data were corrected and normalized (for these data, see Supplemental Table 1 at http://press.endocrine.org/doi/suppl/10.1210/me.2014-1069/suppl_file/me-14-1069.txt), and concentration-effect relationships were derived using publicly available curve-fitting algorithms developed within the National Institutes of Health Chemical Genomics Center (http://tripod.nih.gov/curvefit/). For follow-up validation, potential hits were selected and reordered from fresh powder stocks.
Table 1.
GR Modulation qHTS Assay Protocol
| Sequence | Parameter | Value | Description |
|---|---|---|---|
| 1 | Reagent | 4 μL | Cell dispense: 2500 DR-B cells/well in medium |
| 2 | Reagent | 1 μL | Agonist dispense: Dex in medium |
| 3 | Time | 2 h | Incubation: 37°C, 5% humidified CO2 |
| 4 | Compound | 23 nL | Pintool dispense: LOPAC1280 compound library (in DMSO) |
| 5 | Time | 18 h | Incubation: 37°C, 5% humidified CO2 |
| 6 | Aspiration | 4 μL | Vacuum aspiration: 4 μL (1 μL remaining) |
| 7 | Reagent | 1 μL | Dispense: lysis buffer |
| 8 | Time | 15 min | Incubation: room temperature |
| 9 | Reagent | 5 μL | Dispense: LUC assay system reagent |
| 10 | Detection | Luminescence | Detection: ViewLux read, luminescence, 10-second exposure |
A stepwise protocol for the GR modulation qHTS assay is shown.
Two-factor competition assay
The underlying theory and practical application of the competition assay were most recently described by Zhu et al (44). In brief, factors effecting GR transactivation are classified mechanistically as either accelerators or 1 of 6 types of decelerators acting at some step in the overall reaction sequence, ie, before, at, or after a unique step, called the concentration limiting step (CLS) (43). The CLS is that step in the sequence beyond which the concentrations of bound factors are negligible with respect to their free concentrations. In these reactions with varying concentrations of 2 factors, a formula (parametric statistical model) can be constructed for each combination of factor type and location with respect to each other and the CLS. The individual parametric models are associated with defined graphical behaviors that were initially described in Table S1 (42) and updated in a different Table S1 (44). These graphs can be compared directly with those constructed from the experimental data to draw conclusions regarding the actions of the 2 factors, as described in the flow chart of Figure S1 (44).
More specifically, the effects of 4 concentrations of each of 2 factors (chemical and reporter gene; total = 16 combinations) on the maximum induced activity (Amax) and EC50 were determined from triplicate samples of U2OS cells that were seeded into 24-well plates at 25 000 cells/well and transiently transfected on the following day with GREtkLUC reporter and pSG5/GR (0.5 ng) plasmids by using 0.7 μL of Lipofectamine per well according to the manufacturer's instructions. Renilla-TS (10 ng/well of a 24-well plate) was included as an internal control. The total transfected DNA was adjusted to 300 ng/well of a 24-well plate with pBluescript II SK+ (Stratagene). After transfection (24 hours), cells were treated with fresh medium containing appropriate dilutions of Dex with or without chemical. Four Dex concentrations (0, 1x, 5x, and 25x, where 5x is approximately the EC50 of the system) in EtOH and 4 concentrations of chemical (concentration and spacing are determined empirically for each compound) in EtOH or DMSO were used, with the final concentrations of EtOH (total) and DMSO being 0.1% to 1% and ≤0.25%, respectively (total samples = 192). The cells were lysed 20 hours later in passive lysis buffer and assayed for reporter gene activity using dual-luciferase assay reagents according to the manufacturer's instructions (Promega). Luciferase activity was measured by a GloMax 96 Microplate Luminometer (Promega). The data were normalized to Renilla-TS luciferase activity and are expressed as a percentage of the maximal response with Dex before being plotted as average ± SEM, unless otherwise noted. Direct fitting a Michaelis-Menten curve to the average dose-response data by KaleidaGraph (Synergy Software) yields Amax and EC50 values, which are used to prepare graphs of 1/EC50 and Amax/EC50 (and EC50/Amax when the plot of Amax/EC50 is decreasing) vs the concentration of 1 cofactor at each of the concentrations of the second factor. Representative data and a spread sheet showing how the data are manipulated for graphing are found in Supplemental Table 2 (http://press.endocrine.org/doi/suppl/10.1210/me.2014-1069/suppl_file/me-14-1069.xls). When an experiment uses n concentrations of each cofactor, then there are a total of 4 to 6 graphs, each with n separate curves. The shape of the curves and how they change with the other cofactor are then compared with values in Supplemental Table 1 (44) to determine the kinetically defined mechanism of action and site of action, relative to each other and to the CLS.
Statistical analysis
Unless otherwise noted, all experiments were performed in triplicate multiple times, except the high-throughput screening that was performed once. KaleidaGraph 3.5 was used to determine a least squares best fit (R2 was almost always >0.95) of the experimental data to the theoretical dose-response curve, which is given by the equation derived from Michaelis-Menten kinetics of y = (free steroid)/(free steroid + dissociation constant [Kd]) (where the concentration of total steroid is approximately equal to the concentration of free steroid because only a small portion is bound), to yield a single EC50 value. The values of n independent experiments were then analyzed for statistical significance by the two-tailed Student t test using InStat 2.03 for Macintosh (GraphPad Software). The Mann-Whitney test or the Alternate Welch t test is used when the difference between the SD values of 2 populations is statistically significant.
Results
Bioassay of GREtkLUCGREtkAcGFP1-1
The dual-reporter plasmid GREtkLUCGREtkAcGFP1-1 and the control plasmid tkLUCGREtkAcGFP1-1 were prepared so that induction of GFP by the synthetic glucocorticoid Dex could be demonstrated to occur through the immediately upstream GRE as opposed to a cryptic enhancer in the plasmid backbone. Induction of GFP from both plasmids but luciferase from only GREtkLUCGREtkAcGFP1-1 was taken as evidence that GFP expression was under the control of the immediately upstream GRE sequence. The induction of LUC from GREtkLUCGREtkAcGFP1-1 was similar to that previously seen from the simpler GREtkLUC reporter upon Dex induction after transient cotransfection with transcriptional intermediary factor 2 (TIF2) in U2OS cells (42, 43, 46, 47). In contrast, the tkLUCGREtkAcGFP1-1 reporter failed to induce LUC activity (data not shown). Dex-dependent induction of GFP in the GREtkLUCGREtkAcGFP1-1 and tkLUCGREtkAcGFP1-1 was confirmed with fluorescence microscopy (data not shown).
These 2 GFP plasmids were stably transfected into 293 cells as described in the Materials and Methods. FACS was used to select the cells transfected with GREtkLUCGREtkAcGFP1-1 that gave the highest fold increase in GFP signal with added Dex (85-fold by qRT-PCR). Clonal cell lines were then produced from the FACS-selected cells, and the clone with the highest fold induction of GFP was used in the high-throughput studies below.
Optimization of high-throughput screen
Before actual screening, the GR induction assay was optimized in a 1536-well robotics format to provide a robust and high-throughput amenable assay for screening. The assay plating density was titrated to determine the ideal cell concentration for robust Dex-mediated signals and was optimized with respect to signal/background and Z′ values. Several luciferase detection reagents were tested to measure the GR-mediated luminescence signal, and the sensitivity of the luciferase assay system reagent appeared best suited for this particular assay. Although the luminescent signal produced with the luciferase assay system has a considerably shorter half-life than that of other luciferase kits, the timing of the assay remained high-throughput amenable. However, the short timeline of this optimized protocol prevented the parallel control assay of GFP with tkLUCGREtkAcGFP1-1 to determine background induction from a cryptic promoter in the vector. This issue was therefore addressed later in the study. With use of these optimized conditions, a Dex dose-response curve was determined (Figure 1A). Good fold induction and an excellent first-order Hill plot were obtained. This result demonstrates that Michaelis-Menten kinetics is being obeyed in this assay. The system was further validated with titrations of known GR ligands (Dex, aldosterone, cortisol, and Dex-21-mesylate), all of which gave dose-dependent responses with appropriate EC50 values and maximal responses (Figure 1B). Based on the Dex dose-response curve, the concentrations of Dex chosen to be used with each of the chemicals in the high-throughput assay spanned the entire curve (0.1–100 nM) to provide a broad window for shifts in either EC50 or Amax.
Figure 1.
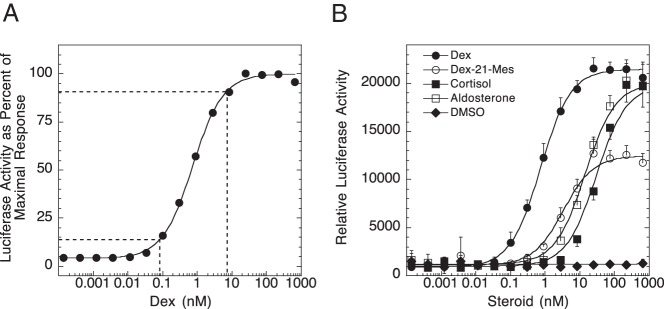
Optimization of GR transactivation in high-throughput assay. A, Dose-response curve for GR-mediated induction of luciferase by Dex. The assay was conducted as described in Materials and Methods. Data are plotted as a percentage of the maximal response. The curve represents the best fit to a Michaelis-Menten plot. The dashed lines indicate Dex concentrations required for 10% and 90% of full induction. B, Relative dose-response curves for 4 known GR ligands: Dex, dexamethasone-21-mesylate (Dex-21-Mes), cortisol, and aldosterone. Assays were conducted as in panel A. Data are plotted as relative luciferase activity (±SD) and best fit to a Michaelis-Menten plot.
High-throughput screening of LOPAC1280 library and analysis
The protocol for the high-throughput screen is outlined in Table 1. The LOPAC1280 library was screened at 4 distinct concentrations (0, 0.37, 1.84, and 9.20 μM) in the presence of 5 different concentrations of Dex (0, 0.1, 1, 10, and 100 nM) in a single batch of 20 plates (Figure 2). Once all plates were read, the data were normalized to negative and positive controls on each plate (DMSO solvent and 2 μM Dex, respectively), and curve fits (using the Hill equation) were performed for each Dex titration at each of the 4 concentrations of LOPAC1280 compounds. The curve-fitting was performed using publically available software (tripod.nih.gov/curvefit/). These curves were then manually compared to identify compounds that significantly shifted either the EC50 or Amax of Dex. The assay itself was found to be sufficiently robust for screening purposes, with an average signal/background ratio of 12.1, a percent coefficient of variation of 9.80%, and a Z′ of 0.59, as determined using the positive and negative controls on each screening plate.
Figure 2.

Layout of GR modulation qHTS assay. The dosing array for the GR modulation screen is shown, with final Dex concentrations along the left and compound library concentrations along the top.
The several steroids in the LOPAC1280 library acted as positive controls (see Supplemental Material). Beclomethasone, betamethasone, corticosterone, cortisol, and triamcinolone all were full agonists, as reported for the induction of tyrosine aminotransferase in HTC cells (48, 49). Estradiol was inactive, and RU486 was a potent antiglucocorticoid. Cortexolone, progesterone, and cortisone all displayed more partial agonist activity (relative to that of Dex) than was seen for tyrosine aminotransferase induction (48, 49). However, the present results are consistent with the ability of partial agonists to display higher amounts of activity with synthetic reporter genes under various conditions (50, 51). We conclude that the correct classification of known steroids is validation of the accuracy of this high-throughput assay.
Comparison of modulatory chemicals in 293 and U2OS cells
Ten compounds displaying the largest changes in absolute value (both positive and negative) for Amax and/or EC50 were selected for further confirmation and more detailed investigation in a different system, ie, induction of a transiently transfected reporter (GREtkLUC) by exogenous GR in U2OS cells (Table 2). The fact that one of the compounds selected, camptothecin, had been previously demonstrated to affect the Amax and EC50 of GR-mediated transactivation under similar conditions in another cell line (CV-1) (52) is additional support for the consistency of the high-throughput assay. Of the 10 compounds from the high-throughput assay in 293 cells (HT in Table 2), 2 caused no significant change in Amax (baclofen and stattic), 2 decreased the Amax (AC93253 and camptothecin), and 3 displayed biphasic changes in Amax with an increase at the lowest concentrations of chemical followed by a decrease at higher concentrations (emetine, phenanthroline, and sanguinarine). An increase in basal activity was seen just with high concentrations of baclofen. The remaining 3 compounds increased the Amax at all concentrations examined (Table 2). Only 1 compound (nocodazole) shifted the EC50 of the dose-response curve to the left to lower Dex concentrations. All of the other chemicals caused a right shift of the dose-response curve by up to 11-fold (Table 2).
Table 2.
Comparison of High-Throughput Screening (293 Cells) vs Competition Assay (U2OS Cells)
| Compound | Concentration Used, μM |
Percent Change in Amax |
Absolute Change in EC50 |
Mechanism | |||||
|---|---|---|---|---|---|---|---|---|---|
| HT | Competition | HT | Competition | Compare | HT | Competition | Compare | ||
| AC93253 | 0.37–9.2 | 0.3–10 | −95 | Down | Same | 0.1 | RS | Same | C |
| Baclofen | 0.37–9.2 | 0.5–12.5 | ≈0a | ≈0 | 1.1 | RS | Same | C | |
| Camptothecin | 0.37–9.2 | 0.5–3 | −50 | Down | Same | 0.7 | RS | Same | C |
| Dihydroouabain | 0.37–9.2 | 1–6 | 107 | Up | Same | 0.5 | RS | Same | A |
| Emetine | 0.37–9.2 | 0.01–0.16 | BP | BP | Same | 0.6 | ≈RS | Same | C |
| Nocodazole | 0.37–9.2 | 3.4–34 | 69 | Up | Same | −0.2 | LS | Same | A |
| NU6027 | 0.37–9.2 | 2.5–25 | 110 | Up | Same | 0.1 | ≈RS | Same | A |
| Phenanthroline | 0.37–9.2 | 2–10 | BP | Up | —b | 0.7 | ≈0 | A | |
| Sanguinarine | 0.37–9.2 | 0.1–2 | BP | ≈0 | —c | 1.1 | RS | Same | C |
| Stattic | 0.37–9.2 | 1–10 | ≈0 | Down | 1.0 | RS | Same | C | |
| Agreement between assays | ≥60% | 90% | |||||||
A, accelerator; BP, biphasic (increase above no compound and then decrease with higher concentrations of compound); C, competitive decelerator; HT, high-throughput; LS, left shift to lower concentrations of compound; RS, right shift to higher concentrations of compound; ≈RS, right shift observed most of the time. Results from the high-throughput screen (n = 1) and competition assays (n = 3–9) are given for the concentration range of compound in each assay, percent change in Amax from that with 100 nM Dex and no added compound, and absolute change in EC50 of dose-response curve for either no added compound or lowest concentration of compound used (a positive number means a shift to higher concentrations of compound). Precise numbers are given for the high-throughput results, whereas qualitative changes are listed for the competition assay because of the varying concentration ranges used, which are usually different from those for the high-throughput screen. Whether the 2 assays give qualitatively the same results is listed under “Compare.” The kinetically determined mechanism (from Table 3) is given under “Mechanism.”
Activity with no Dex = 70% of maximal, with 100 nM Dex = 0% to 15% below maximal or 100% to 85% maximal.
Response in the high-throughput screen is small and biphasic: up 20% at 0.37 and 1.84 μM and then down 30% at 9.2 μM to 10% less than control.
Response in the high-throughput screen is biphasic: goes up from 100% at 0.37 μM to 325% at 1.84 μM, with 1.1 increase in EC50, and then down to 0 at 9.2 μM.
The high-throughput assay was conducted in 293 cells with endogenous GR and stably transfected reporter. For determination of the induction properties of the chemicals of Table 2 in the well-characterized competition assay (41–44, 46, 47), we shifted to U2OS cells with transiently transfected plasmids of both GR and a different reporter, GREtkLUC, for 3 reasons: (1) to examine the chemicals in a different environment, (2) to facilitate analysis of the data because the response with GREtkLUC gives an even higher fold increase with Dex, and (3) to permit studies with various amounts of GR. We were pleased to note that the properties of the 10 chemicals were very similar in the 2 different assays. As shown in Table 2, the qualitative changes in EC50 in the 2 systems are the same for 90% of the chemicals. With Amax, the agreement is at least 60%. Similar results are seen with high concentrations of baclofen, but the increase in basal activity obtained in the high-throughput screen was not observed in the competition assay. U2OS cells also gave a biphasic response in Amax with emetine, such that increasing concentrations of compound first increased and then decreased the Amax, but not with phenanthroline or sanguinarine. It has been reported (PubChem Assay AID 411 at http://pubchem.ncbi.nlm.nih.gov/assay/assay.cgi?aid=411) that sanguinarine can block luciferase enzyme activity. However, in U2OS cells with the relatively low concentrations of sanguinarine in Table 2, no obvious inhibition of luciferase activity was noted. Therefore, in this concentration range, it appears that sanguinarine has effects other than simply inactivating luciferase enzyme. More extensive studies are required to determine whether each biphasic response would also occur in the competition assay but at different concentrations. Thus, it is possible that up to 90% of the chemicals could also have qualitatively identical Amax properties in the 2 assays. In summary, the effects of the 10 chemicals on Amax and EC50 in the 2 assays are very similar despite being in different cell lines with slightly different reporters. Notwithstanding some possible quantitative differences between the 2 systems, every chemical identified as a modulator in the high-throughput assay also modulated GR transactivation in the competition assay. It should be noted that sequencing of the 2 reporters (GREtkLUC and GREtkLUCGREtkAcGFP1-1) revealed very little overlap except for the sequences of GREtkLUC and SV40 poly(A) (data not shown). This argues that the responses of both plasmids are mediated by the common GRE enhancer upstream of tkLUC and not the GRE before tkGFP or some cryptic enhancer/promoter in one of the plasmids. The combined data also suggest that the effects of the 10 chemicals will be similar in other cell systems.
Characterization of prioritized compounds by competition assays
The data from the competition assays for 1/EC50, Amax/EC50, and EC50/Amax were then analyzed graphically (41–44, 46, 47), as described in Materials and Methods, to determine the relative site and kinetically defined mechanism of action of each compound (Table 3).
Table 3.
Critical Graphs From Competition Assays in U2OS Cells With GR Induction of GREtkLUC Reporter
| Chemical (F2) | 1/EC50 vs |
Amax/EC50 vs |
EC50/Amax vs |
Mechanism | |||
|---|---|---|---|---|---|---|---|
| F1 | F2 | F1 | F2 | F1 | F2 | ||
| AC93253 | Slope = 0 (−0.000046 ± 0.010, SD, n = 20, 5 experiments), y-axis intercept < with F2 | Lines intersect at origin, slope < with F2 | Linear, slope < with F1 | GREtkLUC is A = CLS AC93253 is C ≤ CLS | |||
| Baclofen | Slope = 0 (−0.00075 ± 0.0105, SD, n = 12, 3 experiments) | Lines intersect at origin, slope ≤ with F2 | Linear, slope < with F1 | GREtkLUC is A = CLS Baclofen is a weak C ≤ CLS | |||
| Camptothecin | Slope = 0 (−0.0044 ± 0.0070, SD, n = 12, 3 experiments) | Lines intersect at origin, slope < with F2 | Linear, slope < with F1 | GREtkLUC is A = CLS Camptothecin is C ≤ CLS | |||
| Dihydroouabain | slope = 0 (−0.0017 ± 0.016, SD, n = 24, 6 experiments), y-axis intercept < with F2 | Lines intersect at origin, slope > with F2 | Lines intersect at F2 < 0, slope > with F1 | GREtkLUC is A = CLS Dihydroouabain is A > CLS | |||
| Emetine | Slope = 0 (−0.0012 ± 0.0074, SD, n = 16, 4 experiments) | Lines intersect at origin, slope < with F2 | Plots curve up, position < with F1 | GREtkLUC is A = CLS Emetine is C at 2 sites ≤ CLS | |||
| Nocodazole | Slope = 0 (0.0054 ± 0.020, SD, n = 12, 3 experiments), y-axis intercept > with F2 | Lines intersect at origin, slope > with F2 | Lines intersect at F2 < 0, slope > with F1 | GREtkLUC is A = CLS Nocodazole is A > CLS | |||
| NU6027 | Slope = 0 (−0.0023 ± 0.015, SD, n = 12, 3 experiments) | Lines intersect at origin, slope > with F2 | Lines intersect at F2 < 0, slope > with F1 | GREtkLUC is A = CLS NU6027 is A > CLS, | |||
| Phenanthroline | Slope = 0 (−0.011 ± 0.026, SD, n = 20, 5 experiments) | Lines intersect at origin, slope > with F2 | Lines intersect at F2 < 0, slope > with F1 | GREtkLUC is A = CLS Phenanthroline is A > CLS | |||
| Sanguinarine | slope = 0 (0.00026 ± 0.0060, SD, n = 34, 9 experiments), y-axis intercept < with F2 | Lines intersect at origin, slope < with F2 | Linear, slope < with F1 | GREtkLUC is A = CLS Sanguinarine is C ≤ CLS | |||
| Stattic | Slope = 0 (0.0021 ± 0.000196, SD, n = 16, 4 experiments), y-axis intercept < with F2 | Lines intersect at origin, slope < with F2 | Linear, slope < with F1 | GREtkLUC is A = CLS Stattic is C ≤ CLS | |||
A, accelerator; C, competitive decelerator; CLS, concentration limiting step (see text for explanations). GREtkLUC = factor F1 in all entries. The 3 types of graphs (1/EC50, Amax/EC50, and EC50/Amax) vs each factor are listed at the top, with the characteristics of the most informative graphs vs F1 (GREtkLUC) or vs F2 (chemical), listed below the relevant factor. In these columns, “>” and “<” mean “increases” and “decreases” respectively. The unique mechanistic conclusion for each pair is listed at the far right under “Mechanism.” In this column, “ =,” “<,” and “≤” mean “at,” “before,” and “before or at,” respectively.
Three chemicals (AC93253, sanguinarine, and stattic) illustrate how factors can have the same kinetically defined mechanism of action (Table 3) while producing qualitatively different changes in the parameters of GR-regulated gene transactivation (Table 2). First, though, it should be noted that all 3 chemicals give graphs of 1/EC50 vs GREtkLUC reporter that have essentially zero slope (Table 3). As described previously (42, 43), this is diagnostic for the reporter acting as an accelerator at the CLS in all situations. We define an accelerator as a factor that increases the output of the local reaction independent of the observed final response (43). This conclusion regarding reporter action is confirmed by the graphs of Amax/EC50 vs GREtkLUC, which all show linear plots with positive slopes that intersect at the origin (Figure 3, A–C). Furthermore, each of the plots of Amax/EC50 vs GREtkLUC reveal that increasing amounts of chemical cause the position of the plots to decrease (ie, to have a smaller slope). This finding indicates that each chemical is acting as a decelerator. The type of decelerator is defined by the graphs of EC50/Amax vs chemical, each of which is linear and decreases in position with added GREtkLUC reporter (Figure 4, A–C). Collectively, these graphs (and others not shown) identify each chemical as being a competitive decelerator acting before or at the CLS, which is where GREtkLUC is acting as an accelerator (Table 3). It should be noted that althoughAC93253, sanguinarine, and stattic all act as competitive decelerators before or at the CLS, this does not mean that they all act at the same step before or at the CLS. In fact, the different consequences of each chemical for Amax strongly argue that each chemical acts at a different step, thereby yielding unequal final responses. Some of the chemicals cause qualitatively similar, but quantitatively different, responses (eg, AC93253 vs camptothecin). It is possible that these chemicals do act at the same site and differ only in potency.
Figure 3.
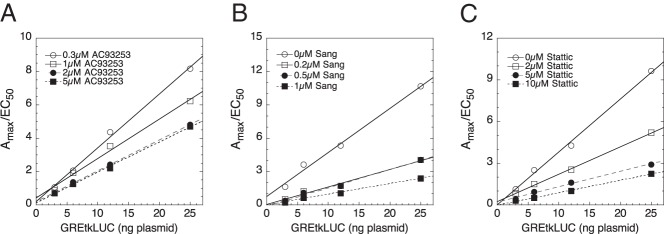
GREtkLUC acts as an accelerator at the CLS. Values of Amax and EC50 from competition assays of the indicated amounts of GREtkLUC plus AC93253 (A), sanguinarine (Sang; B), and stattic (C) were determined and plotted as described in Materials and Methods. Similar results were obtained in 4, 8, and 3 additional independent experiments, respectively.
Figure 4.
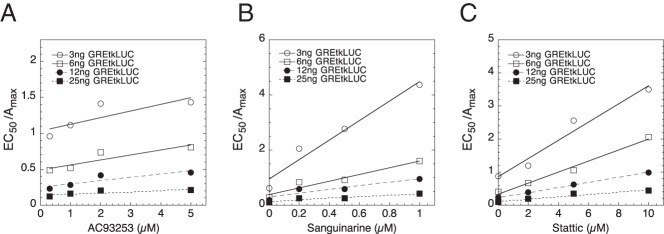
Chemicals acting as a competitive decelerator at or before the CLS. Values of Amax and EC50 from competition assays of the indicated concentrations of GREtkLUC plus AC93253 (A), sanguinarine (B), and stattic (C) were determined and plotted as described in Materials and Methods. Similar results were obtained in 4, 8, and 3 additional independent experiments, respectively.
Three compounds (dihydroouabain, nocodazole, and NU6027) produce qualitatively different changes in EC50 (Table 2) but each is characterized as being an accelerator acting after the CLS, with the GREtkLUC reporter again acting as an accelerator at the CLS (Table 3). The distinguishing features of these types of factors are exemplified by the graphs for nocodazole (Figure 5). Linear graphs of 1/EC50 vs GREtkLUC with zero slope (Figure 5A) and Amax/EC50 vs GREtkLUC with positive slope intersecting at the origin (Figure 5B) restrict GREtkLUC to being an accelerator acting at the CLS. When the graph of Amax/EC50 vs chemical is linear with positive slopes that intersect at an x-axis value that is less that that when the total amount of factor in the cells is 0 (which is 0 in the present case but when exogenous factor is present, 0 total factor corresponds to a negative number) (Figure 5C), then the factor acts as an accelerator after the CLS (42, 44).
Figure 5.
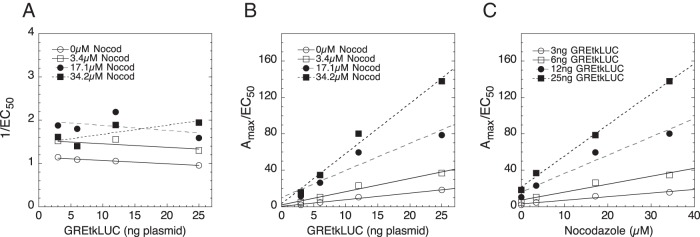
GREtkLUC acts as an accelerator at the CLS in assay with nocodazole (Nocod) acting as an accelerator after the CLS. Values of Amax and EC50 from competition assays of the indicated amounts of GREtkLUC and nocodazole were determined and plotted as 1/EC50 vs GREtkLUC (A), Amax/EC50 vs GREtkLUC (B), and Amax/EC50 vs nocodazole (C) as described in Materials and Methods. Similar results were obtained in 2 additional independent experiments.
Discussion
This study describes the use of a new high-throughput assay to identify compounds that modulate the induction properties of GRs in cells stably transfected with a synthetic reporter gene. The novelty of this assay is that it simultaneously determines both the Amax and the EC50 for steroid-regulated reporter gene induction. To the best of our knowledge, only the Amax has been determined in high-throughput assays up to now (33, 34, 38–40). However, as we have previously documented, the inclusion of EC50 measurements of steroid receptor–mediated transactivation captures more active factors and affords much more information than is possible from just Amax measurements (25, 41, 42). In some instances, the changes in EC50 are more dramatic than those in Amax, in which case the activity of the compound might have been missed if only Amax was monitored (Table 2) (22–26). Furthermore, simple examination of a first-order dose-response curve reveals that relatively small changes in EC50 can result in dramatic changes in the amount of final product. For example, if the concentration of steroid is 1 nM, simply shifting the EC50 of the dose-response curve from 2 to 0.5 nM causes a 200% increase final product. Thus, a high-throughput assay that monitors both Amax and EC50 will detect more biologically relevant modulators.
Of the numerous chemicals in the LOPAC1280 collection of compounds that do affect Amax and/or EC50 of GR-induced reporter gene expression, 10 were further characterized in a different cell line (U2OS vs 293 cells) under significantly different conditions (transient transfection of GR and reporter vs simply adding each chemical). Importantly, the changes in Amax in the 2 different cell lines are qualitatively identical in 60% of the cases and possibly as high as 90%. The agreement is increased to 90% when the modulation of EC50 is monitored. Likewise, camptothecin causes qualitatively identical changes in Amax and EC50 in CV-1 cells with high amounts of transfected GR and exogenous GREtkLUC reporter (52). Collectively, these results suggest that the current high-throughput assay has identified chemicals that will be similarly active in a variety of cell lines and will be of great use in identifying additional chemicals that modulate GR induction properties. It will also be interesting to see whether these identified chemicals can modify the induction properties of other steroid receptors and general transcriptional inducers such as cAMP response element-binding protein, nuclear factor-κB, and G protein-coupled receptors.
The major limitation to the characterization in the competition assay of those chemicals identified by the high-throughput assay is that that dose-response curves must always be first-order Hill plots. This requirement has been met in the current studies, as indicated by the close fit of a first-order plot to the experimental data (R2 = 0.996 ± 0.008 [SD, n = 320; median = 0.9985] for 2 randomly selected experiments for each chemical for a total of 20 experiments, each of 16 dose-response curves). Other important but less frequent limitations are that the theory assumes mass action, which is only valid in the limit of many molecules in a well-mixed medium. Therefore, the theory is not valid if the number of molecules is low and if spatial segregation of the molecules and genes matter. Because the theory is an average measure over many gene copies, it also will not predict what happens at a single isolated gene.
The standard classification of factor action is based on the resulting changes in Amax. By this convention, the data of Table 2 indicate that stattic and sanguinarine would be inactive or unclassifiable. As we have discussed previously (41–44, 46, 47), defining factor activity on the basis of changes in Amax not only is often deceiving but also will miss factors that do not significantly alter the Amax but do modulate the EC50, such as stattic in the high-throughput screen (Table 2). More importantly, the direction of change in Amax with added factor does not yield any information regarding the mechanism of action of the factor. Instead, we have described how a more precise and quantitative approach to determining the mechanism of factor action during GR-regulated transactivation is provided by the quotients of Amax/EC50 and EC50/Amax (42–44, 46, 47).
It is well known from enzyme kinetics that an inhibitor of a reaction step can cause an increase in the amount of observed product and vice versa (41, 53, 54). For this reason, we have introduced a different classification, based on kinetically defined properties and characterized by the competition assay of the accelerator and several types of decelerators (43). The specific mechanism of a given factor is readily uncovered by the competition assay of the present study. With this assay, AC93253, camptothecin, sanguinarine, and stattic are all competitive decelerators, despite causing quantitatively different changes in Amax (Table 2), and nocodazole is an accelerator (Table 3). This kinetically defined mechanism of action has the frequent additional value of mechanistic simplicity. For example, if a factor raises the final level of GR-regulated gene A and reduces the level of GR-regulated gene B, current classifications of the factor activity as coactivator or corepressor (respectively) suggest that different treatments would be required to modify factor activity with both gene A and gene B. However, if analysis by the competition assays indicates that the factor acts by the same kinetically defined mechanism in GR-modified expression of genes A and B, it is likely that reversal of the factor's ability to increase gene A levels will simultaneously diminish the reduction of gene B levels. In fact, we have recently found that 2 of the chemicals examined here (NU6027 and phenanthroline) plus the p160 coactivator TIF2 all retain the same mechanism of action in GR-controlled gene induction and gene repression (Chow, C.C. et al, unpublished data). This finding suggests that factor action in GR-modulated gene expression could be independent of both the gene and the direction of change in final product.
A final benefit of the competition assay is that it specifies where in the present poorly defined series of steps in gene induction the factor acts, both with regard to other factors and to the position-invariant CLS, where the reporter gene acts as an accelerator (43). Molecules that act downstream of the CLS, and thus closer to the observed final response are expected to have fewer side effects than molecules acting before the CLS, simply because there are fewer reaction steps that can be altered by the chemical. How each chemical would affect the activity of selected glucocorticoids with synthetic reporters and endogenous genes is an important question requiring additional studies that are beyond the scope of this study. An additional application of the present results is for those genes for which the dose-response curve is unequally positioned and/or differentially shifted by the presence of a factor such as TIF2 (55). In these cases, an even greater separation of the dose-response curves would be expected in the presence of one of the chemical accelerators of the current study, which means that even lower concentrations of glucocorticoid would be needed to induce those genes with the lower EC50 values. Conversely, the lower steroid levels would result in diminished induction of those genes with higher EC50 values. This observation has exciting clinical possibilities for reducing the unwanted consequences that currently restrict the frequency and duration of glucocorticoid therapy (2, 8).
Of the 10 modulatory chemicals that have been characterized in this article, we are aware of published reports for just 4 that influence GR transactivation: camptothecin, nocodazole, phenanthroline, and sanguinarine. Camptothecin is the only compound previously shown to affect the EC50 of transactivation. Camptothecin reduced Amax and had even more robust effects on EC50 in the presence of the coactivator Ubc9 (52). Nocodazole was reported to decrease GR transactivation, presumably via disruption of microtubule-mediated nuclear transport of GRs (56). However, another disrupter of microtubule function, vincristine, was found to have negligible effects on either Amax or EC50 in our high-throughput assay (see Supplemental Material). This result suggests that nocodazole is acting via a pathway that is independent of microtubule formation. It has been known for many years that phenanthroline inhibits DNA binding of activated GR complexes (57). We see phenanthroline decreasing Amax (Table 2), but the competition assay defines phenanthroline as an accelerator acting after the CLS and after the GREtkLUC reporter, which indicates a different mode of action of phenanthroline in our system. Sanguinarine increased the nuclear localization of Dex-bound GR complexes but had no effect on GR transactivation (58). It is difficult to compare this report to the current study because of our observation of a biphasic dose-response curve, which would dramatically alter the response, depending on the concentration examined. It is true that that several of the 10 modulatory chemicals are known to induce toxicity in certain cell lines. However, we did not see any evidence of toxicity in our 18-hour competition assay. Thus, it is reasonable to conclude both that the effects that we report are GR-mediated and that derivatives can be produced that will preserve, or even increase, potency while reducing toxicity.
The high-throughput assay described in this article has identified numerous modulatory small molecules. The 10 most active, as defined by producing the largest changes in Amax and/or EC50, have been further characterized by the competition assay and confirmed as modulatory agents of GR transactivation, yielding a positive discovery rate of 0.78%. Therefore, it is not unreasonable to expect that the current high-throughput assay will identify numerous other small molecules that can modulate GR activities in other larger libraries. In addition, given additional chemically tractable lead molecules, further structure-activity work should yield more potent analogs that are active in the submicromolar range and could be clinically useful. Such small molecules have numerous advantages over cofactors that are also known to modulate GR transactivation properties, such as TIF2, CBP, SMRT, PA1, NELF-A, NELF-B, Cdk9, and ELL (42–44, 46, 47). From a therapeutic standpoint, small molecules often have fewer hurdles in terms of production and administration and, in the case of repurposed drugs, may already have preexisting data on toxicity and side effects, all of which would accelerate bench-to-bedside applications. Given the greater mechanistic information that can now be obtained, renewed investigation of small molecules as modulators of GR transactivation appears both timely and warranted.
Additional material
Supplementary data supplied by authors.
Acknowledgments
Current address for M.P.: Cancer Biology, NB40, Cleveland Clinic, Lerner Research Institute, 9500 Euclid Avenue, Cleveland, OH 44195.
Current address for D.S.A.: Lead Finding Platform, Center for Proteomic Chemistry, Novartis Institutes for BioMedical Research, Inc., Cambridge, MA 02139.
This work was supported by the Intramural Research Program of the National Institutes of Health (NIH), National Institute of Diabetes and Digestive and Kidney Diseases and National Center for Advancing Translational Sciences, and the Molecular Libraries Program of the NIH Common Fund., and the Molecular Libraries Initiative of the NIH Roadmap for Medical Research (Grant U54MH084681).
Disclosure Summary: The authors have nothing to disclose.
Footnotes
- AF
- activation function
- CLS
- concentration limiting step
- Dex
- dexamethasone
- EtOH
- ethanol
- FACS
- fluorescence-activated cell sorting
- GFP
- green fluorescent protein
- GR
- glucocorticoid receptor
- GRE
- glucocorticoid response element
- LBD
- ligand-binding domain
- qHTS
- quantitative high-throughput screening
- qRT-PCR
- quantitative RT-PCR
- TIF2
- transcriptional intermediary factor 2
- TS
- thromboxane synthase.
References
- 1. Anbalagan M, Huderson B, Murphy L, Rowan BG. Post-translational modifications of nuclear receptors and human disease. Nucl Recept Signal. 2012;10:e001. [DOI] [PMC free article] [PubMed] [Google Scholar]
- 2. Schäcke H, Döcke WD, Asadullah K. Mechanisms involved in the side effects of glucocorticoids. Pharmacol Ther. 2002;96:23–43. [DOI] [PubMed] [Google Scholar]
- 3. Pratt WB, Toft DO. Steroid receptor interactions with heat shock protein and immunophilin chaperones. Endocr Rev. 1997;18:306–360. [DOI] [PubMed] [Google Scholar]
- 4. Lonard DM, O'Malley BW. Nuclear receptor coregulators: judges, juries, and executioners of cellular regulation. Mol Cell. 2007;27:691–700. [DOI] [PubMed] [Google Scholar]
- 5. Stahn C, Löwenberg M, Hommes DW, Buttgereit F. Molecular mechanisms of glucocorticoid action and selective glucocorticoid receptor agonists. Mol Cell Endocrinol. 2007;275:71–78. [DOI] [PubMed] [Google Scholar]
- 6. Simons SS., Jr Glucocorticoid receptor cofactors as therapeutic targets. Curr Opin Pharmacol. 2010;10:613–619. [DOI] [PMC free article] [PubMed] [Google Scholar]
- 7. Kassel O, Herrlich P. Crosstalk between the glucocorticoid receptor and other transcription factors: molecular aspects. Mol Cell Endocrinol. 2007;275:13–29. [DOI] [PubMed] [Google Scholar]
- 8. Simons SS, Jr, Edwards DP, Kumar R. Minireview: Dynamic structures of nuclear hormone receptors: new promises and challenges. Mol Endocrinol. 2014;28:173–182. [DOI] [PMC free article] [PubMed] [Google Scholar]
- 9. Schäcke H, Berger M, Rehwinkel H, Asadullah K. Selective glucocorticoid receptor agonists (SEGRAs): novel ligands with an improved therapeutic index. Mol Cell Endocrinol. 2007;275:109–117. [DOI] [PubMed] [Google Scholar]
- 10. Schoch GA, D'Arcy B, Stihle M, et al. Molecular switch in the glucocorticoid receptor: active and passive antagonist conformations. J Mol Biol. 2010;395:568–577. [DOI] [PubMed] [Google Scholar]
- 11. Brzozowski AM, Pike AC, Dauter Z, et al. Molecular basis of agonism and antagonism in the oestrogen receptor. Nature. 1997;389:753–758. [DOI] [PubMed] [Google Scholar]
- 12. Suino-Powell K, Xu Y, Zhang C, et al. Doubling the size of the glucocorticoid receptor ligand binding pocket by deacylcortivazol. Mol Cell Biol. 2008;28:1915–1923. [DOI] [PMC free article] [PubMed] [Google Scholar]
- 13. Biggadike K, Bledsoe RK, Coe DM, et al. Design and x-ray crystal structures of high-potency nonsteroidal glucocorticoid agonists exploiting a novel binding site on the receptor. Proc Natl Acad Sci USA. 2009;106:18114–18119. [DOI] [PMC free article] [PubMed] [Google Scholar]
- 14. Meijsing SH, Pufall MA, So AY, Bates DL, Chen L, Yamamoto KR. DNA binding site sequence directs glucocorticoid receptor structure and activity. Science. 2009;324:407–410. [DOI] [PMC free article] [PubMed] [Google Scholar]
- 15. Watson LC, Kuchenbecker KM, Schiller BJ, Gross JD, Pufall MA, Yamamoto KR. The glucocorticoid receptor dimer interface allosterically transmits sequence-specific DNA signals. Nat Struct Mol Biol. 2013;20:876–883. [DOI] [PMC free article] [PubMed] [Google Scholar]
- 16. Simons SS, Jr, Kumar R. Variable steroid receptor responses: intrinsically disordered AF1 is the key. Mol Cell Endocrinol. 2013;376:81–84. [DOI] [PMC free article] [PubMed] [Google Scholar]
- 17. York B, O'Malley BW. Steroid receptor coactivator (SRC) family: masters of systems biology. J Biol Chem. 2010;285:38743–38750. [DOI] [PMC free article] [PubMed] [Google Scholar]
- 18. Hittelman AB, Burakov D, Iñiguez-Lluhi JA, Freedman LP, Garabedian MJ. Differential regulation of glucocorticoid receptor transcriptional activation via AF-1-associated proteins. EMBO J. 1999;18:5380–5388. [DOI] [PMC free article] [PubMed] [Google Scholar]
- 19. Copik AJ, Webb MS, Miller AL, Wang Y, Kumar R, Thompson EB. Activation function 1 of glucocorticoid receptor binds TATA-binding protein in vitro and in vivo. Mol Endocrinol. 2006;20:1218–1230. [DOI] [PubMed] [Google Scholar]
- 20. Wang D, Wang Q, Awasthi S, Simons SS., Jr Amino-terminal domain of TIF2 is involved in competing for corepressor binding to glucocorticoid and progesterone receptors. Biochemistry. 2007;46:8036–8049. [DOI] [PubMed] [Google Scholar]
- 21. Khan SH, Awasthi S, Guo C, et al. Binding of the N-terminal region of coactivator TIF2 to the intrinsically disordered AF1 domain of the glucocorticoid receptor is accompanied by conformational reorganizations. J Biol Chem. 2012;287:44546–44560. [DOI] [PMC free article] [PubMed] [Google Scholar]
- 22. Reichardt HM, Umland T, Bauer A, Kretz O, Schütz G. Mice with an increased glucocorticoid receptor gene dosage show enhanced resistance to stress and endotoxic shock. Mol Cell Biol. 2000;20:9009–9017. [DOI] [PMC free article] [PubMed] [Google Scholar]
- 23. Simons SS., Jr The importance of being varied in steroid receptor transactivation. Trends Pharmacol Sci. 2003;24:253–259. [DOI] [PubMed] [Google Scholar]
- 24. Simons SS., Jr How much is enough? Modulation of dose-response curve for steroid receptor-regulated gene expression by changing concentrations of transcription factor. Curr Top Med Chem. 2006;6:271–285. [DOI] [PubMed] [Google Scholar]
- 25. Awasthi S, Simons SS., Jr Separate regions of glucocorticoid receptor, coactivator TIF2, and comodulator STAMP modify different parameters of glucocorticoid-mediated gene induction. Mol Cell Endocrinol. 2012;355:121–134. [DOI] [PMC free article] [PubMed] [Google Scholar]
- 26. Han DH, Lee YJ, Kim K, Kim CJ, Cho S. Modulation of glucocorticoid receptor induction properties by core circadian clock proteins. Mol Cell Endocrinol. 2014;383:170–180. [DOI] [PubMed] [Google Scholar]
- 27. Karim FD, Thummel CS. Temporal coordination of regulatory gene expression by the steroid hormone ecdysone. EMBO J. 1992;11:4083–4093. [DOI] [PMC free article] [PubMed] [Google Scholar]
- 28. Wang D, Simons SS., Jr Corepressor binding to progesterone and glucocorticoid receptors involves the activation function-1 domain and is inhibited by molybdate. Mol Endocrinol. 2005;19:1483–1500. [DOI] [PubMed] [Google Scholar]
- 29. Sun Y, Tao Y, Kagan BL, He Y, Simons SS., Jr Modulation of transcription parameters in glucocorticoid receptor-mediated repression. Mol Cell Endocrinol. 2008;295:59–69. [DOI] [PMC free article] [PubMed] [Google Scholar]
- 30. Norris JD, Paige LA, Christensen DJ, et al. Peptide antagonists of the human estrogen receptor. Science. 1999;285:744–746. [DOI] [PubMed] [Google Scholar]
- 31. McDonnell DP, Wardell SE. The molecular mechanisms underlying the pharmacological actions of ER modulators: implications for new drug discovery in breast cancer. Curr Opin Pharmacol. 2010;10:620–628. [DOI] [PMC free article] [PubMed] [Google Scholar]
- 32. Parent AA, Gunther JR, Katzenellenbogen JA. Blocking estrogen signaling after the hormone: pyrimidine-core inhibitors of estrogen receptor-coactivator binding. J Med Chem. 2008;51:6512–6530. [DOI] [PMC free article] [PubMed] [Google Scholar]
- 33. Hwang JY, Arnold LA, Zhu F, et al. Improvement of pharmacological properties of irreversible thyroid receptor coactivator binding inhibitors. J Med Chem. 2009;52:3892–3901. [DOI] [PMC free article] [PubMed] [Google Scholar]
- 34. Estébanez-Perpiñá E, Arnold AA, Nguyen P, et al. A surface on the androgen receptor that allosterically regulates coactivator binding. Proc Natl Acad Sci USA. 2007;104:16074–16079. [DOI] [PMC free article] [PubMed] [Google Scholar]
- 35. Shapiro DJ, Mao C, Cherian MT. Small molecule inhibitors as probes for estrogen and androgen receptor action. J Biol Chem. 2011;286:4043–4048. [DOI] [PMC free article] [PubMed] [Google Scholar]
- 36. Mao C, Patterson NM, Cherian MT, et al. A new small molecule inhibitor of estrogen receptor α binding to estrogen response elements blocks estrogen-dependent growth of cancer cells. J Biol Chem. 2008;283:12819–12830. [DOI] [PMC free article] [PubMed] [Google Scholar]
- 37. Andersen RJ, Mawji NR, Wang J, et al. Regression of castrate-recurrent prostate cancer by a small-molecule inhibitor of the amino-terminus domain of the androgen receptor. Cancer Cell. 2010;17:535–546. [DOI] [PubMed] [Google Scholar]
- 38. Moore TW, Mayne CG, Katzenellenbogen JA. Minireview: Not picking pockets: nuclear receptor alternate-site modulators (NRAMs). Mol Endocrinol. 2010;24:683–695. [DOI] [PMC free article] [PubMed] [Google Scholar]
- 39. Gerber AN, Masuno K, Diamond MI. Discovery of selective glucocorticoid receptor modulators by multiplexed reporter screening. Proc Natl Acad Sci USA. 2009;106:4929–4934. [DOI] [PMC free article] [PubMed] [Google Scholar]
- 40. Li H, Redinbo MR, Venkatesh M, et al. Novel yeast-based strategy unveils antagonist binding regions on the nuclear xenobiotic receptor PXR. J Biol Chem. 2013;288:13655–13668. [DOI] [PMC free article] [PubMed] [Google Scholar]
- 41. Ong KM, Blackford JA, Jr, Kagan BL, Simons SS, Jr, Chow CC. A theoretical framework for gene induction and experimental comparisons. Proc Natl Acad Sci USA. 2010;107:7107–7112. [DOI] [PMC free article] [PubMed] [Google Scholar]
- 42. Dougherty EJ, Guo C, Simons SS, Jr, Chow CC. Deducing the temporal order of cofactor function in ligand-regulated gene transcription: theory and experimental verification. PLoS One. 2012;7:e30225. [DOI] [PMC free article] [PubMed] [Google Scholar]
- 43. Blackford JA, Jr, Guo C, Zhu R, Dougherty EJ, Chow CC, Simons SS., Jr 2012 Identification of location and kinetically defined mechanism of cofactors and reporter genes in the cascade of steroid-regulated transactivation. J Biol Chem. 287:40982–40995. [DOI] [PMC free article] [PubMed] [Google Scholar]
- 44. Zhu R, Lu X, Pradhan M, et al. 2014 A kinase-independent activity of Cdk9 modulates glucocorticoid receptor-mediated gene induction. Biochemistry. 2014;53:1753–1767. [DOI] [PMC free article] [PubMed] [Google Scholar]
- 45. Wang Q, Blackford JA, Jr, Song LN, Huang Y, Simons SS., Jr Equilibrium interactions of corepressors and coactivators with agonist and antagonist complexes of glucocorticoid receptors. Mol Endocrinol. 2004;18:1376–1395. [DOI] [PubMed] [Google Scholar]
- 46. Luo M, Lu X, Zhu R, Zhang Z, Chow CC, Li R, Simons SS., Jr A conserved protein motif is required for full modulatory activity of negative elongation factor subunits NELF-A and NELF-B in modifying glucocorticoid receptor-regulated gene induction properties. J Biol Chem. 2013;288:34055–34072. [DOI] [PMC free article] [PubMed] [Google Scholar]
- 47. Zhang Z, Sun Y, Cho YW, Chow CC, Simons SS., Jr PA1 protein, a new competitive decelerator acting at more than one step to impede glucocorticoid receptor-mediated transactivation. J Biol Chem. 2013;288:42–58. [DOI] [PMC free article] [PubMed] [Google Scholar]
- 48. Rousseau GG, Schmit J-P. Structure-activity relationships for glucocorticoids—I. Determination of receptor binding and biological activity. J Steroid Biochem. 1977;8:911–919. [DOI] [PubMed] [Google Scholar]
- 49. Ojasoo T, Doré JC, Gilbert J, Raynaud J-P. Binding of steroids to the progestin and glucocorticoid receptors analyzed by correspondence analysis. J Med Chem. 1988;31:1160–1169. [DOI] [PubMed] [Google Scholar]
- 50. Szapary D, Xu M, Simons SS., Jr Induction properties of a transiently transfected glucocorticoid-responsive gene vary with glucocorticoid receptor concentration. J Biol Chem. 1996;271:30576–30582. [DOI] [PubMed] [Google Scholar]
- 51. Szapary D, Huang Y, Simons SS., Jr Opposing effects of corepressor and coactivators in determining the dose-response curve of agonists, and residual agonist activity of antagonists, for glucocorticoid receptor-regulated gene expression. Mol Endocrinol. 1999;13:2108–2121. [DOI] [PubMed] [Google Scholar]
- 52. Kim Y, Sun Y, Chow C, Pommier YG, Simons SS., Jr Effects of acetylation, polymerase phosphorylation, and DNA unwinding in glucocorticoid receptor transactivation. J Steroid Biochem Mol Biol. 2006;100:3–17. [DOI] [PubMed] [Google Scholar]
- 53. Fromm HJ. Initial rate enzyme kinetics. Berlin: Springer-Verlag; 1975. [Google Scholar]
- 54. Segel IH. Enzyme kinetics: behavior and analysis of rapid equilibrium and steady-state enzyme systems. New York: Wiley; 1993. [Google Scholar]
- 55. Luo M, Simons SS., Jr Modulation of glucocorticoid receptor induction properties by cofactors in peripheral blood mononuclear cells. Hum Immunol. 2009;70:785–789. [DOI] [PMC free article] [PubMed] [Google Scholar]
- 56. Dvorak Z, Modriansky M, Pichard-Garcia L, et al. Colchicine down-regulates cytochrome P450 2B6, 2C8, 2C9, and 3A4 in human hepatocytes by affecting their glucocorticoid receptor-mediated regulation. Mol Pharmacol. 2003;64:160–169. [DOI] [PubMed] [Google Scholar]
- 57. Schmidt TJ, Sekula BC, Litwack G. The effects of 1,10-phenanthroline on the binding of activated rat hepatic glucocorticoid-receptor complexes to deoxyribonucleic acid-cellulose. Endocrinology. 1981;109:803–812. [DOI] [PubMed] [Google Scholar]
- 58. Dvorák Z, Vrzal R, Maurel P, Ulrichová J. Differential effects of selected natural compounds with anti-inflammatory activity on the glucocorticoid receptor and NF-κB in HeLa cells. Chem Biol Interact. 2006;159:117–128. [DOI] [PubMed] [Google Scholar]
Associated Data
This section collects any data citations, data availability statements, or supplementary materials included in this article.