

Abstract
Major aspects of neuronal function are regulated by Ca2+ including neurotransmitter release, excitability, developmental plasticity, and gene expression. We reported previously that sensory neurons isolated from a mouse model with a heterozygous mutation of the Nf1 gene (Nf1+/−) exhibited both greater excitability and evoked release of neuropeptides compared to wildtype mice. Furthermore, augmented voltage-dependent sodium currents but not potassium currents contribute to the enhanced excitability. To determine the mechanisms giving rise to the enhanced release of substance P and calcitonin gene-related peptide in the Nf1+/− sensory neurons, the potential differences in the total voltage-dependent calcium current (ICa) as well as the contributions of individual Ca2+ channel subtypes were assessed. Whole-cell patch-clamp recordings from small diameter capsaicin-sensitive sensory neurons demonstrated that the average peak ICa densities were not different between the two genotypes. However, by using selective blockers of channel subtypes, the current density of N-type (Cav2.2) ICa was significantly larger in Nf1+/− neurons compared to wildtype neurons. In contrast, there were no significant differences in L-, P/Q- and R-type currents between the two genotypes. Quantitative real-time PCR measurements made from the isolated but intact dorsal root ganglia indicated that N-type (Cav2.2) and P/Q-type (Cav2.1) Ca2+ channels exhibited the highest mRNA expression levels although there were no significant differences in the levels of mRNA expression between the genotypes. These results suggest that the augmented N-type (Cav2.2) ICa observed in the Nf1+/− sensory neurons does not result from genomic differences but may reflect post-translational or some other non-genomic modifications. Thus, our results demonstrate that sensory neurons from Nf1+/− mice, exhibit increased N-type ICa and likely account for the increased release of substance P and calcitonin gene-related peptide that occurs in Nf1+/− sensory neurons.
Keywords: neurofibromatosis, calcium channels, dorsal root ganglia, qPCR, mRNA
Introduction
Neurofibromatosis type 1 (Nf1) is a common genetic disorder characterized by tumor formation. People with Nf1 also experience a more intense painful response to stimuli than do unaffected individuals. It is likely that these abnormal painful states involve the sensitization of small diameter nociceptive sensory neurons that are known to mediate the transmission of pain and itch. Previously, we demonstrated that small diameter capsaicin-sensitive sensory neurons isolated from mice with a heterozygous mutation of the Nf1 gene (coding for the protein neurofibromin) have augmented excitability compared to wildtype neurons (Wang et al., 2005). Consistent with this enhanced excitability, the peak current densities for both tetrodotoxin-sensitive and –resistant sodium currents (Wang et al., 2010a) as well as the expression of mRNA for specific sodium channel subtypes (Hodgdon et al., 2012) were significantly larger in Nf1+/− sensory neurons. However, neither delayed rectifier nor A-type potassium currents were altered in Nf1+/− neurons (Wang et al., 2010a). Furthermore, stimulus-evoked release of the neuropeptides, substance P and calcitonin gene-related peptide (CGRP), was significantly higher from sensory neurons isolated from Nf1+/− mice (Hingtgen et al., 2006). Therefore, it is reasonable to speculate that the calcium currents and/or expression of these channels is higher in adult sensory neurons with heterozygous mutation of the Nf1 gene (Nf1+/−) than that of wildtype cells.
Multiple experimental approaches established that voltage-dependent Ca2+ channels are important for neurotransmitter release (Catterall, 2000; Catterall et al., 2005; Catterall and Few, 2008; Neher and Sakaba, 2008; Atlas, 2013) and nociceptive neurotransmission (Malmberg and Yaksh, 1994; Kim et al., 2001; Saegusa et al., 2001; Winquist et al., 2005; Cregg et al., 2010; Todorovic and Jevtovic-Todorovic, 2011; Lipscombe et al., 2013). Based on molecular, biophysical, and pharmacological properties, high threshold voltage-activated Ca2+ channels have been classified into L, N, P/Q and R subtypes (Fox et al. 1987; Diochot et al., 1995; Jones 1998; Triggle, 1999; Dolphin, 2009). The variety of Ca2+ channels found in neuronal membranes suggests that each type plays a distinct physiological role. For instance, L- and N-type currents are considered to play key roles in dendritic spiking as well as neurotransmitter release. Sensory neurons of the dorsal root ganglia (DRG) are functionally diverse and contain various neurotransmitters as well as receptors and ion channels. Our previous work demonstrated that both the excitability and transmitter release of sensory neurons are enhanced in sensory neurons isolated from Nf1+/− mice compared to the wildtype (Wang et al., 2005; Hingtgen et al., 2006). Although multiple classes of Ca2+ channels are expressed in DRG sensory neurons, the contribution of each specific channel subtype to the total Ca2+ current in Nf1+/− sensory neurons has not been established. To determine this, we used whole-cell patch clamp recordings and real-time quantitative PCR to assess the extent of different subtypes of calcium channels from small-diameter wildtype and Nf1+/− sensory neurons. In this report, we demonstrate that the average peak ICa densities were not different between the two genotypes. However, N-type currents were significantly larger in Nf1+/− neurons although the mRNA levels were not different between the genotypes. These results demonstrate that sensory neurons from Nf1+/− mice, exhibit increased N-type Ca2+ currents and this likely accounts for the increased release of neuropeptides that occurs in Nf1+/− sensory neurons. Part of this work has been published in abstract form (Duan et al., 2010).
Experimental Procedures
Animals
Mice, a C57BL/6J background, were heterozygous for the Nf1 mutation; these mice were originally created by Dr. Tyler Jacks (Jacks et al., 1994). Mice were housed and bred in the Indiana University Laboratory Animal Research Center and had free access to food and water. These mice were used according to the guidelines in the National Institute of Health Guide for Care and Use of Laboratory Animals (NIH Publications No. 80-23) revised 1996.
Isolation and maintenance of mouse sensory neurons
With some modifications to the protocol developed by Lindsay (1988), sensory neurons were isolated from young adult mice (1–2 months of age). In our studies, both wildtype and Nf1+/− mice were littermates. Male mice were killed by putting them in a chamber containing CO2. The dorsal root ganglia (DRG) were harvested from the isolated spinal column, the ganglia were placed in a culture dish containing sterilized Pucks solution that was composed of (in mM): 171 NaCl, 6.7 KCl, 1.6 Na2PO4, 0.5 KH2PO4, 6 D-glucose, and 0.01% phenol red, pH 7.3. The ganglia were placed into a conical tube containing Pucks solution and papain (10 ng/ml); ganglia were digested for 10–12 min at 37º C after which they were moved to a conical tube containing F-12 medium with 1 mg/ml collagenase 1A and 2.5 mg/ml dispase. After an incubation for 10–15 min at 37º C, the tube was centrifuged at low speed (2000 x g) for 30 s, whereupon the enzyme-containing supernatant was removed. F-12 medium was used to resuspend the pellet, which was then mechanically dissociated with fire-polished pipettes. Cells were plated onto poly-D-lysine- and laminin- coated plastic cover slips. The cells were bathed in F-12 medium supplemented with 10% horse serum, 100 μg/ml normocin, 50 μM 5-fluoro-2′-deoxyuridine, 50 μg/ml penicillin and streptomycin, 2 mM glutamine, 150 μM uridine at 37° C and 3% CO2. The cells were used within 12–48 hr for electrophysiological recordings. The Animal Use and Care Committee of the Indiana University School of Medicine approved all procedures.
Electrophysiology
The whole-cell patch-clamp recording technique was used as previously described (Wang et al. 2010a). Neurons were bathed in normal Ringers of the following composition (mM): 140 NaCl, 5 KCl, 2 CaCl2, 1 MgCl2, 10 HEPES and 10 glucose, pH adjusted to 7.4 with NaOH. A VC-8 bath perfusion system (Warner Instruments, Hamden, CT) was used to superfuse the recording chamber. An Axopatch 200B amplifier (Molecular Devices, Sunnyvale, CA) was used to record whole-cell currents, which were established in normal Ringers. The data were obtained as well as analyzed with the pCLAMP 9.2 suite (Molecular Devices).
To isolate ICa, neurons were superfused with a Ringers solution composed of (in mM): NMG-Cl 110, TEA-Cl 30, CaCl2 2, HEPES 10, glucose 10, pH 7.4, adjusted with TEA-OH; 500 nM TTX was added to this solution on the day of recording. Pipettes used in these recordings were pulled from capillary glass tubing (Model G85165T-4, Warner Instruments); resistances of 1–3 MΩ were determined when filled with the following solution (mM): CsCl 100, EGTA 10, MgCl2 1, Na3GTP 0.3, Na2ATP 4, HEPES 30; pH 7.2, adjusted with CsOH. The data were acquired at 10 kHz and filtered at 5 kHz. Leakage currents were subtracted by using the P/4 protocol. Series resistance was compensated between 60–80%. Cell capacitance was determined by using the membrane test feature of Clampex. The peak current amplitude established the current-voltage relation for ICa. Activation of ICa was measured by using a holding voltage of −90 mV with voltage steps 200 ms in duration applied at 5 s intervals in +10 mV increments from −90 to +60 mV. Current density was calculated as peak ICa/cell capacitance. Steady-state inactivation of ICa was determined by applying an 800 ms conditioning prepulse (−100 to −20 mV in +10 mV increments) after which the voltage was stepped to −20 mV for 200 ms; a 15 s interval separated each acquisition.
To determine the relative contribution of individual Ca2+ channel subtypes to the total ICa, the following selective blockers were used: 5 μM nifedipine (L-type, Cav1), 200 nM ω-agatoxin IVA (AgTx, P/Q-type, Cav2.1), 200 nM ω-conotoxin GVIA (CTx, N-type, Cav2.2), and 200 nM SNX-482 (R-type, Cav2.3). In this series of experiments, the current-voltage relation for ICa was assessed under control conditions. Upon determining the voltage at which the peak ICa was obtained, a single voltage step (typically −20 mV from a holding potential of −90 mV) was repeated every 15 s to establish the total ICa and then the subsequent remaining current after exposure to the various blockers. For each condition, steady-state inhibition (a minimum of 3 consecutive current recordings showing no further inhibition) was achieved before the neuron was exposed to a different blocker. In all experiments, CTx and nifedipine were applied in different orders via external superfusion of the recording chamber, whereas AgTx and SNX-482 were applied directly to the bath from concentrated stock solutions. At the termination of a recording, the cell was exposed to normal Ringers containing 1 μM capsaicin. Responsivity to capsaicin has been used as a measure of nociceptive sensory neurons (Holzer 1991). Neurons were determined to be sensitive to capsaicin if the membrane depolarized and/or the cell fired action potentials in response to this agent. However, the correlation between capsaicin sensitivity and a nociceptor is not absolute as some nociceptive neurons are insensitive to capsaicin and some capsaicin-sensitive neurons lack nociceptive properties (see Petruska et al., 2000). Thus, capsaicin sensitivity defined a population of small diameter sensory neurons that could function in a nociceptive capacity. The results described were obtained from only capsaicin-sensitive neurons. All experiments were performed at room temperature (~23° C).
Real-Time quantitative PCR (qPCR)
The DRG were isolated from young adult mice (~2 months old). The wildtype and Nf1+/− mice used in these studies were littermates. Briefly, mice were killed by placing them in a CO2 chamber and the spinal column was removed. Lumbar, cervical and thoracic DRG were collected and trimmed in cold, sterilized Puck’s solution. The ganglia were then transferred to a conical tube and washed with sterilized PBS. Tissues were stored at −80° C and processed within two days. The methods for isolation of total RNA and the protocols used for the SYBR® Green quantitative PCR (qPCR) are described in detail in Zhang et al. (2012) and Hodgdon et al. (2012). Calcium channel primers were designed and targeted against mouse transcripts using PrimerExpress® software v3.0 (Applied Biosystems) and were based on previous publications (Chameau et al., 2006; Andrade et al., 2007; Grimm et al., 2008). As reference genes for normalization of the qPCR results, both hypoxanthine-guanine phosphoribosyl transferase (HPRT) and acidic ribosomal protein P0 (Arbp) were used. Table 1 describes the accession number(s), amplicon size and position, primer sequences, and efficiencies for all genes targeted in this study. Analysis of the levels of expression for the Cav subtypes and the statistical analysis of the differences in expression are described in detail in Hodgdon et al. (2012).
Table 1.
Sequences and calculated efficiencies for Cav and reference gene primers
| Gene | Acc No | Prod (bp) | Pos | Seq (5′ to 3′) | Efficiency |
|---|---|---|---|---|---|
| Cav1.2 | NM_009781.3 | 74 | 5736..5809 | f- GAGCCACGGTGAATCAGGA r- GCAGTACTCGGCTTCTTCACTCA |
1.992 |
| Cav1.3 | NM_028981.2 | 89 | 463..551 | CATCCGAAGAGCCTGCATTAGTATA CTAAGGCCACACAATTGGCAAAA |
1.968 |
| Cav2.1 | NM_007578.3 | 117 | 6573..6690 | GAGGAGAACCAACGGTACCAC TGGTCATGCTCAGATCTGTCC |
1.961 |
| Cav2.2 | NM_001042528.1 | 79 | 5708..5786 | TTCGGCAAAAGAGTGCAACTT GACAGCGACTCCTTGATGCC |
1.974 |
| Cav2.3 | NM_009782.3 | 88 | 5794..5879 | CCTGAGTGGTCGGAGTGGATA CATCCGCTGGGTCCATACA |
2.003 |
| HPRT | NM_012583 | 278 | 495..772 | GCAGACTTTGCTTTCCTTGG TACTGGCCACATCAACAGGA |
1.875 |
| Arbp | NM_022402.1 | 57 | 913..970 | CAGCCAAGGTCGAAGCAAA CCGAATCCCATGTCCTCATC |
1.906 |
Acc No: Accession Number; Prod (bp): amplicon size in base pairs; Pos: amplicon start and finish positions in NCBI Reference Sequence; Seq: targeted sequence, listed first is the forward primer (f), second is the reverse primer (r).
Data analysis
All values represent the mean ± S.E.M, unless noted otherwise. The Boltzmann relation was used to determine the voltage dependence for activation of ICa wherein the conductance-voltage curve was fit by the equation G/Gmax = 1/ [1 + exp (V0.5 − Vm)/k], where G is the conductance G=I/(Vm−ECa), Gmax is the maximal conductance obtained from the Boltzmann fit under control conditions, V0.5 is the voltage for half-maximal activation, Vm is the membrane potential, and k is a slope factor. ECa is the reversal potential for ICa and was determined for each individual neuron. The values of ICa around the reversal potential were fit with a linear regression line to establish the voltage at which the current was zero. The Boltzmann parameters were determined for each individual neuron and then used to calculate the mean ± S.E.M. Fits were performed using SigmaPlot 9.0 (Systat Software Inc., San Jose, CA). To fit the inactivation curves, the Boltzmann relation G/Gmax = c + {(1− c) / [1 + exp (V0.5 − Vm)/k]} was used where c is the fraction of non-inactivating current. For ICa, c is defined by the peak current obtained at −20 mV for the prepulse to −20 mV. The other parameters are as defined above. Statistical differences between the two genotypes were determined by using a Student’s t-test or an ANOVA whenever appropriate. Values of P<0.05 were judged to be statistically significant.
Chemicals
Tissue culture supplies were purchased from Invitrogen (Carlsbad, CA, USA). Papain was purchased from Worthington Biochemical Corp. (Lakewood, NJ) and dispase was obtained from Roche Diagnostics Corp. (Indianapolis, IN). ω-conotoxin GVIA, ω-agatoxin IVA, and SNX-482 were purchased from Alomone Laboratories (Jerusalem, Israel). All other chemicals were obtained from Sigma Chemical Corp. (St Louis, MO). Capsaicin and nifedipine were dissolved in 1-methyl-2-pyrrolidinone (MPL) to obtain stock solutions; these were diluted to yield final concentrations. Stocks were aliquoted and stored at −20° C until immediately prior to use. Our earlier studies demonstrated that MPL does not affect the potassium or sodium currents in the DRG sensory neurons (Zhang et al. 2002, 2006a/b)
Results
The total ICa is not different in wildtype and Nf1+/− neurons
We previously showed that the capsaicin-evoked release of substance P and calcitonin gene-related peptide (CGRP) from sensory neurons isolated from Nf1+/− mice was greater than that measured in wildtype mice (Hingtgen et al., 2006). To determine whether this resulted from differences in ICa between the two genotypes, whole-cell patch-clamp recordings were performed to assess the total ICa in sensory neurons. A representative recording from a wildtype sensory neuron is illustrated in Fig. 1A wherein the peak amplitude was −1305 pA for a voltage step to –10 mV. For voltage steps between −60 and −30 mV, this neuron exhibited a prominent rapidly inactivating T-type ICa. The current-voltage relations for the total ICa obtained from 57 wildtype and 31 Nf1+/− sensory neurons are summarized in Fig. 1B (left panel). For wildtype neurons, the average peak value of total ICa was −1678 ± 178 pA for the step to −20 mV, whereas in Nf1+/− neurons the total ICa had an average peak value of −2414 ± 455 pA for the step to −20 mV. To account for the variations in cell size, ICa was normalized to cell capacitance and shown as the current density-voltage relation summarized in the right panel of Fig. 1B. The cell capacitance for the isolated neurons was not different between the two genotypes (wildtype 38.1 ± 2.1 pF, range 12.3–94.8, vs. Nf1+/− 43.1 ± 4.3 pF, range 18.7–133.5; P=0.49 t-test). There was no significant difference between the average peak current densities in wildtype compared to Nf1+/− neurons (−47.3 ± 5.3 vs. −59.3 ± 9.5 pA/pF, respectively, for steps to −20 mV, P=0.21, t-test). Note that between the voltages of −70 and −30 mV in the current-voltage relations, there is a clear indication of T-type ICa activation, which was not different between the genotypes. The number of neurons exhibiting T-type currents was similar between the two genotypes; for the wildtype only 19 of 57 neurons (33%) compared to 9 of 31 (29%) for the Nf1+/− neurons. When the current values were transformed to conductance (G), the conductance-voltage relation was fit with the Boltzmann relation, and the conductance for each neuron was then normalized to the maximal value of G (Gmax) obtained from the fit. The G/Gmax-voltage relation is summarized in Fig. 1C and indicates that the voltage-dependence for activation of Gmax was nearly identical between the two genotypes.
Figure 1.

The total ICa and the average peak current densities in wildtype and Nf1+/− neurons are not different. Panel A shows representative current traces obtained from a wildtype mouse where the neuron was held at −90 mV with 10 mV incrementing steps to +30 mV. The voltage steps are noted as the numbers next to the current traces. Note the smaller amplitude, rapidly inactivating current traces which are indicative of T-type currents. The line designated as 0 indicates the zero current level. Panel B, left, illustrates the current-voltage relations obtained for the peak ICa elicited by depolarizing steps from holding of voltage of −90 mV for 57 wildtype (WT) and 31 Nf1+/− sensory neurons. The right panel shows the current density (pA/pF)-voltage relations of the peak ICa for the same wildtype and Nf1+/− neurons. The values represent the means ± SEM. Panel C shows the G/Gmax-voltage relations for the voltage dependence of activation and the steady-state inactivation of ICa in the two genotypes. The continuous lines through the data points represent the Boltzmann fits for the wildtype and Nf1+/− neurons. Panel D shows the separation of the single Boltzmann fit for the voltage-dependent activation in panel C into two distinct profiles. The values of G/Gmax between −90 and −40 mV were fit by a single Boltzmann where Gmax was set to 0.201 and is shown as the dark gray line through the data points. The predicted values of G/Gmax from this fit were subtracted from the total G/Gmax (filled circles, dotted black line) for voltages between −90 and +45 mV; this subtraction yielded the G/Gmax relation represented by the open diamonds and fitted by the single Boltzmann relation (dotted gray line). These fitting parameters are described in Table 2.
However, the values of G/Gmax between the voltages −70 and −40 mV were not well fit by the single Boltzmann, which otherwise described the results. To better fit these values, the points between −90 and −40 mV were fit with a single Boltzmann for a G/Gmax of 0.201 (see panel D) for the wildtype neurons (similar results were obtained for the Nf1+/− neurons where G/Gmax was fitted for a value of 0.190). The predicted values from this fit were then subtracted from the G/Gmax values over the range of voltages from −90 to +45 mV; these results were then fitted by another single Boltzmann. The Boltzmann fitting parameters, V0.5 and k, for the single fits shown in panel C and the double fits shown in panel D are summarized in Table 2; these results demonstrate that there were no significant differences between the wildtype and Nf1+/− neurons. Similarly, measurements of steady-state inactivation for ICa demonstrated that there were no differences in the properties of inactivation between the genotypes (see Fig. 1C and Table 2). For example, in wildtype cells, ICa was inactivated by 68.9 ± 3.5% (n = 8) after the conditioning prepulse to −20 mV, which was not different from the 75.1 ± 8.8%, (n = 8) in Nf1+/− neurons. Because of the very similar relations between the wildtype and Nf1+/− neurons for the current-voltage, the G/Gmax-voltage, and steady-state inactivation it seems unlikely that the voltage dependence of activation/inactivation of ICa was altered in Nf1+/− neurons and therefore differences in the total ICa do not account for the enhanced excitability or augmented release of neuropeptides previously shown (Wang et al., 2005; Hingtgen et al., 2006).
Table 2.
Boltzmann parameters for ICa activation and inactivation
| Single Boltzmann | Two Boltzmanns | |||||
|---|---|---|---|---|---|---|
| Activation | V0.5 (mV) | k (mV) | V0.5 (mV) | k (mV) | V0.5 (mV) | k (mV) |
| WT | −30.7 ± 1.9 | 4.4 ± 0.7 | −58.4 | 5.8 | −25.1 | 5.7 |
| Nf1+/− | −29.8 ± 2.7 | 5.9 ± 1.4 | −60.1 | 8.9 | −24.8 | 6.9 |
| Inactivation | ||
|---|---|---|
| WT | −45.9 ± 8.9 | 8.2 ± 2.2 |
| Nf1+/− | −43.7 ± 6.4 | 10.2 ± 2.8 |
Contribution of channel subtypes to the total ICa in wildtype and Nf1+/− neurons
Ca2+ channels have been delineated into different subtypes; L-type (Cav1 family), N-type (Cav2.2), P/Q-type (Cav2.1), R-type (Cav2.3), T-type (Cav3 family). These subtypes have different physiological roles in regulating neuronal activities. Although the results presented above demonstrate that the total ICa was not different between the two genotypes, the contribution of each subtype may be altered and thus account for the enhanced release of neuropeptides. To test this idea, blockers of specific subtypes were used to assess their contribution to the total ICa. The top panel of Fig. 2 illustrates representative current traces obtained from an isolated wildtype neuron for the control condition (1); for inhibition of ICa after exposure to 200 nM CTx (2); and then subsequent exposure to 5 μM nifedipine (3). Maximum activation of ICa was obtained with a 200 ms voltage step to −20 mV from a holding voltage of −90 mV which was repeated every 15 s. The bottom panel of Fig. 2 shows the time course for inhibition produced by CTx (42% of the total current) and by nifedipine (37% of the total current) in this sensory neuron. The successive addition of these blockers provides a measure of the proportion of total current carried by each channel subtype. To exclude the possible interaction of each blocker on ICa, CTx and nifedipine were applied in a random order for each recording. From a number of experiments such as those described above, the contribution of each channel subtype to the total ICa could be established in wildtype and Nf1+/− sensory neurons. Figs. 3A/B show scatter plots for the CTx and nifedipine sensitivities, respectively, exhibited by the two genotypes wherein the neurons were ranked by their fractional sensitivities (low to high). Based on the overall distribution for the sensitivity to CTx it appears that these neurons can be separated into three groups exhibiting low, intermediate, and high sensitivities to CTx (Fig. 3A). In 26 wildtype neurons, 18 neurons (69.2%) exhibited a low fractional sensitivity to CTx and had an average value of 0.192 ± 0.018 (range 0.038–0.288); 7 neurons (26.9%) exhibited intermediate fractional sensitivity that averaged 0.501 ± 0.041 (range 0.399–0.640); and 1 neuron (3.8%) exhibited high sensitivity of 0.864. In contrast, of the 21 Nf1+/− neurons, 6 (28.6%) exhibited low sensitivity (average 0.181 ± 0.025, range 0.079–0.246); 12 (57.1%) exhibited intermediate sensitivity (average 0.495 ± 0.018, range 0.411–0.597); 3 (14.3%) exhibited high sensitivity (average 0.766 ± 0.074, range 0.691–0.839). Although the average sensitivities for the low and intermediate groups were similar, the proportion of cells exhibiting either low or intermediate sensitivity to CTx was significantly different between the wildtype and Nf1+/− neurons (P=0.03, χ2 test). The high sensitivity groups were not tested because of the small sample size. Based on the distribution of the fractional sensitivities to nifedipine, the notion of differential sensitivity was not tested. These results suggest that the sensitivity of Nf1+/− sensory neurons to CTx was higher than that of the WT neurons whereas the nifedipine sensitivities were similar. The large variation in individual sensitivity of sensory neurons to CTx is similar to that reported in neurons isolated from mouse superior cervical ganglia ranging from 12–73% (Namkung et al., 1998). These results are summarized in the box plot shown in panel C. The average CTx sensitivity of the Nf1+/− neurons was significantly higher than the wildtype neurons (44.4 ± 4.5%, n=21 vs. 30.1 ± 3.9%, n=26, respectively, P=0.019 t-test). However, there was no difference in the average sensitivity to nifedipine (29.6 ± 3.8%, n=15 vs. 36.5 ± 6.9%, n=15, respectively, P=0.39 t-test). To determine the contributions of P/Q-type (Cav2.1) and R-type (Cav2.3) channels to the total ICa, 200 nM AgTx or SNX-482 were applied directly to the recording chamber. Fig. 4 summarizes the sensitivities of ICa to these blockers. Although the mean sensitivity to AgTx was higher in wildtype neurons (27.1 ± 6.8%, n=12) it was not significantly different than that exhibited by the Nf1+/− neurons (14.3 ± 5.1%, n=8, P=0.191 t-test). The sensitivities to SNX-482 were nearly the same between the genotypes (wildtype 18.3 ± 3.2%, n=10 vs. Nf1+/− 14.5 ± 1.9%, n=12, P=0.339 t-test). Thus, these results demonstrate that there is a significantly larger contribution of N-type (Cav2.2) Ca2+ channels to the total ICa in Nf1+/− neurons and may account for the enhanced release of substance P and CGRP.
Figure 2.

The whole-cell ICa is sensitive to the blockers CTx and nifedipine. Panel 1 shows that under control conditions, a voltage step from −90 to −20 mV evokes a representative trace for the peak ICa (−1.99 nA); panel 2: the same voltage step recorded after perfusion with 200 nM CTx reduced ICa to −1.15 nA; panel 3: the peak ICa is further reduced to −0.42 nA in the combined presence of CTx and 5 μM nifedipine. The bottom panel shows the cumulative blockade of ICa by the successive perfusion of CTx and nifedipine obtained from the same wildtype neuron. The break in ICa occurring just after the application of nifedipine resulted from the saving and initiating a new acquisition file. After the application of CTx and nifedipine, a small ICa remains that is likely carried by P/Q- and/or R-type channels.
Figure 3.

Sensory neurons isolated from Nf1+/− mice exhibit significantly higher sensitivity to CTx but not to nifedipine. Panel A shows a scattergram for the fractional sensitivities of ICa to 200 nM CTx for individual sensory neurons isolated from either wildtype (WT, n=26) or Nf1+/− (n=21) mice. The fractional sensitivities have been ranked from lowest to highest. Panel B shows a scattergram for the sensitivities of ICa to 5 μM nifedipine for individual sensory neurons isolated from either wildtype (WT, n=15) or Nf1+/− (n=15) mice. The fractional sensitivities have been ranked from lowest to highest. Panel C shows box plots summarizing the results from panels A and B. The sensitivity to CTx was significantly higher in Nf1+/− neurons compared to wildtype (P=0.019 t-test, represented by the asterisk), however, the sensitivity to nifedipine was not different (P=0.389). The mean is represented by the dotted line; the median by the solid line; the upper and lower bars are 95% and 5% percentiles, respectively.
Figure 4.
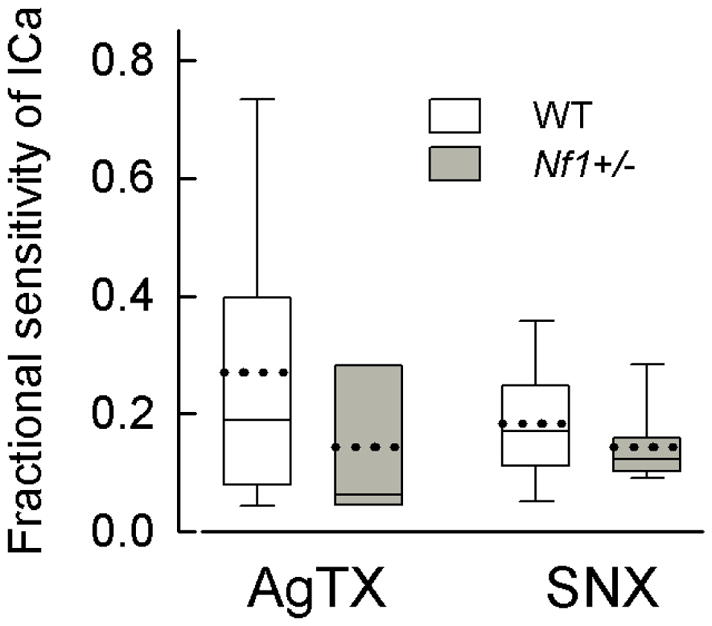
The sensitivities of ICa to AgTx and SNX-482 in Nf1+/− sensory neurons are not different compared to wildtype neurons. Shown are box plots for the sensitivities of ICa to 200 nM AgTx for wildtype (WT, n=12) and Nf1+/− (n=8) neurons; these values were not different (P=0.19, t-test). For 200 nM SNX-482, the sensitivities were also not different (P=0.34, t-test) between wildtype (n=10) and Nf1+/− (n=12) sensory neurons. The mean is represented by the dotted line; the median by the solid line; the upper and lower bars are 95% and 5% percentiles, respectively.
The mRNA expression of Cav subtypes is not different between wildtype and Nf1+/− neurons
To determine whether the larger contribution of N-type (Cav2.2) channels to the total ICa in Nf1+/− neurons resulted from increased expression of mRNA for this subtype, SYBR-green qPCR was used to assess mRNA levels in the DRG isolated from the two genotypes. Table 3 summarizes the mean values of Cq for some of the different Ca2+ channel subtypes as well as the reference genes HPRT and Arbp; since there was no apparent difference in the T-type (Cav3 family) ICa from the current-voltage relations shown in Fig. 1 these mRNA levels were not determined. Based on the Cq values, the P- and N-types (Cav2.3 and Cav2.2, respectively) exhibited the highest levels of expression in the isolated but intact mouse DRG. The lowest level of expression was obtained for the L-type subtype Cav1.3. Although the mRNA was obtained from the intact DRG containing different neuronal subtypes as well as support cells as compared to the isolated neurons from which the pharmacological sensitivities of ICa were obtained, the levels of mRNA expression correlate, for the most part, with the percentage of the total ICa that was sensitive to their respective antagonist. Fig. 5 (panel A) demonstrates the mRNA expression levels relative to the reference gene HPRT for both genotypes and is similar to the profile indicated by the Cq values. The profile for the Cav subtypes relative to Arbp was quite similar to HPRT (data not shown). Panel B shows that there were no significant differences in the relative expression for the different Cav subtypes between the wildtype and the Nf1+/− mice (REST analysis). Although the sensitivity to CTx was significantly higher in the Nf1+/− neurons, there appears to be no difference in the levels of mRNA expression for Cav2.2 between the two genotypes. This suggests that Cav2.2 may undergo post-translational modifications in the Nf1+/− neurons (but see the Discussion below) and thus account for the larger contribution of Cav2.2 to the total ICa in these neurons. This is an important area for future investigation that could explore the role of neurofibromin-dependent signaling pathways in regulating ion channel activity.
Table 3.
Cq values for Ca2+ channel subunits
| WT | Nf1+/− | |
|---|---|---|
|
|
||
| mCav1.2 | 25.89 ± 0.55 | 25.43 ± 0.38 |
| mCav1.3 | 29.46 ± 0.36 | 29.39 ± 0.12 |
| mCav2.1 | 23.95 ± 0.49 | 23.78 ± 0.52 |
| mCav2.2 | 24.59 ± 0.58 | 24.28 ± 0.44 |
| mCav2.3 | 27.94 ± 0.53 | 27.52 ± 0.54 |
| HPRT | 21.42 ± 0.64 | 21.43 ± 0.75 |
| Arbp | 18.33 ± 0.82 | 18.37 ± 1.07 |
Mean ± SD, n=4 mice for each genotype
Figure 5.

mRNA expression levels for the Ca2+ channel subtypes in the isolated but intact DRG from wildtype and Nf1+/− mice. Panel A shows the relative expression levels of different Ca2+ channel subtypes for the wildtype and Nf1+/− DRG. Cav1.2 and 1.3 are L-type channels; Cav2.1 is P/Q-type; Cav2.2 is N-type; and Cav2.3 is R-type. As described in the Methods, copy numbers for these channel subtypes were normalized to the value of either HPRT or Arbp (not shown) for each respective DRG. The values represent the means ± standard deviations obtained from 4 mice of each genotype. Panel B shows a box plot summarizing the mRNA expression levels for the different Ca2+ subtypes in Nf1+/− DRGs relative to the those expression levels determined in the wildtype (WT) mice. Results are shown for both reference genes, HPRT and Arbp. There were no significant differences in expression levels between the genotypes for each Ca2+ channel subtype (P>0.05, REST analysis). The mean is represented by the dotted line; the median by the solid line; the upper and lower bars of each box are the 75% and 25% percentiles, respectively.
Discussion
In this report, we demonstrate that the contribution of N-type/Cav2.2 Ca2+ channels to the total ICa was significantly higher in sensory neurons isolated from Nf1+/− mice compared to the wildtype. Based on the well-established role of Cav2.2 in synaptic release mechanisms, this finding suggests that the augmented Cav2.2-dependent current could account for the enhanced release of the neuropeptides substance P and CGRP from sensory neurons isolated from Nf1+/− mice (Hingtgen et al., 2006). In contrast, the contributions of L- (Cav1), P/Q- (Cav2.1), or R-type (Cav2.3) voltage-dependent Ca2+ channels were not different between the two genotypes. Surprisingly, the levels of mRNA for the α subunits of Cav2.2 were not different between the genotypes, suggesting that neurofibromin-dependent pathways may alter the activity of Cav2.2 in a non-genomic manner. Although neither the voltage dependence for activation nor inactivation for ICa was different between the two genotypes, the enhanced Cav2.2-mediated current could result from modification of the processes that control the probability of channel opening or the kinetics of channel inactivation. It is possible that the level of neurofibromin, which is an established GTPase accelerating protein (GAP), could modulate the activity of RGK proteins (Rad, Rem, Rem2, Gem/Kir). These proteins comprise four members of a Ras subfamily that are known to inhibit Cav1/Cav2 calcium channels (Yang and Colecraft, 2013) and Rem2 is expressed in sensory neurons of the dorsal root ganglion (Chen et al., 2005). However, a neurofibromin/Rem2 mediated regulation of ICa seems unlikely since the only known GAP for RGK proteins is nm23 (Yang and Colecraft, 2013). Alternatively, the levels of neurofibromin could modify the expression of mRNA/protein or the activity of the β and/or the α2δ auxiliary subunits. Both the β and the α2δ subunits can enhance the functional expression and current density of the α subunits of Cav1 (L-type), Cav2.1 (P/Q-type), and Cav2.2 (N-type) calcium channels (see reviews by Dolphin, 2012; Buraei and Yang, 2013). In contrast to the results obtained for calcium channel subtypes, we previously reported that the enhanced sodium currents exhibited by small diameter sensory neurons isolated from Nf1+/− mice may result, in part, from the increased mRNA expression of specific sodium channel subtypes (Hodgdon et al., 2012). Studies examining the multiple mechanisms of post-translational modifications to calcium channel subtypes as well as the possible roles that these auxiliary subunits play in the regulation of ICa in Nf1+/− neurons are an important area for future investigation.
We demonstrated that the proportions of the total ICa carried by the different types of Ca2+ channels were: N-type ~30%, L-type ~30%, P/Q-type ~28%, and R-type ~18% in wildtype neurons (Fig. 3). These values are similar to those found in previous studies on sensory neurons isolated from the mouse DRG (CB57BL/6J and Short sleep strains) wherein the contribution of N-type ranged from 19–50%, L-type from 10–35%, P/Q-type from 5–40%, and R-type from 10–15% (see Huang and McArdle 1992, Wilson et al., 2000, Yang and Stephens 2009, Fukumoto et al., 2012). Such variation in the sensitivities to the different channel subtype blockers may arise from the heterogeneous nature of the neuronal population comprising the DRG. Recently, the levels of ICa were examined in hippocampal neurons isolated from wildtype and Nf1+/− mice (Wang et al., 2010b). Using Ba2+ as the charge carrier, the peak current density for the Nf1+/− neurons was significantly higher than that measured in the wildtype neurons. The peak current density for the Nf1+/− hippocampal neurons was similar to the levels that we measured in both Nf1+/− and wildtype sensory neurons, whereas, the density value for the wildtype hippocampal neurons was much smaller compared to that in sensory neurons (approximately −22 vs. −47 pA/pF, respectively). Similar to our findings reported above, there were no significant differences for the voltage dependence of ICa (IBa) current activation or inactivation between the genotypes. Treatment with 10 μM nifedipine reduced the current density of IBa in the Nf1+/− hippocampal neurons (about 37%) to levels that were similar to the wildtype neurons; surprisingly nifedipine had no effect on the current density in wildtype hippocampal neurons. These results suggest that the enhanced IBa in Nf1+/− neurons was conducted by L-type channels but that there was little to no L-type Ca2+ channels in wildtype neurons, however, the sensitivity of these hippocampal neurons to different Ca2+ channel blockers (e.g., CTx) was not examined. The release of glutamate evoked by elevated potassium (50 mM) was significantly larger in the Nf1+/− hippocampal neurons compared to the wildtype neurons. These findings are consistent with the enhanced release of substance P and CGRP observed in Nf1+/− sensory neurons as previously reported by Hingtgen et al. (2006).
The contribution of L-type channels to the total ICa in isolated sensory neurons is not different for these two genotypes (Fig. 3). One possibility is that L-type channels are present in greater proportions in the dendrites which are lost during dissociation (Martínez-Pinna et al., 2002); our recordings were obtained within 24 hrs of isolation providing little opportunity for regrowth. Furthermore, L-type Ca2+ channels do not appear to play an important role in the hypersensitivity resulting from inflammation or neuropathic injury (discussed below, but also see Fossat et al., 2010). In contrast, N-type channels are more or less equally expressed in both the cell body and proximal dendrites (Westenbroek et al., 1998). Many studies have identified N-type Ca2+ channels (Cav2.2) as the primary contributor to the increased excitability and neurotransmitter release in chronic and neuropathic pain syndromes from many different types of neurons (Dunlap et al., 1995; Catterall., 2000; Reid et al., 2003; Winquist et al., 2005; Gray et al., 2007). Cav2.2 channel knock-out mice have decreased pain responses in several models of neuropathic and inflammatory pain (Saegusa et al., 2001; Hatakeyama et al., 2001; Kim et al., 2001). Moreover, Bell et al. demonstrated that the DRG-specific exon, e37a, is preferentially present in Cav2.2 mRNAs expressed in nociceptive neurons and cell-specific inclusion of exon 37a correlates closely with significantly larger N-type currents in nociceptive neurons (Bell et al., 2004). In addition, knockdown of the e37a- and e37b-containing channels reduces Cav2.2 protein expression and blocks substance P release from cultured DRG neurons (Altier et al., 2007).
Our results demonstrate that sensory neurons isolated from Nf1+/− mice exhibit an augmented N-type ICa. These results strongly support that N-type Ca2+ channels are responsible for enhanced release of neuropeptides in nociceptive neurons. Recent studies have demonstrated that N-type Ca2+ channels may play a significant role in the heightened sensitivity that results from inflammation and/or neuropathic pain. Seminal studies demonstrated that intrathecal delivery of SNX-111 (ziconotide, a synthetic analog of ω-conotoxin MVIIC) significantly reduced in a dose-dependent manner the hypersensitivity resulting from either formalin injection into the rat’s hindpaw (Malmberg and Yaksh 1994) or spinal nerve ligation (L5/L6) (Chaplan et al., 1994). Later clinical studies established that SNX-111 effectively reduced the pain associated with cancer or AIDS (Staats et al., 2004). More recently, intrathecal administration of SNX-111, but not the L-type blockers diltiazem or verapamil, suppressed the internalization of neurokinin-1, the G-protein coupled receptor that is activated by substance P (Takasusuki and Yaksh 2011). These results demonstrate that N-type Ca2+ channels play a key role in the transmission of nociceptive signaling in the spinal cord. The reader is referred to the following reviews for additional information regarding the therapeutic potential for Ca2+ channel blockers (Miljanich 2004, Schmidtko et al., 2010, Todorovic and Jevtovic-Todorovic 2011, Vink and Alewood 2012). Although, NF1-related pain syndromes are not well characterized, there is clearly pain that is not directly related to tumor burden (Creange et al., 1999). Indeed, 63% of surveyed families who have been involved in NF1 research studies at the NIH, recommended that future NF1 research should focus on pain (Martin et al., 2011). This was second only to learning disabilities in the areas of research recommended by those families affected by NF1.
In conclusion, the major finding of this study is that the N-type Ca2+ current in small-diameter Nf1+/− sensory neurons is significantly enhanced compared to wildtype neurons. Given that N-type channels are important for the release of neurotransmitters and key mediators of nociceptive signaling, the augmentation of this particular Ca2+ channel subtype likely accounts for the enhanced release of substance P and CGRP from Nf1+/− sensory neurons and may contribute to the intensified sensations observed in NF1 patients in response to painful stimuli.
Highlights.
Peak ICa densities were not different between wildtype and Nf1+/− sensory neurons
N-type (Cav2.2) ICa was significantly larger in Nf1+/− sensory neurons
No differences in L-, P/Q- and R-type currents between the two genotypes
Using qPCR, Cav2.2 and Cav2.1 exhibited the highest mRNA levels in the DRG
No differences in the levels of channel subtype mRNA expression between the genotypes
Acknowledgments
Grants
This investigation was conducted in a facility constructed with support from Research Facilities Improvement Program Grant Number C06 RR015481-01 from the National Center for Research Resources, NIH. This work was supported by grants from the Department of Defense W81XWH-09-1-0174 (GDN) and NIH NINDS NS51668 (CMH).
Abbreviations
- ANOVA
analysis of variance
- Arbp
acidic ribosomal protein P0
- CGRP
calcitonin gene-related peptide
- Cq
quantification cycle
- DRG
dorsal root ganglia
- ECa
reversal potential for ICa
- EGTA
ethylenediamine tetraacetic acid
- G
conductance
- Gmax
maximal conductance
- HEPES
4-(2-hydroxyethyl)-1-piperazineethanesulfonic acid
- HPRT
hypoxanthine-guanine phosphoribosyl transferase
- ICa
Ca2+ current
- k
slope factor
- MPL
1-methyl-2-pyrrolidinone
- Nf1
Neurofibromatosis type 1
- qPCR
real-time quantitative polymerase chain reaction
- ΔRn
change in SYBR green fluorescence emission
- TEA
tetraethyl ammonium
- TTX
tetrodotoxin
- V0.5
voltage for half-maximal activation
- Vm
membrane potential
- ω–AgTx
ω-agatoxin IVA
- ω-CTx
ω-conotoxin GVIA
Footnotes
Disclosures
The authors have nothing to disclose.
Publisher's Disclaimer: This is a PDF file of an unedited manuscript that has been accepted for publication. As a service to our customers we are providing this early version of the manuscript. The manuscript will undergo copyediting, typesetting, and review of the resulting proof before it is published in its final citable form. Please note that during the production process errors may be discovered which could affect the content, and all legal disclaimers that apply to the journal pertain.
References
- Altier C, Dale CS, Kisilevsky AE, Chapman K, Castiglioni AJ, Matthews EA, Evans RM, Dickenson AH, Lipscombe D, Vergnolle N, Zamponi GW. Differential role of N-type calcium channel splice isoforms in pain. J Neurosci. 2007;27:6363–6373. doi: 10.1523/JNEUROSCI.0307-07.2007. [DOI] [PMC free article] [PubMed] [Google Scholar]
- Andrade A, de León MB, Hernández-Hernández O, Cisneros B, Felix R. Myotonic dystrophy CTG repeat expansion alters Ca2+ channel functional expression in PC12 cells. FEBS Lett. 2007;581:4430–4438. doi: 10.1016/j.febslet.2007.08.020. [DOI] [PubMed] [Google Scholar]
- Atlas D. The voltage-gated calcium channel functions as the molecular switch of synaptic transmission. Annu Rev Biochem. 2013;82:607–635. doi: 10.1146/annurev-biochem-080411-121438. [DOI] [PubMed] [Google Scholar]
- Bell TJ, Thaler C, Castiglioni AJ, Helton TD, Lipscombe D. Cell-specific alternative splicing increases calcium channel current density in the pain pathway. Neuron. 2004;41:127–138. doi: 10.1016/s0896-6273(03)00801-8. [DOI] [PubMed] [Google Scholar]
- Buraei Z, Yang J. Structure and function of the β subunit of voltage-gated Ca2+ channels. Biochim Biophys Acta. 2013;1828:1530–1540. doi: 10.1016/j.bbamem.2012.08.028. [DOI] [PMC free article] [PubMed] [Google Scholar]
- Catterall WA. Structure and regulation of voltage-gated Ca2+ channels. Annu Rev Cell Dev Biol. 2000;16:521–555. doi: 10.1146/annurev.cellbio.16.1.521. [DOI] [PubMed] [Google Scholar]
- Catterall WA, Few AP. Calcium channel regulation and presynaptic plasticity. Neuron. 2008;59:882–901. doi: 10.1016/j.neuron.2008.09.005. [DOI] [PubMed] [Google Scholar]
- Catterall WA, Perez-Reyes E, Snutch TP, Striessnig J. International Union of Pharmacology. XLVIII. Nomenclature and structure-function relationships of voltage-gated calcium channels. Pharmacol Rev. 2005;57:411–425. doi: 10.1124/pr.57.4.5. [DOI] [PubMed] [Google Scholar]
- Chameau P, Qin Y, Spijker S, Smit AB, Joëls M. Glucocorticoids specifically enhance L-type calcium current amplitude and affect calcium channel subunit expression in the mouse hippocampus. J Neurophysiol. 2007;97:5–14. doi: 10.1152/jn.00821.2006. [DOI] [PubMed] [Google Scholar]
- Chaplan SR, Pogrel JW, Yaksh TL. Role of voltage-dependent calcium channel subtypes in experimental tactile allodynia. J Pharmacol Exp Ther. 1994;269:1117–1123. [PubMed] [Google Scholar]
- Chen H, Puhl HL, 3rd, Niu SL, Mitchell DC, Ikeda SR. Expression of Rem2, an RGK family small GTPase, reduces N-type calcium current without affecting channel surface density. J Neurosci. 2005;25:9762–9772. doi: 10.1523/JNEUROSCI.3111-05.2005. [DOI] [PMC free article] [PubMed] [Google Scholar]
- Creange A, Zeller J, Rostaing-Rigattieri S, Brugieres P, Degos JD, Revuz J, Wolkenstein P. Neurological complications of neurofibromatosis type 1 in adulthood. Brain. 1999;122:473–481. doi: 10.1093/brain/122.3.473. [DOI] [PubMed] [Google Scholar]
- Cregg R, Momin A, Rugiero F, Wood JN, Zhao J. Pain channelopathies. J Physiol. 2010;588:1897–1904. doi: 10.1113/jphysiol.2010.187807. [DOI] [PMC free article] [PubMed] [Google Scholar]
- Diochot S, Richard S, Valmier J. Diversity of voltage-gated calcium currents in large diameter embryonic mouse sensory neurons. Neuroscience. 1995;69:627–641. doi: 10.1016/0306-4522(95)00267-m. [DOI] [PubMed] [Google Scholar]
- Dolphin AC. Calcium channel diversity: multiple roles of calcium channel subunits. Curr Opin Neurobiol. 2009;19:237–244. doi: 10.1016/j.conb.2009.06.006. [DOI] [PubMed] [Google Scholar]
- Dolphin AC. Calcium channel auxiliary α2δ and β subunits: trafficking and one step beyond. Nat Rev Neurosci. 2012;13:542–555. doi: 10.1038/nrn3311. [DOI] [PubMed] [Google Scholar]
- Duan JH, Hingtgen CM, Nicol GD. N-type calcium current is augmented in small diameter sensory neurons isolated from Nf1+/− mice. Soc Neurosci Abstracts. 2010;174.9 doi: 10.1016/j.neuroscience.2014.04.021. [DOI] [PMC free article] [PubMed] [Google Scholar]
- Dunlap K, Luebke JI, Turner TJ. Exocytotic Ca2+ channels in mammalian central neurons. Trends Neurosci. 1995;18:89–98. [PubMed] [Google Scholar]
- Fossat P, Dobremez E, Bouali-Benazzouz R, Favereaux A, Bertrand SS, Kilk K, Léger C, Cazalets JR, Langel U, Landry M, Nagy F. Knockdown of L calcium channel subtypes: differential effects in neuropathic pain. J Neurosci. 2010;30:1073–1085. doi: 10.1523/JNEUROSCI.3145-09.2010. [DOI] [PMC free article] [PubMed] [Google Scholar]
- Fox AP, Nowycky MC, Tsien RW. Kinetic and pharmacological properties distinguishing three types of calcium currents in chick sensory neurones. J Physiol. 1987;394:149–172. doi: 10.1113/jphysiol.1987.sp016864. [DOI] [PMC free article] [PubMed] [Google Scholar]
- Fukumoto N, Kitamura N, Niimi K, Takahashi E, Itakura C, Shibuya I. Ca2+ channel currents in dorsal root ganglion neurons of P/Q-type voltage-gated Ca2+ channel mutant mouse, rolling mouse Nagoya. Neurosci Res. 2012;73:199–206. doi: 10.1016/j.neures.2012.04.006. [DOI] [PubMed] [Google Scholar]
- Gray AC, Raingo J, Lipscombe D. Neuronal calcium channels: splicing for optimal performance. Cell Calcium. 2007;42:409–417. doi: 10.1016/j.ceca.2007.04.003. [DOI] [PMC free article] [PubMed] [Google Scholar]
- Grimm C, Holter NI, Draguhn A, Bruehl C. Compensatory increase in P/Q-calcium current-mediated synaptic transmission following chronic block of N-type channels. Neurosci Lett. 2008;442:44–49. doi: 10.1016/j.neulet.2008.06.066. [DOI] [PubMed] [Google Scholar]
- Hatakeyama S, Wakamori M, Ino M, Miyamoto N, Takahashi E, Yoshinaga T, Sawada K, Imoto K, Tanaka I, Yoshizawa T, Nishizawa Y, Mori Y, Niidome T, Shoji S. Differential nociceptive responses in mice lacking the alpha1B subunit of N-type Ca2+ channels. Neuroreport. 2001;12:2423–2427. doi: 10.1097/00001756-200108080-00027. [DOI] [PubMed] [Google Scholar]
- Hingtgen CM, Roy SL, Clapp DW. Stimulus-evoked release of neuropeptides is enhanced in sensory neurons from mice with a heterozygous mutation of the Nf1 gene. Neuroscience. 2006;137:637–645. doi: 10.1016/j.neuroscience.2005.09.030. [DOI] [PubMed] [Google Scholar]
- Hodgdon KE, Hingtgen CM, Nicol GD. Dorsal root ganglia isolated from Nf1+/− mice exhibit increased levels of mRNA expression of voltage-dependent sodium channels. Neuroscience. 2012;206:237–244. doi: 10.1016/j.neuroscience.2011.12.045. [DOI] [PubMed] [Google Scholar]
- Holzer P. Capsaicin: cellular targets, mechanisms of action, and selectivity for thin sensory neurons. Pharmacol Rev. 1991;43:143–201. [PubMed] [Google Scholar]
- Huang GJ, McArdle JJ. Novel suppression of an L-type calcium channel in neurones of murine dorsal root ganglia by 2,3-butanedione monoxime. J Physiol. 1992;447:257–274. doi: 10.1113/jphysiol.1992.sp019001. [DOI] [PMC free article] [PubMed] [Google Scholar]
- Jacks T, Shih TS, Schmitt EM, Bronson RT, Bernards A, Weinberg RA. Tumour predisposition in mice heterozygous for a targeted mutation in Nf1. Nat Genet. 1994;7:353–361. doi: 10.1038/ng0794-353. [DOI] [PubMed] [Google Scholar]
- Jones SW. Overview of voltage-dependent calcium channels. J Bioenerg Biomembr. 1998;30:299–312. doi: 10.1023/a:1021977304001. [DOI] [PubMed] [Google Scholar]
- Kim C, Jun K, Lee T, Kim SS, McEnery MW, Chin H, Kim HL, Park JM, Kim DK, Jung SJ, Kim J, Shin HS. Altered nociceptive response in mice deficient in the alpha(1B) subunit of the voltage-dependent calcium channel. Mol Cell Neurosci. 2001;18:235–245. doi: 10.1006/mcne.2001.1013. [DOI] [PubMed] [Google Scholar]
- Lindsay RM. Nerve growth factors (NGF, BDNF) enhance axonal regeneration but are not required for survival of adult sensory neurons. J Neurosci. 1988;8:2394–2405. doi: 10.1523/JNEUROSCI.08-07-02394.1988. [DOI] [PMC free article] [PubMed] [Google Scholar]
- Lipscombe D, Andrade A, Allen SE. Alternative splicing: functional diversity among voltage-gated calcium channels and behavioral consequences. Biochim Biophys Acta. 2013;1828:1522–1529. doi: 10.1016/j.bbamem.2012.09.018. [DOI] [PMC free article] [PubMed] [Google Scholar]
- Malmberg AB, Yaksh TL. Voltage-sensitive calcium channels in spinal nociceptive processing: blockade of N- and P-type channels inhibits formalin-induced nociception. J Neurosci. 1994;14:4882–4890. doi: 10.1523/JNEUROSCI.14-08-04882.1994. [DOI] [PMC free article] [PubMed] [Google Scholar]
- Martin S, Gillepsie A, Wolters PL, Widemann BC. Experiences of families with a child, adolescent, or young adult with neurofibromatosis type 1 and plexiform neurofibroma evaluated for clinical trials participation at the National Cancer Institute. Contemp Clin Trials. 2011;32:10–15. doi: 10.1016/j.cct.2010.10.004. [DOI] [PMC free article] [PubMed] [Google Scholar]
- Martínez-Pinna J, Lamas JA, Gallego R. Calcium current components in intact and dissociated adult mouse sympathetic neurons. Brain Res. 2002;951:227–236. doi: 10.1016/s0006-8993(02)03165-7. [DOI] [PubMed] [Google Scholar]
- Miljanich GP. Ziconotide: neuronal calcium channel blocker for treating severe chronic pain. Curr Med Chem. 2004;11:3029–3040. doi: 10.2174/0929867043363884. [DOI] [PubMed] [Google Scholar]
- Namkung Y, Smith SM, Lee SB, Skrypnyk NV, Kim HL, Chin H, Scheller RH, Tsien RW, Shin HS. Targeted disruption of the Ca2+ channel beta3 subunit reduces N- and L-type Ca2+ channel activity and alters the voltage-dependent activation of P/Q-type Ca2+ channels in neurons. Proc Natl Acad Sci USA. 1998;95:12010–12015. doi: 10.1073/pnas.95.20.12010. [DOI] [PMC free article] [PubMed] [Google Scholar]
- Neher E, Sakaba T. Multiple roles of calcium ions in the regulation of neurotransmitter release. Neuron. 2008;59:861–872. doi: 10.1016/j.neuron.2008.08.019. [DOI] [PubMed] [Google Scholar]
- Petruska JC, Napaporn J, Johnson RD, Gu JG, Cooper BY. Subclassified acutely dissociated cells of rat DRG: histochemistry and patterns of capsaicin-, proton-, and ATP-activated currents. J Neurophysiol. 2000;84:2365–2379. doi: 10.1152/jn.2000.84.5.2365. [DOI] [PubMed] [Google Scholar]
- Reid CA, Bekkers JM, Clements JD. Presynaptic Ca2+ channels: a functional patchwork. Trends Neurosci. 2003;26:683–687. doi: 10.1016/j.tins.2003.10.003. [DOI] [PubMed] [Google Scholar]
- Saegusa H, Kurihara T, Zong S, Kazuno A, Matsuda Y, Nonaka T, Han W, Toriyama H, Tanabe T. Suppression of inflammatory and neuropathic pain symptoms in mice lacking the N-type Ca2+ channel. EMBO J. 2001;20:2349–2356. doi: 10.1093/emboj/20.10.2349. [DOI] [PMC free article] [PubMed] [Google Scholar]
- Schmidtko A, Lötsch J, Freynhagen R, Geisslinger G. Ziconotide for treatment of severe chronic pain. Lancet. 2010;375:1569–1577. doi: 10.1016/S0140-6736(10)60354-6. [DOI] [PubMed] [Google Scholar]
- Staats PS, Yearwood T, Charapata SG, Presley RW, Wallace MS, Byas-Smith M, Fisher R, Bryce DA, Mangieri EA, Luther RR, Mayo M, McGuire D, Ellis D. Intrathecal ziconotide in the treatment of refractory pain in patients with cancer or AIDS: a randomized controlled trial. JAMA. 2004;291:63–70. doi: 10.1001/jama.291.1.63. [DOI] [PubMed] [Google Scholar]
- Takasusuki T, Yaksh TL. Regulation of spinal substance p release by intrathecal calcium channel blockade. Anesthesiology. 2011;115:153–164. doi: 10.1097/ALN.0b013e31821950c2. [DOI] [PMC free article] [PubMed] [Google Scholar]
- Todorovic SM, Jevtovic-Todorovic V. T-type voltage-gated calcium channels as targets for the development of novel pain therapies. Br J Pharmacol. 2011;163:484–495. doi: 10.1111/j.1476-5381.2011.01256.x. [DOI] [PMC free article] [PubMed] [Google Scholar]
- Triggle DJ. The pharmacology of ion channels: with particular reference to voltage-gated Ca2+ channels. Eur J Pharmacol. 1999;375:311–325. doi: 10.1016/s0014-2999(99)00329-5. [DOI] [PubMed] [Google Scholar]
- Vink S, Alewood PF. Targeting voltage-gated calcium channels: developments in peptide and small-molecule inhibitors for the treatment of neuropathic pain. Br J Pharmacol. 2012;167:970–989. doi: 10.1111/j.1476-5381.2012.02082.x. [DOI] [PMC free article] [PubMed] [Google Scholar]
- Yue Wang, Nicol GD, Clapp DW, Hingtgen CM. Sensory neurons from Nf1 haploinsufficient mice exhibit increased excitability. J Neurophysiol. 2005;94:3670–3676. doi: 10.1152/jn.00489.2005. [DOI] [PubMed] [Google Scholar]
- Yue Wang, Duan JH, Hingtgen CM, Nicol GD. Augmented sodium currents contribute to the enhanced excitability of small diameter capsaicin-sensitive sensory neurons isolated from Nf1+/− mice. J Neurophysiol. 2010a;103:2085–2094. doi: 10.1152/jn.01010.2009. [DOI] [PMC free article] [PubMed] [Google Scholar]
- Yuying Wang, Brittain JM, Wilson SM, Hingtgen CM, Khanna R. Altered calcium currents and axonal growth in Nf1 haploinsufficient mice. Transl Neurosci. 2010b;1:106–114. doi: 10.2478/v10134-010-0025-8. [DOI] [PMC free article] [PubMed] [Google Scholar]
- Westenbroek RE, Hoskins L, Catterall WA. Localization of Ca2+ channel subtypes on rat spinal motor neurons, interneurons, and nerve terminals. J Neurosci. 1998;18:6319–6330. doi: 10.1523/JNEUROSCI.18-16-06319.1998. [DOI] [PMC free article] [PubMed] [Google Scholar]
- Wilson SM, Toth PT, Oh SB, Gillard SE, Volsen S, Ren D, Philipson LH, Lee EC, Fletcher CF, Tessarollo L, Copeland NG, Jenkins NA, Miller RJ. The status of voltage-dependent calcium channels in alpha 1E knock-out mice. J Neurosci. 2000;20:8566–8571. doi: 10.1523/JNEUROSCI.20-23-08566.2000. [DOI] [PMC free article] [PubMed] [Google Scholar]
- Winquist RJ, Pan JQ, Gribkoff VK. Use-dependent blockade of Cav2.2 voltage-gated calcium channels for neuropathic pain. Biochem Pharmacol. 2005;70:489–499. doi: 10.1016/j.bcp.2005.04.035. [DOI] [PubMed] [Google Scholar]
- Yang T, Colecraft HM. Regulation of voltage-dependent calcium channels by RGK proteins. Biochim Biophys Acta. 2013;1828:1644–1654. doi: 10.1016/j.bbamem.2012.10.005. [DOI] [PMC free article] [PubMed] [Google Scholar]
- Yang L, Stephens GJ. Effects of neuropathy on high-voltage-activated Ca2+ current in sensory neurones. Cell Calcium. 2009;46:248–256. doi: 10.1016/j.ceca.2009.08.001. [DOI] [PubMed] [Google Scholar]
- Zhang YH, Fehrenbacher JC, Vasko MR, Nicol GD. Sphingosine-1-phosphate via activation of a G protein-coupled receptor(s) enhances the excitability of rat sensory neurons. J Neurophysiol. 2006a;96:1042–1052. doi: 10.1152/jn.00120.2006. [DOI] [PubMed] [Google Scholar]
- Zhang YH, Kays J, Hodgdon KE, Sacktor TC, Nicol GD. Nerve growth factor enhances the excitability of rat sensory neurons through activation of the atypical protein kinase C isoform, PKM ζ. J Neurophysiol. 2012;107:315–335. doi: 10.1152/jn.00030.2011. [DOI] [PMC free article] [PubMed] [Google Scholar]
- Zhang YH, Vasko MR, Nicol GD. Ceramide, a putative second messenger for nerve growth factor, modulates the TTX-resistant Na+ current and delayed rectifier K+ current in rat sensory neurons. J Physiol. 2002;544:385–402. doi: 10.1113/jphysiol.2002.024265. [DOI] [PMC free article] [PubMed] [Google Scholar]
- Zhang YH, Vasko MR, Nicol GD. Intracellular sphingosine 1-phosphate mediates the increased excitability produced by nerve growth factor in rat sensory neurons. J Physiol. 2006b;575:101–113. doi: 10.1113/jphysiol.2006.111575. [DOI] [PMC free article] [PubMed] [Google Scholar]