

ABSTRACT
Cell migration is a dynamic process that is central to a variety of physiological functions as well as disease pathogenesis. The modulation of cell migration by p27 (officially known as CDKN1B) has been reported, but the exact mechanism(s) whereby p27 interacts with downstream effectors that control cell migration have not been elucidated. By systematically comparing p27+/+ mouse embryonic fibroblasts (MEFs) with genetically ablated p27−/− MEFs using wound-healing, transwell and time-lapse microscopic analyses, we provide direct evidence that p27 inhibits both directional and random cell migration. Identical results were obtained with normal and cancer epithelial cells using complementary knockdown and overexpression approaches. Additional studies revealed that overexpression of manganese superoxide dismutase (MnSOD, officially known as SOD2) and reduced intracellular oxidation played a key role in increased cell migration in p27-deficient cells. Furthermore, we identified signal transducer and activator of transcription 3 (STAT3) as the transcription factor responsible for p27-regulated MnSOD expression, which was further mediated by ERK- and ATF1-dependent transactivation of the cAMP response element (CRE) within the Stat3 promoter. Collectively, our data strongly indicate that p27 plays a crucial negative role in cell migration by inhibiting MnSOD expression in a STAT3-dependent manner.
KEY WORDS: p27, Cell migration, MnSOD, STAT3, CRE
INTRODUCTION
The protein p27 (officially known as CDKN1B) was initially identified as a potent negative regulator of cell cycle that preferentially binds to and inhibits cyclin-D–CDK4/6 and cyclin-E/A–CDK2 complexes (Besson et al., 2008; Chu et al., 2008). Later, more in-depth studies indicated that p27 is a multifunctional protein with additional roles in apoptosis, cell adhesion and migration that are independent of its ability to bind to and inhibit cyclin−CDK complexes (Besson et al., 2004a; Besson et al., 2004b; Baldassarre et al., 2005; Besson et al., 2008; Liu et al., 2010). In contrast to typical tumor suppressor genes, such as p53 and Rb, p27 is rarely mutated or deleted in human cancers (Giordano et al., 2007). Instead, downregulation or mislocalization of p27 is seen frequently in most human cancers, including carcinomas of the breast, colon, prostate, ovary, lung, brain, stomach, skin and haematopoietic cells (Chu et al., 2008). The fact that loss of p27 in epithelial cancers correlates significantly with high tumor grade indicates that p27 might play crucial roles in tumor progression (Slingerland and Pagano, 2000). Lower expression of p27 has been observed in metastatic or invasive tissue as compared with the primary tumor in colorectal adenocarcinoma (Thomas et al., 1998), oral dysplasias and carcinomas (Jordan et al., 1998), and transitional cell carcinoma of the bladder (Lacoste-Collin et al., 2002), suggesting that p27 might regulate the mobility of cancer cells. However, a growing body of evidence shows that the retention of p27 in the cytoplasm leads to the protein adopting an oncogenic role in the regulation of cytoskeletal dynamics and cell migration (Besson et al., 2004a; Besson et al., 2008). The exact function of cytoplasmic p27 is thus an active focus of several recent studies, but different and sometimes contradictory findings have been reported (Liu et al., 2010; See et al., 2010; Bhatia et al., 2010; Borriello et al., 2011; Fearon, 2011; Serres et al., 2011; Wander et al., 2011). In our current studies, we used time-lapse microscopy to monitor the random migration of p27+/+ and p27−/− mouse embryonic fibroblasts (MEFs) in real time. We found that p27−/− MEFs displayed greater random migratory activity than p27+/+ MEFs. Our findings were further confirmed by the use of wound-healing and transwell assays performed on normal epithelial cells with p27 knockdown and cancer epithelial cells with p27 overexpression.
Cell migration is a dynamic process that is central to a variety of biological functions, including embryogenesis, tissue regeneration and immune surveillance (Friedl and Wolf, 2003). Cell migration also plays an important role in disease processes such as cancer metastasis, which inappropriately reactivates developmental migratory programs (Friedl and Wolf, 2003). Growing evidence suggests that reactive oxygen species (ROS) act intrinsically as signaling molecules that regulate various cellular functions, such as migration (Hurd et al., 2012). Mitochondrial electron leak is one of the major sources of ROS production. During oxidative phosphorylation and the transfer of energy along the electron transport chain, superoxide is formed prematurely (Gough and Cotter, 2011). Manganese superoxide dismutase (MnSOD, officially known as SOD2) is one of three superoxide dismutases (SODs) found in mammalian cells. Its strategic subcellular localization in mitochondria allows it to efficiently scavenge superoxides as they are generated (Boveris et al., 1972; Boveris and Chance, 1973; Fridovich, 1986). Early studies showed that MnSOD expression is decreased in some types of cancer, such as prostate cancer and leukemia, when compared with normal tissues. This shifts the redox balance of tumor cells to a more pro-oxidative state; therefore MnSOD was initially regarded as a tumor suppressor gene (Oberley and Buettner, 1979). However, subsequent studies have revealed that the changes in MnSOD expression are dependent on cancer type as well as the progression or aggressive stage of the disease (Miriyala et al., 2012). In bladder cancer, MnSOD expression significantly correlates with high pathological grade, local invasion and distant metastasis stage (Hempel et al., 2009). Therefore, it has been suggested more recently that MnSOD acts as a tumor suppressor during tumor initiation, yet once the tumor progresses to a more aggressive and invasive phenotype, MnSOD levels appear to positively correlate with and contribute to enhanced metastatic behavior of cancer cells (Hempel et al., 2011). Consistent with this notion, the present study shows that loss of p27 expression elevated MnSOD transcription in a STAT3-dependent manner and contributed to the increased cellular migratory capacity.
RESULTS
p27−/− MEFs exhibited increased cell migration capability compared with that of p27+/+ MEFs
The protein p27 plays a crucial negative role in cell cycle progression. Additionally, it also performs cyclin–CDK-independent functions in apoptosis, cytoskeleton rearrangement and transcriptional regulation (Baldassarre et al., 2005; Timmerbeul et al., 2006; Wu et al., 2006; le Sage et al., 2007; Larrea et al., 2009; Belletti et al., 2010; Liu et al., 2010; See et al., 2010; Bhatia et al., 2010; Borriello et al., 2011; Fearon, 2011; Serres et al., 2011; Wander et al., 2011). However, different and sometimes contradictory findings have been reported about the role of p27 in the regulation of cell migration (Liu et al., 2010; See et al., 2010; Bhatia et al., 2010; Borriello et al., 2011; Fearon, 2011; Serres et al., 2011; Wander et al., 2011). The discrepancy might be partially due to differences in the tissues investigated or variations in experimental approaches. To gain an initial insight into the role of p27 in the regulation of cell migration, we first compared the migration capability of p27+/+ and p27−/− MEFs (Fig. 1A) using a wound-healing assay (Debeir et al., 2008). Identically sized wounds were generated in confluent monolayers of p27+/+ and p27−/− MEFs, and the wound-healing process was monitored periodically. As shown in Fig. 1B,C, p27+/+ MEFs were found to migrate more slowly than p27−/− MEFs, and >50% of the wound area remained free of p27+/+ cells at 24 h post-wounding. By contrast, p27−/− MEFs moved rapidly toward the wound, which was almost completely healed by migrating cells at the 24-h time-point (Fig. 1B,C), indicating an inhibitory role of p27 in regulating directional cell motility.
Fig. 1.

p27−/− MEFs exhibited elevated directional and random cell migration capability. (A) Assessment of p27 protein expression in p27+/+ and p27−/− MEFs. (B–E) The wound-healing assay (B,C) and transwell assay (D,E) were used to determine the directional cell migration of p27+/+ and p27−/− MEFs. (F,G) p27+/+ and p27−/− MEFs were pretreated with mitomycin C (10 µg/ml) for 3 h, and the cells were then used in the wound-healing assay (F) and transwell assay (G). (H,I) Cell migration was monitored using time-lapse microscopy. The migration speed, expressed as average speed of cell locomotion (ASL, left panel) and average rate of cell displacement (ARD, right panel), was compared between p27+/+ and p27−/− MEFs using ImageJ software. *P<0.05 (between p27+/+ and p27−/− MEFs). The data shown are representative of three independent experiments.
The transwell assay is another conventional 2D model that monitors directional cell migration. Therefore, we performed a transwell assay, and recorded microscopically the number of cells that had migrated through the porous membrane in response to a high concentration of serum (Hulkower and Herber, 2011). As shown in Fig. 1D,E, the number of p27−/− MEFs that migrated through the membrane was threefold greater than that of p27+/+ MEFs, thus supporting the notion that the presence of p27 strongly repressed directional cell migratory activity.
To prove that the effect of p27 on cell proliferation did not interfere with its function in the regulation of cell migration, the cells were pretreated with mitomycin C for 3 h to constrain cell proliferation, and the amount of cell migration was subsequently determined by using wound-healing and transwell assays. As shown in Fig. 1F,G, p27−/− MEFs still exhibited more rapid migration compared with that of p27+/+ MEFs, although treatment with mitomycin C did reduce the difference between p27+/+ and p27−/− MEFs as observed in the wound-healing assay (Fig. 1C,F) and transwell assay (Fig. 1E,G).
In addition, we used time-lapse microscopy to monitor the random migration of p27+/+ and p27−/− MEFs over a short period (2 h). Periodic acquisition at approximately five-minute intervals was performed. Observations by time-lapse microscopy (supplementary material Fig. S1) revealed that (1) the stationary p27+/+ MEFs exhibited an elongated cell shape, whereas the p27−/− MEFs were flatter, more spread out and larger, containing more protrusions and broad lamellipodia; (2) the p27+/+ MEFs moved slowly and showed little displacement over time, whereas p27−/− MEFs mobilized more actively, migrating further; (3) p27+/+ MEFs showed delays in the retraction of the trailing edge, whereas p27−/− MEFs exhibited efficient release of the rear edge, leading to cell movement (supplementary material Fig. S1). To quantify the lengths and velocity of cell motion in time-lapse experiments, ImageJ software was used to calculate the various parameters of each cell (n = 58 for p27+/+ MEFs; n = 77 for p27−/− MEFs). Absolute motion in x and y coordinates was used to calculate displacement for each cell. The lengths of cell displacement were found to be much greater in p27−/− MEFs compared with those of p27+/+ MEFs (Fig. 1H), suggesting that the mobility of p27−/− MEFs was greater than that of p27+/+ MEFs, as outlined above (supplementary material Fig. S1). In addition, the velocity of protrusion of the leading edge was calculated as the average speed of cell locomotion (ASL) and the average rate of cell displacement (ARD) (Li et al., 2008; Fujita et al., 2009; Li, et al., 2012a). As shown in Fig. 1I, the average movement speed, which reflected migratory activity, was elevated in p27−/− MEFs compared with that of p27+/+ MEFs (33 versus 55 µm/h for ASL; 15 versus 29 µm/h for ARD), suggesting that p27 deficiency increased random cell migration capability as well as directional migration.
The MEFs used here were spontaneously immortalized cell lines. Consequently, it is possible that mutations in genes that regulate migration, such as has been reported for the genes encoding p53 and p16 (Alexandrova et al., 2000; Fingerle-Rowson et al., 2003; Sablina et al., 2003), might be introduced during the immortalization of the cell lines. To confirm that loss of p27 was the only driving force for the changes in cell migration reported above, we performed a reconstitution experiment in which p27−/− MEFs were infected with adenovirus expressing GFP–p27 (Fig. 2A). As shown in Fig. 2B,C, ectopic expression of p27 in p27−/− MEFs reduced the rate of wound closure (5.85%±3.71 versus 56.27%±14.10 of wound area was closed at the 24-h time-point, ±s.d.; Fig. 2B) and cell migration capability as determined by using the transwell assay (141.33±10.69 versus 19.25±2.36 cells/field, Fig. 2C). Next, we used a knockdown approach to confirm our findings in knockout MEFs. Two sets of shRNA targeting different regions of the mouse mRNA encoding p27 were transfected into p27+/+ MEFs, and the stable transfectants were established and used as a mass culture rather than as single clones, in order to avoid the variations among different clones. As shown in Fig. 2D, effective downregulation of p27 expression was observed in p27-knockdown transfectants (shRNA p27-1 and -2) compared with non-silencing control transfectants. Consistent with the results in knockout cells, both shRNA-p27 transfectants exhibited greater migration capability compared with that of the non-silencing control p27+/+ MEFs in wound-healing (Fig. 2E) and transwell assays (Fig. 2F). Pretreatment with mitomycin C was also carried out here, to rule out the possibility of interference from cell proliferation, and increased cell migration was still observed in shRNA-p27 transfectants in the wound-healing and transwell assays (Fig. 2G,H). Taken together, our data strongly indicate that p27 inhibits both random and directional cell migration in MEFs.
Fig. 2.

Knockdown of p27 promoted cell migration. (A–C) GFP–p27 was ectopically expressed in p27−/− MEFs by using an adenovirus delivery method (A). At 24 h post-infection, the wound-healing assay (B) and transwell assay (C) were conducted to confirm the role of p27 in regulation of cell migration. Data show the mean±s.d. (three independent experiments); *P<0.05 (between Ad-GFP-p27- and Ad-GFP-infected cells). (D) Two sets of shRNA targeting different sequences of mouse p27 mRNA were stably transfected into p27+/+ MEFs, and the knockdown efficiency was determined by western blotting. Densitometric quantification of p27 expression is shown. (E,F) The wound-healing assay (E) and transwell assay (F) were used to determine the cell migration capability of shRNA-p27 and non-silencing control transfectants. (G,H) Cells were pretreated with Mitomycin C (10 µg/ml) for 3 h, and the wound-healing assay (G) and transwell assay (H) were conducted to detect the effect of p27-specific shRNA on cell migration. (I) Two sets of p27-specific shRNA were stably transfected into mouse epidermal Cl41 cells, and the knockdown efficiency was determined by western blotting. Densitometric quantification of p27 expression is shown. (J,K) The wound-healing assay (J) and transwell assay (K) were used to determine the cell migration capability of shRNA-p27 transfectants and non-silencing control transfectants. Data show the mean±s.d. (three independent experiments); *P<0.05 (between shRNA p27 and non-silencing control transfectants).
p27 repressed the migration of both normal epithelial cells and bladder cancer cells
To clarify whether the inhibitory role of p27 in regulating cell migration is cell-type or tissue-origin specific, we used JB6 Cl41 cells, which were established from mouse epidermis harboring no mutations in p53, H-ras or other oncogenes tested so far (Cao et al., 1991; Sun et al., 1993). When p27 expression was depleted by stably introducing two sets of p27-specific shRNA into Cl41 cells (Fig. 2I), the migration capability of cells was obviously enhanced, as demonstrated in both the wound-healing assay (Fig. 2J) and the transwell assay (Fig. 2K). This further suggested that the negative role of p27 in the regulation of cell motility was not cell-type specific.
As an atypical tumor suppressor, loss of p27 expression, rather than mutation, is often observed in human cancers (Cordon-Cardo et al., 1998). In transitional bladder carcinoma, several studies have reported a significant negative correlation between p27 expression and tumor grade, distant metastasis and overall survival (Lacoste-Collin et al., 2002; Khan et al., 2003; Schrier et al., 2006; El-Abd et al., 2008; Abd Elazeez et al., 2011). In our study, we compared p27 expression levels among various human bladder cancer cell lines (Fig. 3A,B). We found that in highly invasive grade 4 bladder cancer cell lines (HT1197 and TccSup), p27 expression was obviously diminished when compared with that of other cell lines of lower grades (Fig. 3A,B). In order to determine whether targeting p27 expression could reverse the aberrant migration capability of cancer cells, p27 was ectopically overexpressed in HT1197 cells that had a low level of endogenous p27 (Fig. 3C). In line with our findings above, overexpression of p27 remarkably attenuated the migration of HT1197 cells as determined by using both the transwell assay (Fig. 3D,E, 5.67±2.08 versus 40.67±3.06 cells/field, ±s.d.) and the wound-healing assay (Fig. 3F, 91.92%±3.42 versus 56.41%±6.19 of the wound area remained open at 24-h time-point). Thus, our results show that p27 plays an inhibitory role in cell migration in both normal epidermal JB6 Cl41 cells and human bladder cancer HT1197 cells.
Fig. 3.

Overexpression of GFP–p27 in HT1197 cells repressed cell migration. (A,B) p27 protein expression level was determined in different human bladder cancer cell lines by western blotting. (C) Plasmid encoding GFP-tagged human p27 was stably transfected into HT1197 cells, and the transfection efficiency was validated by western blotting. (D–F) The wound-healing assay (F) and transwell assay (D,E) were used to determine the cell migration of GFP–p27 and vector-control transfectants. Data show the mean±s.d. (three independent experiments); *P<0.05 (between GFP–p27 and vector-control transfectants).
Fig. 5.

MnSOD was responsible for the elevated migration of p27−/− MEFs. (A) MnSOD-specific shRNA was stably transfected into p27−/− MEFs, and the knockdown efficiency was determined by western blotting. (B) The levels of O2•− (upper panel) and H2O2 (lower panel) were evaluated in shRNA-MnSOD and non-silencing control transfectants. (C) The regulatory effect of MnSOD-specific shRNA on cell migration was examined by using the wound-healing assay. *P<0.05 (between shRNA-MnSOD and non-silencing control transfectants). (D) Catalase and Mito-Catalase were stably transfected into p27−/− MEFs, and their expression was validated by western blotting. (E) The H2O2 level was evaluated in catalase and Mito-Catalase transfectants in the absence and presence of 100 µM H2O2. *P<0.05 (between H2O2-treated and medium control); P<0.05 (between catalase and vector-control transfectants in the presence of H2O2). (F,G) The effect of catalase and Mito-Catalase overexpression on cell migration was determined by using the wound-healing assay. *P<0.05 (between catalase overexpression and vector-control transfectants). Data show the mean±s.d.
Repressing MnSOD expression by p27 affected O2•−-mediated cell migration
ROS are a highly reactive group of oxygen-containing molecules that are involved in the redox-dependent regulation of multiple signal transduction pathways. ROS are involved in a wide range of essential biological processes, including apoptosis, proliferation, differentiation, adhesion and cell migration. Therefore, the levels of the two major types of ROS, superoxide (O2•−) and hydrogen peroxide (H2O2), were determined using hydroethidium and dichloro-dihydro-fluorescein diacetate (DCFH-DA) staining assays in p27+/+ and p27−/− MEFs. Our results showed that the O2•− level in p27−/− MEFs was lower than that of p27+/+ MEFs (Fig. 4A), whereas the H2O2 level was much higher compared with that of p27+/+ MEFs (Fig. 4B). O2•− is formed in the mitochondrial respiratory chain, both in complex I, when an oxygen molecule accepts one electron during the auto-oxidation of reduced flavin components of NADH dehydrogenase, and in complex III, during energy transfer from reduced ubisemiquione to molecular oxygen (Bai and Cederbaum, 2001). The prematurely formed O2•− inside mitochondria has a very short half-life due to the rapid conversion into H2O2 by mitochondrial superoxide dismutase (MnSOD), an enzyme which is localized in the mitochondrial matrix (Menon and Goswami, 2007). Subsequently, H2O2 is reduced to H2O and O2 by catalase and/or glutathione peroxidase (Thannickal and Fanburg, 2000). Recent findings suggest that MnSOD expression positively correlates with tumor grade and metastatic phenotype (Hempel et al., 2011; Miriyala et al., 2012). Therefore, we compared MnSOD expression in p27+/+ MEFs and p27−/− MEFs, and we found that in p27−/− MEFs, MnSOD protein expression was elevated (Fig. 4C). The role of p27 in regulating MnSOD expression was confirmed by both knockdown of p27 in p27+/+ MEFs (Fig. 4D) and Cl41 cells (Fig. 4E) and overexpression of p27 in HT1197 cells (Fig. 4F). The expression of catalase remained unchanged in all the above situations (Fig. 4C,D), indicating that p27 negatively regulated the expression of MnSOD, but not that of catalase.
Fig. 4.

p27 inhibited MnSOD expression and maintained redox homeostasis in MEFs. (A,B) O2•− and H2O2 levels were evaluated by using hydroethidium and DCFH-DA staining in p27+/+ and p27−/− MEFs. Data show the mean±s.d.; *P<0.05 (between p27+/+ and p27−/− MEFs). (C–F) Protein expression levels of MnSOD and catalase were determined in the indicated cell lines by western blotting.
In order to assess whether p27 deficiency promoted cell migration through the upregulation of MnSOD expression, MnSOD-specific shRNA was introduced into p27−/− MEFs, and the stable transfectants were established and identified (Fig. 5A). Knockdown of MnSOD expression efficiently reversed the changes in O2•− and H2O2 levels (Fig. 5B). More importantly, it diminished the elevated migratory capability of p27−/− MEFs, as shown in the wound-healing assay (Fig. 5C). By contrast, overexpression of catalase (Fig. 5D) did not inhibit but actually increased cell migration in p27−/− MEFs (Fig. 5F). Consistently, overexpression of catalase only marginally affected the basal level of the H2O2 radical, whereas it did scavenge exogenous H2O2-initiated radicals (Fig. 5E). Moreover, overexpression of mitochondrially targeted catalase (Mito-Catalase) did not cause obvious alterations of either basal or stimulated H2O2 levels (Fig. 5E), and it also failed to affect cell migration (Fig. 5G). Our results indicate that the increased migration observed in p27−/− MEFs is caused by MnSOD-mediated alteration of the redox status.
p27 inhibited MnSOD transcription in a STAT3-dependent manner
In order to further clarify the molecular mechanisms underlying p27-mediated regulation of MnSOD expression, the mRNA level of Mnsod was first determined. The RT-PCR results showed that in p27−/− MEFs, the Mnsod mRNA level was more than fourfold higher than that in p27+/+ MEFs (Fig. 6A). Secondly, an Mnsod promoter luciferase reporter was used to test whether p27 regulated Mnsod transcription. As shown in Fig. 6B, the relative Mnsod promoter activity (normalized to pRL-TK) was 6.12-fold higher in p27−/− MEFs when compared with that of p27+/+ MEFs, demonstrating that p27 repressed Mnsod transcription. Bioinformatic analysis revealed that there were multiple putative STAT3, NFκB, and SP-1 consensus binding sites in the mouse Mnsod promoter region (within 2-kb upstream of the transcription initiation site) (Jung et al., 2009). Therefore, the expression of these transcription factors was compared between p27+/+ and p27−/− MEFs. As shown in Fig. 6C, knockout of p27 resulted in an upregulation of STAT3 expression but did not cause any observable change in the expression of p65 (also known as RELA) or IκBα (also known as NFKBIA) – the major factors for NFκB inactivation – whereas it partially downregulated the expression of p50 (also known as NFKB1) and SP-1, suggesting that p27 might specifically upregulate STAT3 expression. The results obtained from p27 knockdown (Fig. 6D) and overexpression transfectants (Fig. 6E) confirmed the inhibitory effect of p27 on STAT3 expression, suggesting that p27 might regulate Mnsod transcription in a STAT3-dependent manner. Moreover, the expression of MnSOD in various human bladder cancer cells paralleled that of STAT3 (Fig. 6F), and the levels of both proteins were increased in higher-grade cancer cell lines when compared with the low-grade cancer cell line (RT4, Fig. 6F). These results led us to hypothesize a causal relation between STAT3 and MnSOD expression. To investigate this, STAT3-specific shRNA was stably transfected into p27−/− MEFs, and the knockdown efficiency was assessed by both RT-PCR (Fig. 6G) and western blotting (Fig. 6H). The expression of MnSOD mRNA (Fig. 6G) and protein (Fig. 6H) was reduced in STAT3-specific shRNA transfectants when compared with that of non-silencing transfectants. Consistently, knockdown of STAT3 was found to effectively reduce cell migration in p27−/− MEFs (Fig. 6I, 62.60%±4.27 versus 6.40%±0.45 of the wound area remained open at the 24-h time-point), suggesting that the STAT3–MnSOD module was responsible for p27-mediated inhibition of cell migration. Taken together, our results suggest that p27 plays a strong negative regulatory role in cell migration through the suppression of STAT3–MnSOD-mediated redox homeostasis.
Fig. 6.

p27 inhibited MnSOD transcription and cell migration in a STAT3-dependent manner. (A) Mnsod mRNA expression was detected by RT-PCR. Densitometric quantification is shown. (B) Mnsod promoter transactivation was examined and compared between p27+/+ and p27−/− MEFs by using the luciferase reporter assay. *P<0.05 (between p27+/+ and p27−/− MEFs). (C–E) The effect of p27 on the expression of transcription factors was evaluated in the indicated cell lines. Densitometric quantification is shown. (F) The protein expression of MnSOD (upper panel) and STAT3 (lower panel) was compared among various human bladder cancer cell lines. (G–I) STAT3-specific shRNA was stably transfected into p27−/− MEFs, and the knockdown efficiency was determined by RT-PCR (G) and western blotting (H). Densitometric quantification is shown. The effect of STAT3-specific shRNA on cell migration was examined by using the wound-healing assay (I). *P<0.05 (between STAT3-specific shRNA and vector-control transfectants). Data show the mean±s.d.
p27 repressed CRE-mediated STAT3 transcription
STAT proteins have important roles in fundamental processes, including proliferation, development, differentiation, inflammation and migration (Al Zaid Siddiquee and Turkson, 2008). When activated by receptor tyrosine kinases (RTKs) or non-receptor tyrosine kinases (NRTKs) – such as Src, Jaks, or Abl – in response to growth factors, cytokines or other polypeptide ligands, STATs dimerize through reciprocal interactions between phosphorylated tyrosine (pTyr) and the SH2 domain, translocate into the nucleus and bind to specific STAT-response elements (SBE) in the promoters of target genes (Al Zaid Siddiquee and Turkson, 2008). To determine the underlying molecular mechanisms of p27-mediated regulation of STAT3, RT-PCR was performed, and Stat3 mRNA was found to be upregulated in p27−/− MEFs (Fig. 7A). To further assess whether p27 regulates Stat3 transcription or its mRNA stability, actinomycin D (Act D) was employed to block de novo mRNA synthesis and track the decay rate of existing Stat3 mRNA in the cells. As shown in Fig. 7B, a reduction in the level of Stat3 mRNA in the present of Act D occurred around 4 h of treatment, and >90% of Stat3 mRNA had been degraded by 8 h in p27+/+ MEFs. By contrast, in p27−/− MEFs, the degradation of Stat3 mRNA was observed as early as 2 h after Act D treatment, and nearly 90% of Stat3 mRNA had decayed at 4 h. This reduction in Stat3 mRNA expression persisted to 8 h. These results suggest that the elevated level of Stat3 mRNA observed in p27−/− MEFs was not caused by increased Stat3 mRNA stability.
Fig. 7.

p27 suppressed STAT3 transcription by targeting CRE-dependent but not SBE-dependent transcriptional activity. (A) The level of Stat3 mRNA was compared between p27+/+ and p27−/− MEFs by RT-PCR. (B) Stat3 mRNA stability was compared between p27+/+ and p27−/− MEFs in the presence of 5 µM Act D for the indicated time periods. (C,D and G–I) The luciferase activities of full-length and various mutated versions of the Stat3 promoter (C,D) and CRE-transactivation (G–I) was evaluated in p27+/+ and p27−/− MEFs. *P<0.05 (between p27+/+ and p27−/− MEFs). (E,F) Stat3 mRNA level and full-length Stat3-promoter-driven luciferase activity were assessed in shRNA-p27 and non-silencing transfectants. *P<0.05 (between shRNA-p27 and control non-silencing transfectants). Data show the mean±s.d.
To elucidate the potential role of p27 in regulating Stat3 transcription, luciferase reporters containing various lengths of the 5′-flanking region of the mouse Stat3 promoter (Fig. 7C) were transfected into p27+/+ and p27−/− MEFs in combination with pRL-TK vector as an internal control. As shown in Fig. 7D, the promoter activity of the full-length 5′-flanking region of the Stat3 promoter (2.2-kb, construct 417) was increased by 4.1(±0.2)-fold (±s.d.) in p27−/− MEFs when compared with that of p27+/+ MEFs, indicating that the activation of the full-length Stat3 promoter was inhibited by p27. Deletion of the 5′ region up to position −467 (construct 420) substantially increased the difference in Stat3 promoter activity between the two cell lines (43.4±5.7-fold, Fig. 7C,D). Further deletion to position −229 (construct 421) totally prevented the increased Stat3 promoter activity in p27−/− MEFs (0.13±0.001 fold), suggesting that the p27-responsive sequences resided in the −467 to −229 region (Fig. 7C,D). Consistent with the results observed in the knockout cells, knockdown of p27 by two sets of p27-specific shRNA also increased Stat3 mRNA level (Fig. 7E) and full-length Stat3 promoter-driven luciferase activity (Fig. 7F), indicating that p27 attenuated STAT3 expression at the transcriptional level.
Bioinformatic analysis revealed that p27-responsive sequences in the Stat3 promoter contained both an SBE and a CRE within the −337 to −312 region (Fig. 7G). To investigate whether SBE and CRE were required for p27 responsiveness, two different luciferase reporters containing mutations in the SBE (mSBE) or CRE (mCRE) were transfected into p27+/+ and p27−/− MEFs. Mutations in the putative SBE and CRE reduced Stat3 promoter activity by 41.74%±0.66 and 41.31%±7.48, respectively, in p27+/+ MEFs (Fig. 7H). However, mSBE did not cause a reduction in Stat3 promoter activity in p27−/− MEFs when compared with the wild-type promoter (3.03±0.085 versus 2.37±0.0254, Fig. 7H). By contrast, mutations in the putative CRE dramatically reduced the activity of the Stat3 promoter in p27−/− MEFs (0.037±0.018 versus 2.37±0.0254, Fig. 7H). These results indicate that the CRE motif is the major determinant of p27-regulated Stat3 promoter activity. Next, a CRE-dependent transcriptional luciferase reporter plasmid containing the CRE sequences from the intracisternal A-type particle element (Galien et al., 1994; Gupta et al., 2001) was transfected into p27+/+ and p27−/− MEFs. As shown in Fig. 7I, the CRE transactivation was 15-fold higher in p27−/− MEFs, whereas mutations in the CRE motif resulted in non-responsiveness to p27 deletion, suggesting that p27 strongly inhibited CRE-dependent transcriptional activity.
The ERK–ATF1 pathway was involved in the elevated CRE transactivation in p27−/− cells
The cAMP response element binding protein (CREB) is a member of a superfamily of transcription factors that bind to and activate CRE in the promoters of target genes. The proteins CREB, cAMP response element modulator (CREM) and activating transcription factor 1 (ATF1) are the main subcategory members of this family (Lonze and Ginty, 2002). The activation of these transcription factors requires phosphorylation events that are mediated by PKA (for CREB or CREM) or ERKs and MSKs (for ATF1) (Lonze and Ginty, 2002). In order to explore the molecular mechanisms underlying p27-mediated regulation of CRE activation, the phosphorylation status of these family members was examined. As shown in Fig. 8A, the amount of CREB phosphorylated at S133, an important modification that positively regulates CREB transactivation, was decreased in p27−/− MEFs, whereas the amount of ATF1 phosphorylated at S63 was elevated in p27−/− MEFs. Activation of ERK1 and ERK2, the upstream kinases of ATF1, was also increased in p27−/− MEFs (Fig. 8A). Similar findings were obtained in shRNA-p27 transfectants, in which knockdown of p27 caused upregulation of ATF1 phosphorylated at S63 as well as increased levels of ERK1 and ERK2 phosphorylated at T202 and Y204 (Fig. 8B), suggesting that p27 might suppress CRE activity through blocking the activation of the ERK–ATF1 pathway. To test this notion, we prevented ATF1 activation in p27−/− MEFs by using the chemical inhibitor PD98058, which was able to efficiently inhibit MEKs, the kinases upstream of ERKs (Alessi et al., 1995). As shown in Fig. 8C, inhibition of ERK by pre-treatment of cells with PD98059 attenuated ATF1 phosphorylation. Consequently, CRE transactivation was reduced fourfold in p27−/− MEFs in response to PD98059 treatment (Fig. 8D), which led to attenuation of Stat3-promoter-dependent transcription activity (Fig. 8D), as well as reduced expression of STAT3 and MnSOD protein (Fig. 8C). Consequently, PD98059 treatment also inhibited the cell migration capability of p27−/− MEFs (Fig. 8E). Additionally, we used a molecular approach, introducing a dominant-negative mutant form of ERK (DN-ERK2) (Roskoski, 2012) into p27−/− MEFs, to reinforce the findings obtained using the chemical inhibitor. The identification of stable transfectants of DN-ERK2 in p27−/− MEFs was performed by western blotting for overexpressed HA-tagged rat ERK2 containing the K52R mutation (Fig. 8F). Overexpression of DN-ERK2 efficiently decreased ATF1 activation (Fig. 8F) as well as CRE activation (Fig. 8G) in p27−/− MEFs, which consequently caused a reduction in both Stat3 promoter activity (Fig. 8H) and the protein level of STAT3 and MnSOD (Fig. 8F). In addition, the elevated cell migration observed in p27−/− MEFs was also inhibited by DN-ERK2 (Fig. 8I), whereas knockdown of CREB in p27−/− MEFs had only a marginal effect on STAT3 expression (Fig. 8J), indicating that ATF1, rather than CREB, was the main regulator of Stat3 transcription. Lastly, in order to extend our findings that MnSOD was the crucial player in the regulation of the ERK–ATF1–STAT3 pathway-mediated cell migration in p27−/− MEFs, we overexpressed MnSOD in the presence or absence of ERK inhibitor (Fig. 8K). Similar to the results shown in Fig. 8E, treatment with the MEK/ERK inhibitor PD98059 alone obviously reduced cell migration, whereas MnSOD overexpression not only increased cell migration but also abolished the inhibitory effect of PD98059 treatment on cell migration in p27−/− MEFs (Fig. 8K). Taken together, our results conclusively demonstrate that p27 inhibits Stat3 transcription through downregulation of the ERK–ATF1–CRE pathway, which in turn affects MnSOD expression, disturbs the redox homeostasis and further leads to suppression of cell migration, as outlined in Fig. 9.
Fig. 8.

CRE transactivation was mediated by the ERK–ATF1 pathway in p27−/− MEFs. (A,B) The levels of phosphorylated forms of ERK, CREB and ATF1 were assessed by western blotting in p27+/+ and p27−/− MEFs (A) and shRNA-p27 and non-silencing control transfectants (B). (C–E) PD98059 treatment efficiently blocked ERK–ATF1–CRE activation (C,D), STAT3 and MnSOD expression (C,D) and cell migration in p27−/− MEFs (E). *P<0.05 (between PD98059 treatment and medium control); P<0.05 (between p27+/+ and p27−/− MEFs). (F–I) DN-ERK2 stable transfectants were identified by western blotting (F). Ectopic expression of DN-ERK2 impaired ATF1–CRE activation (F,G), Stat3 transcription (H), Stat3 protein expression (F) and cell migration in p27−/− MEFs (I). *P<0.05 (between DN-ERK2 and vector-control transfectants). (J) Knockdown of CREB did not affect STAT3 expression. (K) MnSOD was overexpressed in p27−/− MEFs and the cell migration was assessed by using the wound-healing assay in the presence or absence of the ERK inhibitor PD98059. For panels A–C,F,J, densitometric quantification is shown beneath the blots.
Fig. 9.
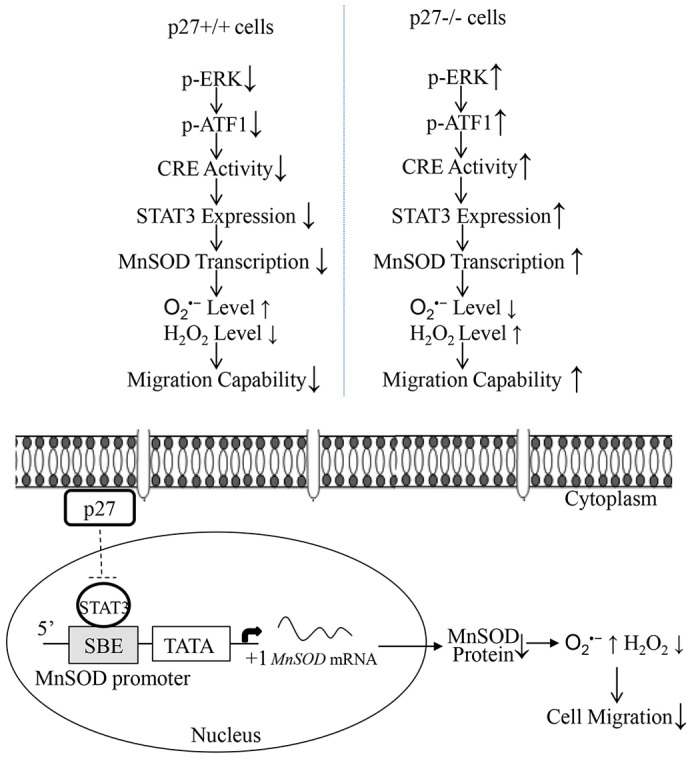
The molecular mechanisms underlying p27-mediated inhibition of cell migration. p27 inhibits Stat3 transcription by downregulation of ERK–ATF1–CRE-dependent transcriptional activity, which in turn affects MnSOD expression and the redox environment, and leads to the suppression of cell migration.
DISCUSSION
The protein p27 was initially recognized as an inhibitor of cyclin-E–CDK2 complexes, modulating the TGFβ-induced cell cycle arrest in G1 phase (Polyak et al., 1994). Recent studies have shown that p27 plays other essential roles in the regulation of cell differentiation and apoptosis (Liu et al., 2010; Li et al., 2012b). However, the function of p27 in cell motility has not yet been fully elucidated (Liu et al., 2010; See et al., 2010; Bhatia et al., 2010; Borriello et al., 2011; Fearon, 2011; Serres et al., 2011; Wander et al., 2011). By employing genetically disrupted p27−/− MEFs and their littermated p27+/+ MEFs, as well as knockdown of p27 in mouse epidermal Cl41 cells and ectopic expression of p27 in human bladder cancer HT1197 cells, our current study provides conclusive evidence showing that p27 inhibits both directional and random cell migration. Our investigation revealed that by inhibiting STAT3-mediated transcription of MnSOD in an ERK–ATF1–CRE-dependent manner, p27 maintains the level of intracellular O2•−, which functions as a signaling molecule in inhibiting cell migration. Our present findings suggest that enhancing p27 tumor suppressive activity not only blocks cell proliferation, but also maintains the intracellular redox microenvironment, leading to suppression of cell migration. Therefore, the findings reported here might reveal a novel molecular basis for p27 as a tumor suppressor.
By employing wound-healing and transwell assays, the two classic methods to detect directional cell migration, p27−/− MEFs were found to exhibit more active migratory capability when compared with that of p27+/+ MEFs in both the absence and the presence of the cell proliferation inhibitor mitomycin C. These findings were further extended and strengthened by using time-lapse microscopy to monitor and compare the migratory activity of p27+/+ and p27−/− MEFs constantly over a 2-h period, in order to exclude the effect of p27 on cell proliferation. Quantification of the lengths and velocity of cell motion in time-lapse experiments showed that cell migration length and displacement rate in p27−/− MEFs were increased compared with those of p27+/+ MEFs. Furthermore, our findings were validated in normal mouse epidermal Cl41 cells by knockdown of p27, and in human transitional bladder cancer HT1197 cells by overexpression of p27. Therefore, our results suggest that p27 plays an important role in the negative regulation of cell migration in all the cell lines tested in our study. Consistent with our findings, there are several reports demonstrating the suppressive effects of p27 on cell migration in various cell types. For instance Goukassian et al. have reported that overexpression of p27 by doxycycline-regulated adenovirus inhibits endothelial cell proliferation and migration in vitro, as well as angiogenesis in vivo (Goukassian et al., 2001). Cytoplasmic p27 is also reported to have the ability to bind to and inhibit stathmin, thus affecting microtubule stability following cell adhesion to extracellular matrix components (Baldassarre et al., 2005). High levels of cytoplasmic p27 and low stathmin expression suppress human sarcoma cell migration and invasion in vivo (Baldassarre et al., 2005). All of the evidence suggests a promising anti-angiogenic therapy approach based on the overexpression of p27.
Oxidative stress is caused by an excessive production of ROS that outstrips antioxidant defense capability. This stress plays an important role in tumorigenesis and cancer development. As one of the most efficient ROS-scavenging enzymes, MnSOD was initially defined as a tumor suppressor, although further investigations have demonstrated that MnSOD plays a dichotomous role in tumorigenesis (Hempel et al., 2011). On one hand, overexpression of MnSOD leads to growth retardation resulting from induction of cancer cell senescence (Plymate et al., 2003; Behrend et al., 2005) and apoptosis (Hurt et al., 2007); on the other hand, MnSOD levels appear to positively correlate with and contribute to enhanced metastatic behavior of certain types of cancer cells (Hempel et al., 2011). The most recent studies have shown increased levels of MnSOD expression in cancer cells of various tissue origins (Hu et al., 2005), positively correlating with aggressive or metastatic stages of cancers (Malafa et al., 2000; Ennen et al., 2011). Altered transcription factor profiles in cancer cells, such as aberrant activation of NFκB (Dhar et al., 2010; Holley et al., 2010), SP-1(Dhar et al., 2010) and inactivation of p53 (Dhar et al., 2010), are suggested to be attributable to increases in MnSOD expression.
Our current study, to the best of our knowledge, for the first time demonstrates that p27 maintains MnSOD expression at a relatively low level by inhibiting STAT3-dependent Mnsod transcription, which further maintains intracellular redox homeostasis and contributes to the inhibition of cell migration. Our results show that in p27−/− MEFs, both MnSOD transcription and protein levels were elevated when compared with those of p27+/+ MEFs. Transfection of MnSOD-specific shRNA into p27−/− MEFs inhibited the elevated cell migration activity, clearly demonstrating that the inhibitory role of p27 in cell migration is achieved by downregulation of Mnsod transcription. The expression of STAT3 was consistently upregulated in p27−/− cells, and knockdown of STAT3 remarkably reduced MnSOD expression, as well as cell migration, suggesting that p27 inhibits Mnsod transcription in a STAT3-dependent manner, which further leads to repression of cell migration. Thus, it is likely that, in certain types of cancers with loss of p27 expression, Mnsod transcription is relieved from the stringent control mediated by p27, resulting in its overexpression and contributing to the more aggressive malignancy states.
STAT3 is a potent transcription factor, and lies as a convergent downstream target of many of the signaling pathways that are triggered by cytokines, growth factors and oncogenes. STAT3 is found to be constitutively activated in a wide range of tumors and transformed cell lines (Sara et al., 2000). Therefore, STAT3 frequently correlates with tumorigenesis, and it is generally considered as an oncogene (Sara et al., 2000). Thus, through manipulating STAT3 expression, p27 might alleviate a wide variety of oncogenic cellular processes, including cell migration, which might shed light on the anti-cancer properties of p27. Our current study shows that Stat3 transcription and mRNA levels were elevated in p27−/− MEFs. By employing luciferase reporters containing various lengths of 5′-flanking region from the mouse Stat3 promoter, we found that the p27-responsive sequences localized within the −467 to −229 bp region, which contained a putative STAT3-binding site and a CRE-consensus-binding site. Mutating the putative CRE sequences, but not SBE sites, severely reduced Stat3 promoter activity in p27−/− MEFs, indicating that p27 inhibited Stat3 transcription by abrogating CRE activity. Our results presented here are consistent with our recent finding that p27 suppresses Cox-2 transcription in a CRE-dependent manner during arsenite exposure (Che et al., 2013).
Consistent with our findings, Hirano et al. have also reported that Stat3 is able to autoregulate its expression by cooperation with CREB family members, but c-Jun, CREB, ATF2–4 are not bound to the Stat3 promoter in response to IL-6 (Ichiba et al., 1998). Our present study further provides strong evidence showing that the ERK–ATF1 pathway indeed plays a major role in the control of CRE transactivation as well as STAT3 expression. ERKs are known as essential regulators of cell adhesion and migration through directly activating important effectors that govern cell movement, such as myosin light chain kinase (MLCK), calpain or FAK (Huang et al., 2004). Our findings here expand the effects of ERKs into the field of coordinating redox status through regulating the activation cascade of ATF1–CRE–STAT3–MnSOD. Our on-going studies suggest that p27 might target the activation of the Ras–Raf–MEK pathway, which further leads to the inhibition of ERK activation (D.Z. and C.H., data not shown).
Clinical investigations have demonstrated that interfering with STAT3 activity in tumor systems impairs tumor invasiveness and metastatic potential (Sara et al., 2000). Mechanistic studies using conditional STAT3−/− MEFs have revealed that STAT3 interacts with the C-terminal region (amino acids 30–150) of stathmin, antagonizing the microtubule destabilization function of stathmin and preventing its over-activation. Therefore, STAT3 modulates and balances the microtubule network (Ng et al., 2006). Taken together with the findings of other researchers, our data suggests that p27 might interfere with the effects of STAT3 in cell migration by (1) abrogation of Stat3 transcription through impairment of the ERK–ATF–CRE cascade; (2) competition with STAT3 for binding to stathmin, because p27 is also reported to directly interact with the C-terminal region of stathmin (amino acids 25–149) and counteract its tubulin sequestering activity (Baldassarre et al., 2005). In addition, p27-mediated inhibition of cell migration might also rely on the inhibition of ERK activation, which subsequently leads to (1) suppression of ATF1-mediated CRE activity, which further affects Stat3 transcription and MnSOD-dependent redox status; (2) direct inhibition of the activation of MLCK, calpain or FAK, the well-documented executors that function downstream of ERKs in the regulation of cell adhesion and migration (Huang et al., 2004). Taking into consideration the fact that tumor cells often display increased levels of intercellular ROS (Pinthus et al., 2011), our findings on the novel function of p27 in maintenance of the intracellular redox microenvironment might enable us to design more effective strategies for using p27 in the treatment of cancer. For instance, overexpression of p27 could be used in combination with STAT3 antagonists in place of dietary antioxidant supplementation, which still has contradictory effects on chemotherapy, as reported in various clinical investigations (Bagley Jr., 1999; Drisko et al., 2003; Simone et al., 2007; Lawenda et al., 2008).
In summary, our study shows that loss of p27 expression increases MnSOD transcription in a STAT3-dependent manner, causing disturbance of redox homeostasis and an increase in migratory capability. We also show that p27 profoundly inhibits the ERK–ATF1 pathway, which further affects CRE-dependent Stat3 transcription. Therefore, our present findings provide a novel molecular basis for p27 inhibition in cell migration; namely, p27 maintains redox homeostasis by suppressing the ERK–ATF1–STAT3–MnSOD axis.
MATERIALS AND METHODS
Cell culture
3T3-protocol-immortalized p27 wild-type (p27+/+) and p27-deficient (p27−/−) mouse embryonic fibroblasts (MEFs) (Kiyokawa et al., 1996), as well as their stable transfectants, were maintained at 37°C under 5% CO2 in Dulbecco's modified Eagle's medium (DMEM) supplemented with 10% fetal bovine serum (FBS; Nova-Tech, Grand Island, NE), 2 mM l-glutamine and 25 µg/ml gentamicin. Mouse epidermal JB6 Cl41 cells and human transitional bladder cancer HT1197 cells were cultured in MEM with 5% and 10% FBS, respectively. The cultures were dissociated with trypsin and transferred to new 75-cm2 culture flasks (Fisher, Pittsburgh, PA) twice a week. During the experimental time period, no obvious signs of senescence, such as increased cell size or flattening of the cytoplasm, were observed in the immortalized MEFs. PD98059 and mitomycin C were purchased from Calbiochem-EMD Millipore (Darmstadt, Germany). Hydrogen peroxide (30–35%) was purchased from Thermo Fisher Scientific (Pittsburg, PA).
Constructs, transfection and adenovirus infection
shRNA constructs against mouse p27 and MnSOD were purchased from Open Biosystems (Thermo Fisher Scientific., Huntsville, AL). The shRNA construct against mouse STAT3 was purchased from Sigma-Aldrich (St. Louis, MO). The MnSOD promoter luciferase reporter containing 2.0-kb of the human Mnsod promoter sequences was a generous gift from Maria Monsalve (Fundación Centro Nacional de Investigaciones Cardiovasculares Carlos III, Madrid, Spain) (Olmos et al., 2009). Murine Stat3 promoter luciferase reporters, containing the mouse Stat3 promoter fragments of −2166–+61 (217), −476–+61 (220) and −229–+61 (221), as well as mutations in the SBE and CRE, were kindly provided by Toshio Hirano (Osaka University Medical School, Suita City, Osaka, Japan) (Ichiba et al., 1998). CRE luciferase reporter plasmids containing the CRE sequences from the intracisternal A-type particle element, as well as a mutant version, were described previously (Galien et al., 1994; Gupta et al., 2001). Expression plasmids for SOD, mitochondrially targeted catalase (Mito-Catalase) and catalase, as well as the parental control vector pSV-Zeo were kindly provided by Juan Andres Melendez (Center for Immunology and Microbial Disease, Albany Medical College, Albany, NY) (Rodríguez et al., 2000; Ding et al., 2006; Zhang et al., 2013). The plasmid encoding dominant-negative ERK2, which contained a K52R mutation of rat ERK2, was as published previously (Frost et al., 1994). GFP–p27 was from Gustavo Baldassarre (Division of Experimental Oncology, Centro di Riferimento Oncologico, National Cancer Institute, Aviano, Italy). All of the transfectants were used as a mass pool rather than as individual clones. Adenovirus carrying GFP–p27 was packaged as reported previously (Liu et al., 2010). For infection, virus was added to cells for 24 h, and >80% of cells showed green fluorescence.
Reverse transcription polymerase chain reaction
Total RNA was extracted from the cells using Trizol reagent (Invitrogen, Carlsbad, California). Total cDNAs were synthesized by using the ThermoScript ™ RT-PCR system (Invitrogen). The amount of mRNA of genes of interest was measured by semi-quantitative RT-PCR. The primer sequences were as follows: mouse Stat3 (product length, 203 bp), 5′-TGATCGTGACTGAGGAGCTG-3′ and 5′-TGGCGGCTTAGTGAAGAAGT-3′; mouse Mnsod (product length, 191 bp), 5′-ACAACAGGCCTTATTCCGCTGCT-3′ and 5′-CCCGGAGCCTGGCACTCAATG-3′; mouse Gapdh (product length, 283 bp), 5′-TGCAGTGGCAAAGTGGAGATT-3′ and 5′-TTTTGGCTCCACCCTTCAAGT-3′; mouse Actb (product length, 287 bp), 5′-GACGATGATATTGCCGCACT-3′ and 5′-GATACCACGCTTGCTCTGAG-3′. The PCR products were separated on 2% agarose gels, stained with ethidium bromide and scanned under UV light. The results were displayed with an Alpha Innotech SP image system (Alpha Innotech Corporation., San Leandro, CA). The density of bands was quantified relative to that of loading controls by densitometric analysis using NIH ImageJ software.
Luciferase reporter assay
p27+/+ and p27−/− MEFs were transfected with Mnsod and Stat3 promoter luciferase reporter constructs, as well as CRE luciferase reporter, in combination with the pRL-TK vector (Promega) as an internal control. The luciferase activities were determined by using a luminometer (Wallac 1420 Victor 2 multilabel counter system), as described previously (Song et al., 2007).
Time-lapse observation
Cells were maintained in an incubator during the entire experiment. 4-(2-hydroxyethyl)-1-piperazineethanesulfonic acid (HEPES, 25 mM) was added to the medium, and the pH was adjusted to 7.4. Time-lapse imaging was performed with a Leica 6000B microscope (Leica Microsystems, Buffalo Grove, IL) to digitally record cell motility (images were acquired every 5 min).
Transwell assay
Control inserts without Matrigel were purchased from BD Biosciences (Bedford, MA). Cells were seeded onto inserts in triplicate, in 200μl of serum-free medium. Inserts were placed into wells containing 700μl of medium supplemented with 10% FBS. The cells were incubated for 22 h. Cells on the upper surface of the filters were completely removed by wiping with a cotton swab. The inserts were then fixed in methanol and stained with Giemsa. The numbers of migrated cells attached to the other side of the insert were counted under a light microscope in eight random fields at a magnification of ×200. The number of migrated cells per image was determined using ImageJ software. The data shown are representative of three independent experiments.
Wound-healing assay
When cells reached ∼80% confluence, a scratch was generated on the confluent monolayer using a silicon-coated pipette tip, which preserved the extracellular matrix across the scratched area (Grasso et al., 2007). Photographs showing the areas of the wounds in the control group and test group were taken at specific time-points up to 24 h. The wound areas were quantified by using cell migration analysis software (Muscale LLC., Scottsdale, AZ).
Intracellular O2•− and H2O2 staining assays
After the cell O2•− density reached ∼90%, the cells were washed thoroughly with 1× PBS. Cells were then incubated in the dark with 10μM HE or 10μM DCFH-DA at 37°C for 15–20 min. The same amount of DMSO was added to the solvent control group. The cells were then washed twice with 1× PBS to remove the extracellular compounds (Li et al., 2006; Li et al., 2011). For the H2O2 pre-treatment, 100 µM H2O2 was added to the cells at 2 h before DCHF-DA staining. Fluorescence was detected with a fluorescence spectrophotometer SpectraMAX M2 (Molecular Devices Corp, Sunnyvale, CA) using an excitation wavelength of 485 nm and emission wavelength of 538 nm for the measurement of H2O2, and an excitation wavelength of 485 nm and emission wavelength of 590 nm for the measurement of O2•− (Li et al., 2011). The samples were protected from light during the entire protocol.
Western blotting assay
The cells were washed twice with ice-cold PBS and collected in the cell lysis buffer (10 mM Tris-HCl pH 7.4, 1% SDS, 1 mM Na3VO4). The cell extracts were sonicated, denatured by heating to 100°C for 5 min and quantified with a Dc protein assay kit (Bio-Rad, Hercules, CA). Equal aliquots of cell extracts were separated on SDS-polyacrylamide gels. The proteins were then transferred to polyvinylidene fluoride (PVDF) membranes (Bio-Rad, Hercules, CA), blocked and probed with antibodies against one of the following proteins: phospho-ERK T202/Y204, phospho-CREB S133 (this antibody also detects phospho-ATF1 S63), total ERK, total CREB, STAT3, IκBα, GAPDH (Cell Signaling Technology, Beverly, MA), p27 (Abcam, Cambridge, MA), MnSOD (Upstate Biotechnology, Lake Placid, NY), catalase, HA, p65, p50, SP-1 (Santa Cruz Biotechnology, CA) or β-Actin (Sigma). Primary-antibody-bound proteins were detected by using an alkaline-phosphatase-conjugated secondary antibody and an ECF western blotting system (Amersham, Piscataway, NJ). The densitometric analyses of the protein bands relative to the individual loading controls were performed using the ImageQuant 5.2 software (GE Healthcare). The results shown are representative of three independent experiments.
Statistical analysis
The significance of the differences between the treated and untreated groups was determined with the Wilcoxon Rank Sum Test. The results are expressed as the mean±s.d.
Supplementary Material
Acknowledgments
We thank Maria Monsalve for her generous gift of the Mnsod promoter luciferase reporter plasmid, Toshio Hirano for murine Stat3 promoter luciferase reporters, Juan Andres Melendez for the catalase and Mito-Catalase expression plasmids, and Gustavo Baldassarre for the GFP–p27 plasmid. N.W.Z. is a summer student from Monroe-Woodbury High School, 155, Dunderberg Road, Central Valley, NY 10917, USA.
Footnotes
Competing interests
The authors declare no competing interests.
Author contributions
D.Z. performed the experiments, analyzed the data and wrote the manuscript. Y.W. and Y.L. performed the experiments required in revision. M.Z., J.W., X.Z., F.L., Y.M., N.W.Z. and J.L. performed the experiments. X.-R.W. analyzed the data. C.H. conceived and designed the experiments, analyzed the data and wrote the manuscript.
Funding
This work was supported partially by grants from the National Cancer Institute at the National Institutes of Health [grant numbers CA1659805, CA17766 and CA112557] and the National Institute of Environmental Health Sciences [grant number ES000260]. Deposited in PMC for release after 12 months.
Supplementary material available online at http://jcs.biologists.org/lookup/suppl/doi:10.1242/jcs.148130/-/DC1
References
- Abd Elazeez T. A., El-Balshy A-L., Khalil M. M., El-Tabye M. M., Abdul-Halim H. (2011). Prognostic significance of P27 (Kip 1) and MUC1 in papillary transitional cell carcinoma of the urinary bladder. Urol. Ann. 3, 8–13 10.4103/0974--7796.75857 [DOI] [PMC free article] [PubMed] [Google Scholar]
- Al Zaid Siddiquee K., Turkson J. (2008). STAT3 as a target for inducing apoptosis in solid and hematological tumors. Cell Res. 18, 254–267 10.1038/cr.2008.18 [DOI] [PMC free article] [PubMed] [Google Scholar]
- Alessi D. R., Cuenda A., Cohen P., Dudley D. T., Saltiel A. R. (1995). PD 098059 is a specific inhibitor of the activation of mitogen-activated protein kinase kinase in vitro and in vivo. J. Biol. Chem. 270, 27489–27494 10.1074/jbc.270.46.27489 [DOI] [PubMed] [Google Scholar]
- Alexandrova A., Ivanov A., Chumakov P., Kopnin B., Vasiliev J. (2000). Changes in p53 expression in mouse fibroblasts can modify motility and extracellular matrix organization. Oncogene 19, 5826–5830 [DOI] [PubMed] [Google Scholar]
- Bai J., Cederbaum A. I. (2001). Mitochondrial catalase and oxidative injury. Neurosignals 10, 189–199 10.1159/000046887 [DOI] [PubMed] [Google Scholar]
- Baldassarre G., Belletti B., Nicoloso M. S., Schiappacassi M., Vecchione A., Spessotto P., Morrione A., Canzonieri V., Colombatti A. (2005). p27(Kip1)-stathmin interaction influences sarcoma cell migration and invasion. Cancer Cell 7, 51–63 10.1016/j.ccr.2004.11.025 [DOI] [PubMed] [Google Scholar]
- Behrend L., Mohr A., Dick T., Zwacka R. M. (2005). Manganese superoxide dismutase induces p53-dependent senescence in colorectal cancer cells. Mol. Cell. Biol. 25, 7758–7769 10.1128/MCB.25.17.7758--7769.2005 [DOI] [PMC free article] [PubMed] [Google Scholar]
- Belletti B., Pellizzari I., Berton S., Fabris L., Wolf K., Lovat F., Schiappacassi M., D'Andrea S., Nicoloso M. S., Lovisa S. et al. (2010). p27kip1 controls cell morphology and motility by regulating microtubule-dependent lipid raft recycling. Mol. Cell. Biol. 30, 2229–2240 10.1128/MCB.00723--09 [DOI] [PMC free article] [PubMed] [Google Scholar]
- Besson A., Assoian R. K., Roberts J. M. (2004a). Regulation of the cytoskeleton: an oncogenic function for CDK inhibitors? Nat. Rev. Cancer 4, 948–955 10.1038/nrc1501 [DOI] [PubMed] [Google Scholar]
- Besson A., Gurian-West M., Schmidt A., Hall A., Roberts J. M. (2004b). p27Kip1 modulates cell migration through the regulation of RhoA activation. Genes Dev. 18, 862–876 10.1101/gad.1185504 [DOI] [PMC free article] [PubMed] [Google Scholar]
- Besson A., Dowdy S. F., Roberts J. M. (2008). CDK inhibitors: cell cycle regulators and beyond. Dev. Cell 14, 159–169 10.1016/j.devcel.2008.01.013 [DOI] [PubMed] [Google Scholar]
- Bhatia B., Malik A., Fernandez-L A., Kenney A. M. (2010). p27(Kip1), a double-edged sword in Shh-mediated medulloblastoma: Tumor accelerator and suppressor. Cell Cycle 9, 4307–4314 10.4161/cc.9.21.13441 [DOI] [PMC free article] [PubMed] [Google Scholar]
- Borriello A., Bencivenga D., Criscuolo M., Caldarelli I., Cucciolla V., Tramontano A., Borgia A., Spina A., Oliva A., Naviglio S. et al. (2011). Targeting p27Kip1 protein: its relevance in the therapy of human cancer. Expert Opin. Ther. Targets 15, 677–693 10.1517/14728222.2011.561318 [DOI] [PubMed] [Google Scholar]
- Boveris A., Chance B. (1973). The mitochondrial generation of hydrogen peroxide. General properties and effect of hyperbaric oxygen. Biochem. J. 134, 707–716 [DOI] [PMC free article] [PubMed] [Google Scholar]
- Boveris A., Oshino N., Chance B. (1972). The cellular production of hydrogen peroxide. Biochem. J. 128, 617–630 [DOI] [PMC free article] [PubMed] [Google Scholar]
- Cao Y., Sun Y., Poirier S., Winterstein D., Hegamyer G., Seed J., Malin S., Colburn N. H. (1991). Isolation and partial characterization of a transformation-associated sequence from human nasopharyngeal carcinoma. Mol. Carcinog. 4, 297–307 10.1002/mc.2940040408 [DOI] [PubMed] [Google Scholar]
- Che X., Liu J., Huang H., Mi X., Xia Q., Li J., Zhang D., Ke Q., Gao J., Huang C. (2013). p27 suppresses cyclooxygenase-2 expression by inhibiting p38β and p38δ-mediated CREB phosphorylation upon arsenite exposure. Biochim. Biophys. Acta 1833, 2083–2091 [DOI] [PMC free article] [PubMed] [Google Scholar]
- Chu I. M., Hengst L., Slingerland J. M. (2008). The Cdk inhibitor p27 in human cancer: prognostic potential and relevance to anticancer therapy. Nat. Rev. Cancer 8, 253–267 10.1038/nrc2347 [DOI] [PubMed] [Google Scholar]
- Cordon-Cardo C., Koff A., Drobnjak M., Capodieci P., Osman I., Millard S. S., Gaudin P. B., Fazzari M., Zhang Z-F., Massague J. et al. (1998). Distinct altered patterns of p27KIP1 gene expression in benign prostatic hyperplasia and prostatic carcinoma. J. Natl. Cancer Inst. 90, 1284–1291 10.1093/jnci/90.17.1284 [DOI] [PubMed] [Google Scholar]
- Debeir O., Adanja I., Kiss R., Decaestecker C. (2008). The Motile Actin System in Health and Disease, Models of Cancer Cell Migration and Cellular Imaging and Analysis Ampe C, Lambrechts A, ed123–156 [Google Scholar]
- Dhar S. K., Xu Y., St Clair D. K. (2010). Nuclear factor kappaB- and specificity protein 1-dependent p53-mediated bi-directional regulation of the human manganese superoxide dismutase gene. J. Biol. Chem. 285, 9835–9846 10.1074/jbc.M109.060715 [DOI] [PMC free article] [PubMed] [Google Scholar]
- Ding J., Zhang X., Li J., Song L., Ouyang W., Zhang D., Xue C., Costa M., Meléndez J. A., Huang C. (2006). Nickel compounds render anti-apoptotic effect to human bronchial epithelial Beas-2B cells by induction of cyclooxygenase-2 through an IKKbeta/p65-dependent and IKKalpha- and p50-independent pathway. J. Biol. Chem. 281, 39022–39032 10.1074/jbc.M604798200 [DOI] [PubMed] [Google Scholar]
- Drisko J. A., Chapman J., Hunter V. J. (2003). The use of antioxidant therapies during chemotherapy. Gynecol. Oncol. 88, 434–439 10.1016/S0090--8258(02)00067--7 [DOI] [PubMed] [Google Scholar]
- El-Abd E., Hassan A., El-Ashry O., Al-Ipshiti M., El-Swedy S. (2008). p27 and mdm2 as molecular grading biomarkers in transitional cell carcinoma. Turkish Journal of Cancer 38, 68–77 [Google Scholar]
- Ennen M., Minig V., Grandemange S., Touche N., Merlin J-L., Besancenot V., Brunner E., Domenjoud L., Becuwe P. (2011). Regulation of the high basal expression of the manganese superoxide dismutase gene in aggressive breast cancer cells. Free Radic. Biol. Med. 50, 1771–1779 10.1016/j.freeradbiomed.2011.03.013 [DOI] [PubMed] [Google Scholar]
- Fearon E. (2011). The sweet secrets of p27kip1 regulation and function in cell migration. Cell Cycle 10, 3429–3430 10.4161/cc.10.20.17529 [DOI] [PubMed] [Google Scholar]
- Fingerle-Rowson G., Petrenko O., Metz C. N., Forsthuber T. G., Mitchell R., Huss R., Moll U., Müller W., Bucala R. (2003). The p53-dependent effects of macrophage migration inhibitory factor revealed by gene targeting. Proc. Natl. Acad. Sci. USA 100, 9354–9359 10.1073/pnas.1533295100 [DOI] [PMC free article] [PubMed] [Google Scholar]
- Fridovich I. (1986). Superoxide dismutases. Adv. Enzymol. Relat. Areas Mol. Biol. 58, 61–97 [DOI] [PubMed] [Google Scholar]
- Friedl P., Wolf K. (2003). Tumour-cell invasion and migration: diversity and escape mechanisms. Nat. Rev. Cancer 3, 362–374 10.1038/nrc1075 [DOI] [PubMed] [Google Scholar]
- Frost J. A., Geppert T. D., Cobb M. H., Feramisco J. R. (1994). A requirement for extracellular signal-regulated kinase (ERK) function in the activation of AP-1 by Ha-Ras, phorbol 12-myristate 13-acetate, and serum. Proc. Natl. Acad. Sci. USA 91, 3844–3848 10.1073/pnas.91.9.3844 [DOI] [PMC free article] [PubMed] [Google Scholar]
- Fujita S., Ohshima M., Iwata H. (2009). Time-lapse observation of cell alignment on nanogrooved patterns. J. R. Soc. Interface 6, 269–277 10.1098/rsif.2008.0428.focus [DOI] [PMC free article] [PubMed] [Google Scholar]
- Galien R., Emanoil-Ravier R., Mercier G. (1994). Differential effects of c-jun and CREB on c-AMP response element activation by Ha-ras. Oncogene 9, 1101–1108 [PubMed] [Google Scholar]
- Giordano A., Bovicelli A., Kurman R. (2007). Molecular Pathology of Gynecologic Cancer Totowa, NJ: Humana Press [Google Scholar]
- Gough D. R., Cotter T. G. (2011). Hydrogen peroxide: a Jekyll and Hyde signalling molecule. Cell Death Dis. 2, e213 10.1038/cddis.2011.96 [DOI] [PMC free article] [PubMed] [Google Scholar]
- Goukassian D., Diez-Juan A., Asahara T., Schratzberger P., Silver M., Murayama T., Isner J. M., Andres V. (2001). Overexpression of p27(Kip1) by doxycycline-regulated adenoviral vectors inhibits endothelial cell proliferation and migration and impairs angiogenesis. FASEB J. 15, 1877–1885 [DOI] [PubMed] [Google Scholar]
- Grasso S., Hernández J. A., Chifflet S. (2007). Roles of wound geometry, wound size, and extracellular matrix in the healing response of bovine corneal endothelial cells in culture. Am. J. Physiol. 293, C1327–C1337 10.1152/ajpcell.00001.2007 [DOI] [PubMed] [Google Scholar]
- Gupta A., Butts B., Kwei K. A., Dvorakova K., Stratton S. P., Briehl M. M., Bowden G. T. (2001). Attenuation of catalase activity in the malignant phenotype plays a functional role in an in vitro model for tumor progression. Cancer Lett. 173, 115–125 10.1016/S0304--3835(01)00656--5 [DOI] [PubMed] [Google Scholar]
- Hempel N., Ye H., Abessi B., Mian B., Melendez J. A. (2009). Altered redox status accompanies progression to metastatic human bladder cancer. Free Radic. Biol. Med. 46, 42–50 10.1016/j.freeradbiomed.2008.09.020 [DOI] [PMC free article] [PubMed] [Google Scholar]
- Hempel N., Carrico P. M., Melendez J. A. (2011). Manganese superoxide dismutase (Sod2) and redox-control of signaling events that drive metastasis. Anticancer. Agents Med. Chem. 11, 191–201 10.2174/187152011795255911 [DOI] [PMC free article] [PubMed] [Google Scholar]
- Holley A. K., Xu Y., St Clair D. K., St Clair W. H. (2010). RelB regulates manganese superoxide dismutase gene and resistance to ionizing radiation of prostate cancer cells. Ann. N. Y. Acad. Sci. 1201, 129–136 10.1111/j.1749--6632.2010.05613.x [DOI] [PMC free article] [PubMed] [Google Scholar]
- Hu Y., Rosen D. G., Zhou Y., Feng L., Yang G., Liu J., Huang P. (2005). Mitochondrial manganese-superoxide dismutase expression in ovarian cancer: role in cell proliferation and response to oxidative stress. J. Biol. Chem. 280, 39485–39492 10.1074/jbc.M503296200 [DOI] [PubMed] [Google Scholar]
- Huang C., Jacobson K., Schaller M. D. (2004). MAP kinases and cell migration. J. Cell Sci. 117, 4619–4628 10.1242/jcs.01481 [DOI] [PubMed] [Google Scholar]
- Hulkower K. I., Herber R. L. (2011). Cell migration and invasion assays as tools for drug discovery. Pharmaceutics 3, 107–124 10.3390/pharmaceutics3010107 [DOI] [PMC free article] [PubMed] [Google Scholar]
- Hurd T. R., DeGennaro M., Lehmann R. (2012). Redox regulation of cell migration and adhesion. Trends Cell Biol. 22, 107–115 10.1016/j.tcb.2011.11.002 [DOI] [PMC free article] [PubMed] [Google Scholar]
- Hurt E. M., Thomas S. B., Peng B., Farrar W. L. (2007). Integrated molecular profiling of SOD2 expression in multiple myeloma. Blood 109, 3953–3962 10.1182/blood--2006--07--035162 [DOI] [PMC free article] [PubMed] [Google Scholar]
- Ichiba M., Nakajima K., Yamanaka Y., Kiuchi N., Hirano T. (1998). Autoregulation of the Stat3 gene through cooperation with a cAMP-responsive element-binding protein. J. Biol. Chem. 273, 6132–6138 10.1074/jbc.273.11.6132 [DOI] [PubMed] [Google Scholar]
- Jordan R. C., Bradley G., Slingerland J. (1998). Reduced levels of the cell-cycle inhibitor p27Kip1 in epithelial dysplasia and carcinoma of the oral cavity. Am. J. Pathol. 152, 585–590 [PMC free article] [PubMed] [Google Scholar]
- Bagley C. M., Jr (1999). Call for stronger recommendations about supplement use during chemotherapy. Oncology (Williston Park) 13, 1628, 1631. [PubMed] [Google Scholar]
- Jung J. E., Kim G. S., Narasimhan P., Song Y. S., Chan P. H. (2009). Regulation of Mn-superoxide dismutase activity and neuroprotection by STAT3 in mice after cerebral ischemia. J. Neurosci. 29, 7003–7014 10.1523/JNEUROSCI.1110--09.2009 [DOI] [PMC free article] [PubMed] [Google Scholar]
- Khan A. A., Abel P. D., Chaudhary K. S., Gulzar Z., Stamp G. W. H., Lalani E-N. (2003). Inverse correlation between high level expression of cyclin E and proliferation index in transitional cell carcinoma of the bladder. Mol. Pathol. 56, 353–361 10.1136/mp.56.6.353 [DOI] [PMC free article] [PubMed] [Google Scholar]
- Kiyokawa H., Kineman R. D., Manova-Todorova K. O., Soares V. C., Hoffman E. S., Ono M., Khanam D., Hayday A. C., Frohman L. A., Koff A. (1996). Enhanced growth of mice lacking the cyclin-dependent kinase inhibitor function of p27(Kip1). Cell 85, 721–732 10.1016/S0092--8674(00)81238--6 [DOI] [PubMed] [Google Scholar]
- Lacoste-Collin L., Gomez-Brouchet A., Escourrou G., Delisle M-B., Levade T., Uro-Coste E. (2002). Expression of p27(Kip1) in bladder cancers: immunohistochemical study and prognostic value in a series of 95 cases. Cancer Lett. 186, 115–120 10.1016/S0304--3835(02)00319--1 [DOI] [PubMed] [Google Scholar]
- Larrea M. D., Hong F., Wander S. A., da Silva T. G., Helfman D., Lannigan D., Smith J. A., Slingerland J. M. (2009). RSK1 drives p27Kip1 phosphorylation at T198 to promote RhoA inhibition and increase cell motility. Proc. Natl. Acad. Sci. USA 106, 9268–9273 10.1073/pnas.0805057106 [DOI] [PMC free article] [PubMed] [Google Scholar]
- Lawenda B. D., Kelly K. M., Ladas E. J., Sagar S. M., Vickers A., Blumberg J. B. (2008). Should supplemental antioxidant administration be avoided during chemotherapy and radiation therapy? J. Natl. Cancer Inst. 100, 773–783 10.1093/jnci/djn148 [DOI] [PubMed] [Google Scholar]
- le Sage C., Nagel R., Egan D. A., Schrier M., Mesman E., Mangiola A., Anile C., Maira G., Mercatelli N., Ciafrè S. A. et al. (2007). Regulation of the p27(Kip1) tumor suppressor by miR-221 and miR-222 promotes cancer cell proliferation. EMBO J. 26, 3699–3708 10.1038/sj.emboj.7601790 [DOI] [PMC free article] [PubMed] [Google Scholar]
- Li J. J., Tang Q., Li Y., Hu B. R., Ming Z. Y., Fu Q., Qian J. Q., Xiang J. Z. (2006). Role of oxidative stress in the apoptosis of hepatocellular carcinoma induced by combination of arsenic trioxide and ascorbic acid. Acta Pharmacol. Sin. 27, 1078–1084 10.1111/j.1745--7254.2006.00345.x [DOI] [PubMed] [Google Scholar]
- Li L., El-Hayek Y. H., Liu B., Chen Y., Gomez E., Wu X., Ning K., Li L., Chang N., Zhang L. et al. (2008). Direct-current electrical field guides neuronal stem/progenitor cell migration. Stem Cells 26, 2193–2200 10.1634/stemcells.2007--1022 [DOI] [PubMed] [Google Scholar]
- Li F., Wang H., Huang C., Lin J., Zhu G., Hu R., Feng H. (2011). Hydrogen peroxide contributes to the manganese superoxide dismutase promotion of migration and invasion in glioma cells. Free Radic. Res. 45, 1154–1161 10.3109/10715762.2011.604321 [DOI] [PubMed] [Google Scholar]
- Li F., Wang H., Li L., Huang C., Lin J., Zhu G., Chen Z., Wu N., Feng H. (2012a). Superoxide plays critical roles in electrotaxis of fibrosarcoma cells via activation of ERK and reorganization of the cytoskeleton. Free Radic. Biol. Med. 52, 1888–1896 [DOI] [PubMed] [Google Scholar]
- Li H., Collado M., Villasante A., Matheu A., Lynch C. J., Cañamero M., Rizzoti K., Carneiro C., Martínez G., Vidal A. et al. (2012b). p27(Kip1) directly represses Sox2 during embryonic stem cell differentiation. Cell Stem Cell 11, 845–852 10.1016/j.stem.2012.09.014 [DOI] [PMC free article] [PubMed] [Google Scholar]
- Liu J., Zhang D., Mi X., Xia Q., Yu Y., Zuo Z., Guo W., Zhao X., Cao J., Yang Q. et al. (2010). p27 suppresses arsenite-induced Hsp27/Hsp70 expression through inhibiting JNK2/c-Jun- and HSF-1-dependent pathways. J. Biol. Chem. 285, 26058–26065 10.1074/jbc.M110.100271 [DOI] [PMC free article] [PubMed] [Google Scholar]
- Lonze B. E., Ginty D. D. (2002). Function and regulation of CREB family transcription factors in the nervous system. Neuron 35, 605–623 10.1016/S0896--6273(02)00828--0 [DOI] [PubMed] [Google Scholar]
- Malafa M., Margenthaler J., Webb B., Neitzel L., Christophersen M. (2000). MnSOD expression is increased in metastatic gastric cancer. J. Surg. Res. 88, 130–134 10.1006/jsre.1999.5773 [DOI] [PubMed] [Google Scholar]
- Menon S. G., Goswami P. C. (2007). A redox cycle within the cell cycle: ring in the old with the new. Oncogene 26, 1101–1109 10.1038/sj.onc.1209895 [DOI] [PubMed] [Google Scholar]
- Miriyala S., Spasojevic I., Tovmasyan A., Salvemini D., Vujaskovic Z., St. Clair D., Batinic-Haberle I. (2012). Manganese superoxide dismutase, MnSOD and its mimics. Biochim. Biophys. Acta 1822, 794–814 10.1016/j.bbadis.2011.12.002 [DOI] [PMC free article] [PubMed] [Google Scholar]
- Ng D. C. H., Lin B. H., Lim C. P., Huang G., Zhang T., Poli V., Cao X. (2006). Stat3 regulates microtubules by antagonizing the depolymerization activity of stathmin. J. Cell Biol. 172, 245–257 10.1083/jcb.200503021 [DOI] [PMC free article] [PubMed] [Google Scholar]
- Oberley L. W., Buettner G. R. (1979). Role of superoxide dismutase in cancer: a review. Cancer Res. 39, 1141–1149 [PubMed] [Google Scholar]
- Olmos Y., Valle I., Borniquel S., Tierrez A., Soria E., Lamas S., Monsalve M. (2009). Mutual dependence of Foxo3a and PGC-1α in the induction of oxidative stress genes. J. Biol. Chem. 284, 14476–14484 10.1074/jbc.M807397200 [DOI] [PMC free article] [PubMed] [Google Scholar]
- Pinthus J. H., Whelan K. F., Gallino D., Lu J. P., Rothschild N. (2011). Metabolic features of clear-cell renal cell carcinoma: mechanisms and clinical implications. Can Urol. Assoc. J. 5, 274–282 10.5489/cuaj.10196 [DOI] [PMC free article] [PubMed] [Google Scholar]
- Plymate S. R., Haugk K. H., Sprenger C. C., Nelson P. S., Tennant M. K., Zhang Y., Oberley L. W., Zhong W., Drivdahl R., Oberley T. D. (2003). Increased manganese superoxide dismutase (SOD-2) is part of the mechanism for prostate tumor suppression by Mac25/insulin-like growth factor binding-protein-related protein-1. Oncogene 22, 1024–1034 10.1038/sj.onc.1206210 [DOI] [PubMed] [Google Scholar]
- Polyak K., Kato J. Y., Solomon M. J., Sherr C. J., Massague J., Roberts J. M., Koff A. (1994). p27Kip1, a cyclin-Cdk inhibitor, links transforming growth factor-beta and contact inhibition to cell cycle arrest. Genes Dev. 8, 9–22 10.1101/gad.8.1.9 [DOI] [PubMed] [Google Scholar]
- Rodríguez A. M., Carrico P. M., Mazurkiewicz J. E., Meléndez J. A. (2000). Mitochondrial or cytosolic catalase reverses the MnSOD-dependent inhibition of proliferation by enhancing respiratory chain activity, net ATP production, and decreasing the steady state levels of H(2)O(2). Free Radic. Biol. Med. 29, 801–813 10.1016/S0891--5849(00)00362--2 [DOI] [PubMed] [Google Scholar]
- Roskoski R., Jr (2012). ERK1/2 MAP kinases: structure, function, and regulation. Pharmacol. Res. 66, 105–143 10.1016/j.phrs.2012.04.005 [DOI] [PubMed] [Google Scholar]
- Sablina A. A., Chumakov P. M., Kopnin B. P. (2003). Tumor suppressor p53 and its homologue p73α affect cell migration. J. Biol. Chem. 278, 27362–27371 10.1074/jbc.M300547200 [DOI] [PubMed] [Google Scholar]
- Sara P., Gabriella R., Daniela B., Francesco N., Valeria P. (2000). STAT1 and STAT3 in tumorigenesis: two sides of the same coin? Madame Curie Bioscience Database (internet) Austin, TX: Landes Bioscience [Google Scholar]
- Schrier B. P., Vriesema J. L. J., Witjes J. A., Kiemeney L. A. L. M., Schalken J. A. (2006). The predictive value of p53, p27(kip1), and α-catenin for progression in superficial bladder carcinoma. Eur. Urol. 50, 76–82 10.1016/j.eururo.2005.12.041 [DOI] [PubMed] [Google Scholar]
- See W. L., Heinberg A. R., Holland E. C., Resh M. D. (2010). p27 deficiency is associated with migration defects in PDGF-expressing gliomas in vivo. Cell Cycle 9, 1562–1567 10.4161/cc.9.8.11259 [DOI] [PubMed] [Google Scholar]
- Serres M. P., Zlotek-Zlotkiewicz E., Concha C., Gurian-West M., Daburon V., Roberts J. M., Besson A. (2011). Cytoplasmic p27 is oncogenic and cooperates with Ras both in vivo and in vitro. Oncogene 30, 2846–2858 10.1038/onc.2011.9 [DOI] [PubMed] [Google Scholar]
- Simone C. B., II, Simone N. L., Simone V., Simone C. B. (2007). Antioxidants and other nutrients do not interfere with chemotherapy or radiation therapy and can increase kill and increase survival, part 1. Altern. Ther. Health Med. 13, 22–28 [PubMed] [Google Scholar]
- Slingerland J., Pagano M. (2000). Regulation of the cdk inhibitor p27 and its deregulation in cancer. J. Cell. Physiol. 183, 10–17 10.1002/(SICI)1097-4652(200004)183:1<10::AID-JCP2>3.0.CO;2-I [DOI] [PubMed] [Google Scholar]
- Song L., Li J., Ye J., Yu G., Ding J., Zhang D., Ouyang W., Dong Z., Kim S. O., Huang C. (2007). p85alpha acts as a novel signal transducer for mediation of cellular apoptotic response to UV radiation. Mol. Cell. Biol. 27, 2713–2731 10.1128/MCB.00657--06 [DOI] [PMC free article] [PubMed] [Google Scholar]
- Sun Y., Nakamura K., Hegamyer G., Dong Z., Colburn N. (1993). No point mutation of Ha-ras or p53 genes expressed in preneoplastic-to-neoplastic progression as modeled in mouse JB6 cell variants. Mol. Carcinog. 8, 49–57 10.1002/mc.2940080111 [DOI] [PubMed] [Google Scholar]
- Thannickal V. J., Fanburg B. L. (2000). Reactive oxygen species in cell signaling. Am. J. Physiol. 279, L1005–L1028 [DOI] [PubMed] [Google Scholar]
- Thomas G. V., Szigeti K., Murphy M., Draetta G., Pagano M., Loda M. (1998). Down-regulation of p27 is associated with development of colorectal adenocarcinoma metastases. Am. J. Pathol. 153, 681–687 10.1016/S0002--9440(10)65610--6 [DOI] [PMC free article] [PubMed] [Google Scholar]
- Timmerbeul I., Garrett-Engele C. M., Kossatz U., Chen X., Firpo E., Grünwald V., Kamino K., Wilkens L., Lehmann U., Buer J. et al. (2006). Testing the importance of p27 degradation by the SCFskp2 pathway in murine models of lung and colon cancer. Proc. Natl. Acad. Sci. USA 103, 14009–14014 10.1073/pnas.0606316103 [DOI] [PMC free article] [PubMed] [Google Scholar]
- Wander S. A., Zhao D., Slingerland J. M. (2011). p27: a barometer of signaling deregulation and potential predictor of response to targeted therapies. Clin. Cancer Res. 17, 12–18 10.1158/1078--0432.CCR--10--0752 [DOI] [PMC free article] [PubMed] [Google Scholar]
- Wu F. Y., Wang S. E., Sanders M. E., Shin I., Rojo F., Baselga J., Arteaga C. L. (2006). Reduction of cytosolic p27(Kip1) inhibits cancer cell motility, survival, and tumorigenicity. Cancer Res. 66, 2162–2172 10.1158/0008--5472.CAN--05--3304 [DOI] [PubMed] [Google Scholar]
- Zhang J., Gao G., Chen L., Deng X., Li J., Yu Y., Zhang D., Li F., Zhang M., Zhao Q. et al. (2013). Cheliensisin A Inhibits EGF-induced Cell Transformation with Stabilization of p53 Protein via a Hydrogen Peroxide/Chk1-dependent Axis. Cancer Prev. Res. (Phila) 6, 949–958 [DOI] [PMC free article] [PubMed] [Google Scholar]
Associated Data
This section collects any data citations, data availability statements, or supplementary materials included in this article.