

Abstract
A challenge for biomedical research is the development of pharmaceuticals that appropriately target disease mechanisms. Natural products can be a rich source of bioactive chemicals for medicinal applications but can act through unknown mechanisms and can be difficult to produce or obtain. To address these challenges, we developed a new marine-derived, renewable natural products resource and a method for linking bioactive derivatives of this library to the proteins and biological processes that they target in cells. We used cell-based screening and computational analysis to match gene expression signatures produced by natural products to those produced by siRNA and synthetic microRNA libraries. With this strategy, we matched proteins and microRNAs with diverse biological processes and also identified putative protein targets and mechanisms of action for several previously undescribed marine-derived natural products. We confirmed mechanistic relationships for selected short-interfering RNAs, microRNAs, and compounds with functional roles in autophagy, chemotaxis mediated by discoidin domain receptor 2, or activation of the kinase AKT. Thus, this approach may be an effective method for screening new drugs while simultaneously identifying their targets.
Introduction
The diverse chemistry found in nature provides a valuable resource for medicinal drugs and has been the source of many antibiotics and cancer chemotherapeutics over the past six decades (1). The chemical structures of natural products have evolved for interaction with biological systems resulting in sub-μM potency for many compounds. A proven drug-screening paradigm for natural product collections is the use of cell-based phenotypic screens for the selection of molecules with reasonable physiochemical properties (2, 3). However, critical barriers to rapid development of drug-like molecules include the challenges of structural determination, purification or synthesis, and elucidation of molecular targets and mechanisms of action. To address these issues, we combined a renewable natural product library with a method of screening and functional annotation that together enables rapid identification, characterization, and production of drugs with known mechanisms of action. We generated a library of metabolites from laboratory-cultured, marine-derived bacterial species and marine invertebrates. The bacterial collection was isolated from sea floor sediments, and the organisms were cultivated using specialized strategies such as quorum-sensing molecules and habitat-specific media, yielding a large phylogenetic diversity of microorganisms.
The resulting natural product fractions are typically mixtures of 2-6 compounds. To classify the biological activities associated with the natural products in this collection, we used a high-throughput, gene expression platform (4-9) that enables quantitative discrimination of concordant cellular responses to genetic (miRNA- and siRNA-induced) and chemical perturbations in human cultured cells. The genetic perturbations included a combination of oligonucleotides that mimic microRNA (miRNAs) and a collection of siRNA pools targeting the kinome, including most known kinases, phosphatases, and kinase signaling accessory proteins. We chose these collections as a practical means of interrogating a broad landscape of genetic relationships with a minimal number of tests. For example, endogenous miRNAs presumably represent a limited sequence space that evolved to regulate distinct cellular processes through the combinatorial inhibition of translation of groups of transcribed genes (10). In addition, the entire protein-coding genome has undergone selective pressure to avoid detrimental targeting by miRNAs (11). Likewise, the kinome is heavily enriched for proteins that participate in the molecular signaling networks that specify dynamic cell regulatory events (12), inhibition of which can also modulate many cellular processes.
We assembled signatures of the expression of a specific set of genes that resulted from screening of siRNA, miRNA mimic, or natural product libraries into a similarity matrix to identify biologically related genetic and chemical perturbations. Using this approach, we produced functional signature-based ontology (FUSION) maps that linked bioactive molecules to the proteins and biological processes that they engage in cells. Experimental evaluation of hypotheses generated by FUSION mapping confirmed biological roles for previously uncharacterized miRNAs, kinases, and natural product compounds. To facilitate the use of this resource beyond the specific mechanistic relationships reported here, we developed an open access search engine that allows users to query for chemical and genetic “functionalogs” of a gene of interest and provides statistical evaluations of the strength of each match, (http://whitelab.swmed.edu/fmap/fusion1.php).
Results
Creating functional signature-based ontology (FUSION) maps from gene expression signatures
To build a molecular functional ontology for annotation of the activity of molecules, such as natural products or small molecules, or the effect of genetically targeted perturbations, such as siRNAs or miRNA mimics, in cell-based phenotypic screens, we measured the expression of a specific set of genes representing a signature that could serve as a proxy for the physiological state of the cell (4-9). To select a small set of high-performance endogenous mRNAs that could serve as reporters of diverse cell biological states, we queried a collection of publicly available whole genome expression arrays (∼3700 arrays) for gene products displaying high variation and low covariation across multiple genetic or pharmacological perturbations in human cells (13). Six genes (ACSL5, BNIP3L, ALDOC, LOXL2, BNIP3, and NDRG1) fit these criteria and also displayed concordant responses to genetic or chemical perturbation of the mitogen-activated protein kinase (MAPK) pathway in HCT116 cells. In addition, two genes (PPIB, HPRT) that showed limited variation in expression were used as internal normalization controls [(http://www.bcgsc.ca/project/bomge/coexpression/ (13) (fig. S1A)]. We made high-throughput measurements of this “endogenous reporter gene set” using multi-analyte capture beads and branched-DNA signal amplification to enable direct simultaneous quantitation of multiple mRNAs in each well of a 384-well plate. We used this approach to screen a collection of 780 siRNAs targeting human kinases and related proteins and 344 nonredundant miRNAs mimics. Normalized reporter gene expression was measured 72 hours after transfection of miRNAs or siRNAs in HCT116 colorectal adenocarcinoma cells (fig. S1B, table S1). Assembly of the endogenous reporter gene signatures resulting from each perturbation into a similarity matrix, using Euclidean distance distributions, linked biologically similar genetic perturbations. For intuitive data visualization, we used two phylogenetic tree construction algorithms. These included complete-linkage clustering, which is commonly employed for unsupervised hierarchical clustering of transcript array data, and neighbor joining (NJ), which finds the near-optimum tree topology with minimal branch length (14, 15). In addition, we estimated all the pair-wise distances between genetic perturbations and evaluated the statistical significance per pair by permutation (see Materials and Methods). This analysis produced functional signature-based ontology (FUSION) maps (Fig. 1A), linking bioactive compounds to molecular entities, biological process, or both (table S1 and http://whitelab.swmed.edu/fmap/fusion1.php).
Fig. 1. Functional signature-based ontology.
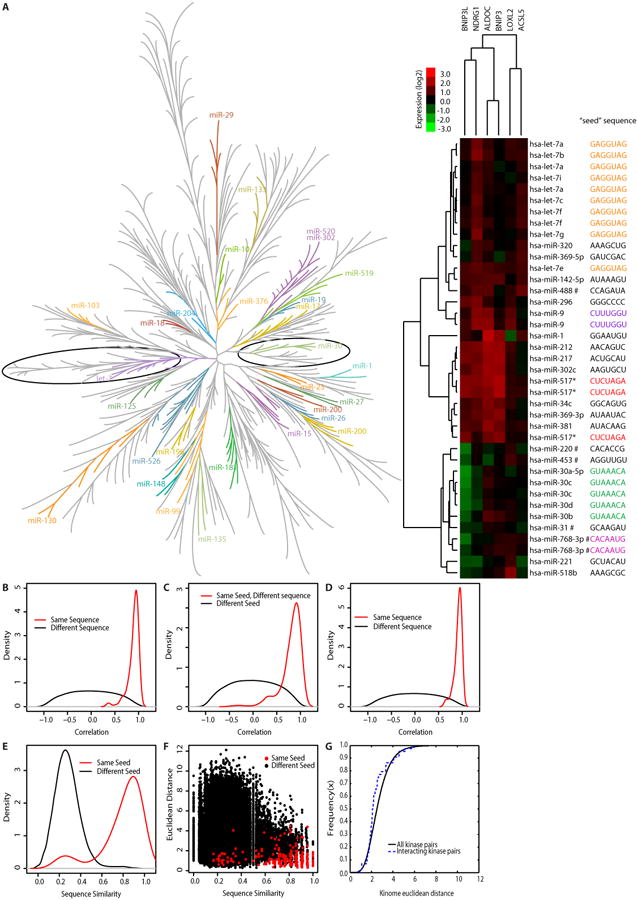
(A) Left: The neighbor-joining tree of the Euclidean distance among reporter gene signatures for all miRNA mimics. Co-clustering of seed-based miRNA families is indicated and color-coded. The let-7 and miR-30 branches are circled. (See table S1 for details.) Right: Unsupervised hierarchical clustering of expression data from miRNAs in these two branches. Identical seed sequences are indicated by color-coding. # indicates that the seed sequence shown and present in the miRNA library differs the annotated seed sequence in miRbase. (B) Density distributions (standard probability density plot) for redundant miRNA mimics (Same sequence, n = 105 pairs) and for nonredundant miRNA mimics (Different sequence, n = 90,420 pairs). (C) Density distributions for the non-redundant miRNA mimics that share an identical seed sequence (Same seed, Different sequence), n = 330 pairs) and for miRNA mimics with different seeds (Different seed, n = 90,090 pairs). (D) Density distributions of reporter gene signatures for miRNA mimic pairs with the same sequence or different sequence and that did not reduce the viability of HCT116 cells below 20% of the median (n = 405 miRNA mimics). (E) Overall sequence similarity was calculated between every miRNA mimic pair: non-redundant miRNA mimics sharing identical seed sequences, n = 330 pairs (red) and miRNA mimics with non-identical seeds, n = 90,090 pairs (black). (F) Euclidean distance between reporter gene signatures of each miRNA pair in the indicated categories is shown. To determine whether miRNA mimic pairs with identical seeds but dissimilar sequences outside the seed region produce expression signatures that are more highly correlated than those produced by miRNA pairs with similar overall sequence similarity but non-identical seeds, statistical analysis was performed on the subset of miRNA mimic pairs with sequence similarity <0.5. In (C-F), p < 2.2 × 10⁻¹⁶, Wilcoxon rank-sum test. (G) Cumulative distribution of Euclidean distances between all possible pairs of siRNAs targeting kinases (solid line) as compared to siRNA pairs targeting kinases known to physically interact (dotted line) (48). p = 0.0057, K-S statistic.
Validating the FUSION approach on the basis of known relationships among proteins targeted by miRNA mimics or siRNAs
To evaluate the performance of the reporter gene set, we tested the prediction that, when expressed as miRNA mimics, microRNA families that share the same seed region should produce gene reporter signatures more similar than those produced by random pairs of miRNAs. The seed sequence of a miRNA, which anneals to complimentary sequences on target mRNAs, is a major determinant of miRNA-mediated suppression of gene expression (11). The miRNA mimic library that we used corresponds to endogenous human miRNAs from miRBase version 8.0 (16). This miRNA mimic library has an internal redundancy of 20% because multiple genetic loci produce the same mature miRNA. Thus, the library contains 426 miRNA mimics comprised of 344 nonredundant sequences. Reporter gene expression was largely uncoupled from endogenous miRNA abundance (fig. S1C, D and tables S1, S2). Moreover, as a set, the expression of the selected reporter genes responded to transfection of the majority of the miRNA mimics; 73.5% of the miRNAs mimics elicited a two-fold or greater change in expression of one or more reporter genes (fig. S2, table S1 “genetic_all” tab). From the similarity matrix computed for the miRNA library, we found concordance of reporter gene signatures among miRNA seed families (Fig. 1A; fig. S2). Among miRNA mimics with matching seed sequences (nucleotides 2-7), reporter gene signatures correlated to an almost equivalent degree as observed for miRNA mimics that were completely identical (Fig. 1B, C, D). Furthermore, the concordance of reporter gene signatures among miRNA mimics with identical seed sequences was not influenced by remaining non-seed sequence (Fig. 1E, F). Thus, the correlation between the seed-sequence and the gene signatures suggests that equivalence of miRNA targets drives the miRNA mimic clustering, which by extrapolation, suggests the chosen reporter gene set appropriately reports the effects of these reagents across diverse biological activities.
To evaluate the performance of the reporter gene set in cells expressing the kinome siRNA library, we tested the prediction that pairs of kinases in the kinome that physically interact (15) should have more similar reporter gene signatures than random pairs of kinases targeted by the siRNA library. From the FUSION map of the siRNAs clustered by reporter gene signature similarity (fig. S3, table S1), we plotted a cumulative distribution of reporter gene signature similarity scores for the kinome siRNA dataset (Fig. 1G). This analysis indicated a significant enrichment of similar reporter gene signatures among siRNAs targeting kinases that physically interact, further indicating that FUSION mapping can successfully parse siRNA-mediated perturbations across diverse biological responses.
We also computed a combined miRNA mimic and siRNA FUSION matrix (fig. S4A, table S1 “genetic_all” tab) to evaluate performance of the reporter gene set across different classes of genetic perturbations. To minimize the contribution of off-target effects of the siRNAs due to sequence overlap between siRNAs and the seed region of miRNAs, we screened pools of four individual siRNAs per target gene (17-20). Of the 311 possible pairwise comparisons between a specific miRNA mimic and a corresponding siRNA pool in which the miRNA's seed sequence was also present in an siRNA oligo within the pool, we detected 94 siRNA-miRNA gene expression correlations (with Pearson correlation > 0.5) that were potentially caused by the siRNA recognizing the same sequence as that of the miRNA mimic seed sequence (table S3). That is, a subset of the siRNAs with sequences that included miRNA seed sequences showed a slightly larger average correlation than those with different seed sequences regions (fig. S4B), supporting the notion that off-target effects of siRNA oligos made a minor but identifiable contribution to the FUSION matrix.
Predicting cellular functions of understudied kinases and linking miRNAs to signaling pathways with FUSION mapping
To test whether FUSION mapping could be used to predict functional relationships among genetic perturbations, we focused on two sets of miRNA mimics and siRNAs that clustered together in the miRNA-siRNA similarity matrix (fig. S4A) and that, based on some of the targeted proteins, would be predicted to have opposing effects on autophagy (Fig. 2A, B). One cluster included Unc-51-like autophagy activating kinase 1 (ULK1), which is required for autophagosome formation and maturation (21); whereas the other cluster included mechanistic target of rapamycin (mTOR), which functions in the mTOR complex 1 to inactivate ULK1 and suppress autophagy (22). Reporter gene signatures produced by siRNA knockdown of ULK1 or mTOR produced distinct functional signatures that correlated with those produced by miRNA mimics and siRNAs within the same cluster (present in the same clade) at a false discovery rate (FDR)< 20% (Fig. 2A, B). These clusters contained several known modulators of autophagy and their first order protein interaction partners (23) (Fig. 2C).
Fig. 2. Mechanism of action annotation of kinases and miRNAs by FUSION.
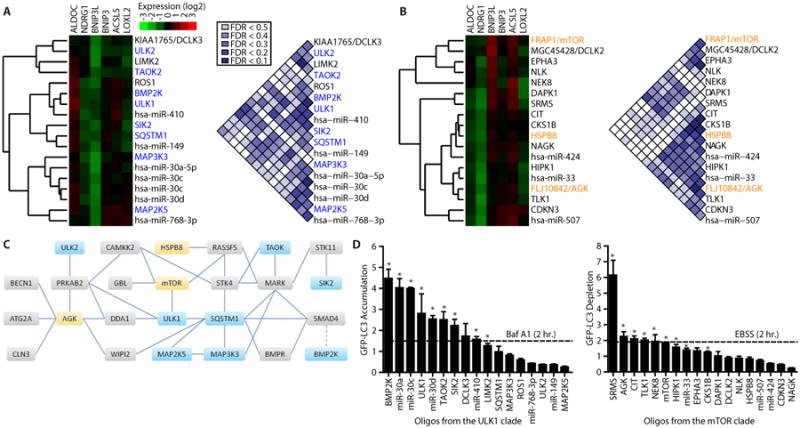
(A, B) The reporter gene signatures produced in HC116 cells by introduction of the siRNA or miRNA libraries were clustered with the complete-linkage method and the individual clades containing siRNAs targeting ULK1 (A) or mTOR (B) are presented as gene expression heat maps. FDRs are depicted for pairwise comparisons within each group. (C) A map of the autophagy regulatory network (23), including physical interactions (solid lines) and regulatory relationships (dotted line) among kinases in the ULK1 (blue) and mTOR groups (yellow) and between these kinases and other proteins (gray). (D) Quantification of GFP-LC3 by flow cytometry following siRNA pool or miRNA mimic introduction into U2OS cells. Median GFP fluorescence values were normalized to negative control oligonucleotides (LONRF1 for siRNAs or MC1 for miRNA mimics). n ≥ 3; mean + SEM. * indicates p < 0.05, one-tailed t-test. Baf A1, bafilomycin A; EBSS, Earle's Balanced Salt Solution nutrient deprivation media.
To determine if clade membership revealed undiscovered regulators of autophagy, we tested each siRNA or miRNA mimic in each clade for an effect on autophagy. We used flow cytometry to monitor the fluorescence intensity of LC3 (microtubule-associated protein 1 light chain 3 alpha) fused to green fluorescent protein (GFP-LC3) expressed in U2OS cells as a marker of autophagic flux (fig. S4C). Lipidated LC3 coats the inner and outer membranes of nascent autophagosomes and is proteolytically degraded in mature autophagosomes (24); thus accumulation of LC3 indicates a reduction in autophagic flux and depletion of LC3 indicates an increase in autophagic flux. Pharmacological inhibition of autophagosome acidification with bafilomycin A1 or siRNA knockdown of ULK1 increased GFP-LC3 fluorescence intensity, whereas activation of autophagic flux by nutrient deprivation or siRNA knockdown of mTOR decreased GFP-LC3 fluorescence intensity (Fig. 2D, fig. S4D-F). We found that 9 of 17 siRNAs and miRNA mimics from the ULK1 cluster significantly blocked autophagic flux, triggering an increase in GFP-LC3 intensity, and 9 of 18 siRNAs and miRNA mimics from the mTOR cluster enhanced autophagy, triggering a decrease in GFP-LC3 fluorescence intensity similar to or exceeding that of incubation with nutrient deprivation medium (Fig. 2D, fig. S5A).
In particular, knockdown of BMP2K (BMP2 inducible kinase), ULK1, TAOK2 (Tao kinase 2), or SIK2 (salt-inducible kinase 2) induced GFP-LC3 accumulation to an extent equal to or greater than treatment with bafilomycin A1, as did introduction of the miRNA mimics from the miR-30 family or miR-410. Conversely, knockdown of SRMS (src-related kinase lacking C-terminal regulatory tyrosine and N-terminal myristoylation sites), AGK (acylglycerol kinase), CIT (citron), TLK1 (tousled-like kinase 1), NEK8 (NIMA-related kinase 8), or mTOR depleted GFP-LC3 to an extent equal to or greater than nutrient deprivation.
We selected BMP2K for further investigation, because siRNA knockdown of BMP2K produced the strongest inhibition of autophagy based on flow cytometric analysis of GFP-LC3 abundance (Fig. 2D). Multiple independent siRNAs targeting BMP2K increased GFP-LC3 fluorescence intensity, consistent with inhibition of autophagy (fig. S5B). Moreover, siRNA knockdown of BMP2K reduced the average number of LC3-positive punctae per cell (Fig. 3A); whereas overexpression of BMP2K increased the number of LC3-positive punctae per cell (Fig. 3A).
Fig. 3. Validation of previously unknown modulators of autophagy.
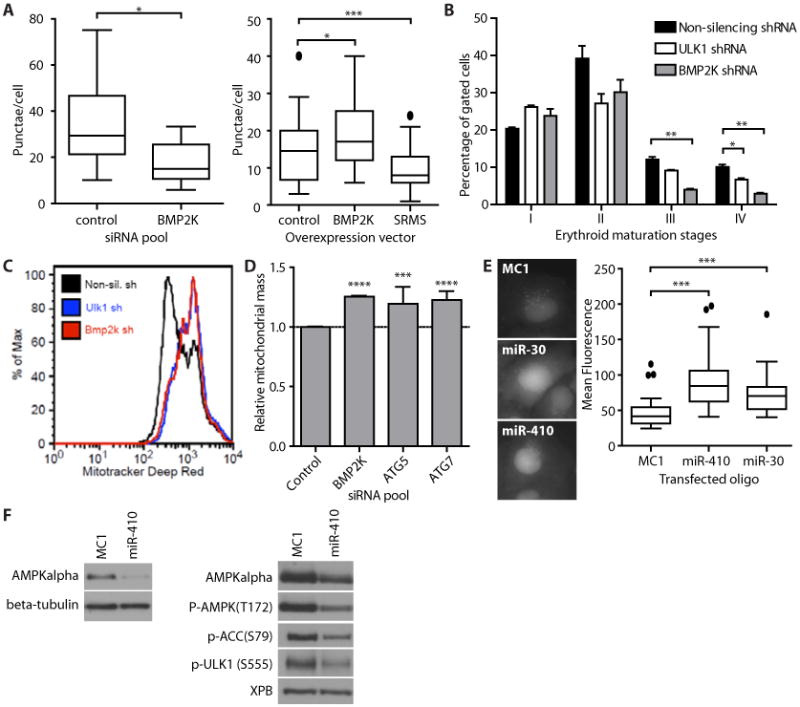
(A) Quantification of GFP-LC3 punctae in U2OS cells in which BMP2K was knocked down (left) or in which myc-tagged BMP2K, myc-SRMS, or the myc tag alone was overexpressed (right). n = 9-10 images (50-144 cells) per condition. Boxes represent median and quartiles, whiskers extend to 1.5 × the interquartile distance, and outliers are indicated by circles (left) or removed (right). GFP-LC3-positive punctae were counted in the transfected cells as identified by positive staining with an antibody that recognizes myc. LONRF1 served as the control siRNA and myc tag alone served as the overexpression control. *p < 0.05. unpaired t-test. Data are representative of three (left) and two (right) experiments. (B) Mouse erythroid progenitors with shRNAs targeting ULK1, BMP2K, or non-silencing control. Stages of differentiation were identified by flow cytometry for CD71 and Ter119: proerythroblast (I), basophilic erythroblast (II), late basophilic and chromatophilic erythroblasts (III), and orthochromatic erythroblasts (IV). Mean + SEM. n = 3 experiments. See fig. S5D for representative FACS plots. (C) Histograms of the fluorescence intensity of MitoTracker Deep Red FM used to reveal mitochondrial content of erythroid progenitor cells infected with the indicated shRNAs. Data are representative of three experiments (D) Quantification of flow cytometry of stable mito-mCherry in U2OS cells transfected with the indicated siRNAs. Mean + SEM, n = 3 experiments. ***p < 0.001.****p < 0.0001, unpaired t-test. (E) Representative images of GFP-LC3 in U2OS cells transfected with the indicated miRNA mimics (left). Image-based quantification GFP-LC3 in U2OS cells transfected with miRNAs (right). n = 36-46 cells per condition. Boxes represents median and quartiles, whiskers extend to 1.5 × the interquartile distance, and outliers are indicated by circles. ***p < 0.0001. unpaired t-test. (F) Western blot of HCT116 cells (left) or U2OS GFP-LC3 cells (right) transfected with miR-410 or negative control (MC1). Data are representative of five experiments.
Erythrocyte maturation is a cellular differentiation process that depends on mitochondrial autophagy (26). Tissue-specific gene expression profiling indicates a 3- to 10-fold enrichment of BMP2K expression in human CD71+ early erythroid cells compared with other human tissues and cells (27). We found that knockdown of BMP2K or ULK1 in mouse erythroid progenitors through retrovirally-delivered shRNA impaired ex vivo differentiation and blocked mitochondrial autophagy (Fig. 3B, C; fig. S5C, D). Measuring the abundance of mitochondria using a mitochondrially-targeted fluorescent protein (28) showed that knockdown of BMP2K in U2OS cells increased mitochondrial mass (fluorescence intensity) (Fig. 3D). Thus, FUSION analysis identified BMP2K as required for basal autophagy in U2OS cells and differentiation-induced mitochondrial autophagy during erythrocyte development.
We identified two miRNA mimics that inhibited autophagic flux—the miR-30 family and miR-410. The miRNA mimic corresponding to miR-30a, which targets the mRNA encoding Beclin-1 and thereby inhibits autophagy, including that induced by chemotherapy (29, 30), enhanced GFP-LC3 fluorescence intensity in U2OS cells (Fig. 2D, Fig. 3E). An miRNA mimic corresponding to miR-410, which is predicted to target AMP-activated protein kinase alpha 1 and 2 (AMPKα) (www.targetscan.org/), also promoted GFP-LC3 accumulation to a similar extent as bafilomycin A1 treatment (Fig. 2D, Fig. 3E, fig. S5A). Introduction of the miR-410 mimic into HCT116 or U2OS cells reduced the abundance of AMPKα and inhibited phosphorylation of AMPKα downstream targets, including ULK1 (Fig. 3F). AMPKα directly activates ULK1 to induce autophagosome formation in response to nutrient deprivation (22). Thus, our results suggest the mechanism by which miR-410 inhibits autophagy.
To a greater extent than did siRNA knockdown of mTOR, nutrient deprivation, or any other treatment tested, siRNA knockdown of SRMS (31) increased autophagic flux, as indicated by decreased the abundance of GFP-LC3 and p62 (Fig. 2D, fig. S5A, fig. S6A-E). Knockdown of SRMS significantly increased the number of LC3-positive punctae per cell and decreased the abundance of GFP-LC3 and p62 in a ULK1 and autophagy-related 5 (ATG5)-dependent manner (Fig. 4A, B, C), whereas overexpression of SRMS decreased the number of LC3-postive punctae per cell (Fig. 3A). This suggests that SRMS inhibits autophagy upstream of autophagosome formation. SRMS-depleted cells maintained a robust response to nutrient deprivation despite increased basal autophagy, suggesting that loss of SRMS does not mimic nutrient deprivation (Fig. 4D). SRMS is unlikely to function through mTOR because knockdown of SRMS did not inhibit mTOR pathway activity as measured by the phosphorylation of the kinase p70S6K (Fig. 4C, fig. S6E). These observations indicate a role for SRMS in nutrient-independent inhibition of autophagy.
Fig. 4. SRMS restrains autophagy.
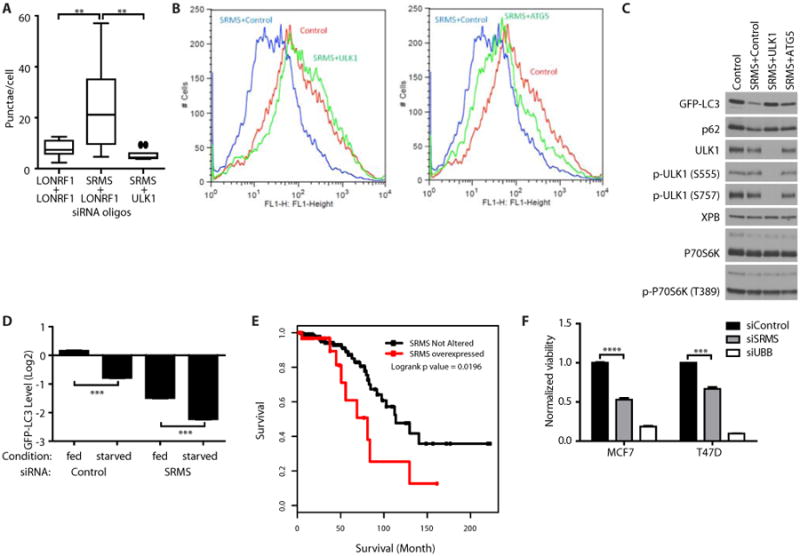
(A) Quantification of GFP-LC3 punctae in U2OS cells transfected with siRNAs targeting the indicated proteins. LONRF1 served as the control siRNA. n = 10 images or >750 cells per condition. Boxes represent median and quartiles. Whiskers extend to 1.5 × interquartile distance. Outliers indicated by circles. **p < 0.01, unpaired t-test. Data are representative of five experiments. (B) GFP-LC3 fluorescence intensity in U2OS cells transfected with the indicated siRNAs. Data are representative of five experiments. (C) Western blot of U2OS cells transfected with the indicated siRNAs. Data are representative of three experiments. (D) Quantification of flow cytometry of GFP-LC3 in U2OS cells transfected with siRNA pools and then incubated in normal growth medium (fed) or EBSS nutrient deprivation medium (starved) for 2 hours. Mean + SEM, n = 3 experiments. ***p < 0.001. unpaired t-test. (E) Fraction of patients surviving from the Luminal (A/B) case set of the Breast Invasive Carcinoma TCGA Study stratified by SRMS mRNA abundance. SRMS overexpression (red) was defined as “reads per kilobase per million reads” z-score > 2.0. p < 0.02, logrank test. (F) Normalized cell viability in MCF7 and T47D luminal breast cancer cell lines measured with CellTiterGlo 96 hours after transfection with siRNAs against LONRF1 (negative control), SRMS, or UBB (positive control) in triplicate. Mean + SEM. n = 3 biological replicates. ***p < 0.001. ****p < 0.0001. unpaired t-test.
Autophagy has tumor-suppressive activity in luminal breast epithelial cells (32). SRMS expression is increased in 11% of luminal breast tumors, with amplification of the SRMS locus observed in approximately one-third of cases (www.cbioportal.org/) (33, 34). Within this disease setting of estrogen receptor-positive breast cancer, which is typically associated with a good prognosis, tumors with increased expression of SRMS correlated with poor prognosis (Fig. 4E). Knockdown of SRMS inhibited the growth of the luminal breast cancer cell lines MCF7 and T47D (Fig. 4F). These data indicate that SRMS may regulate autophagy in breast cancer and could be a therapeutic target in this disease.
FUSION matches natural products to biological mechanisms of action
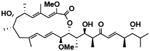
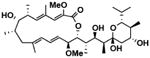
We generated a renewable resource of natural products by harvesting Actinomycetes (65), Firmicutes (20) and alpha-proteobacteria (7) from previously under-sampled marine environments. The organisms were cultivated in the laboratory under defined conditions designed to enhance the success of clonal populations and reproducibility of fermentation conditions. Large-scale fermentation of each bacterial strain followed by metabolite extraction and chromatic separation produced 20 natural product fractions per strain totaling 1186 fractions with an estimated two to six compounds per fraction (see Supplementary materials and methods). We screened these natural product fractions for the ability to modulate reporter gene expression and computed pairwise distances between all natural products, siRNAs, and miRNAs to create a FUSION map. Given our observations that several genetic perturbations modulated autophagy, we used FUSION mapping to predict which natural product fractions could also modulate autophagy. Metabolites isolated from the Streptomyces bacillaris strain SN-B-019 induced reporter gene signatures that positively correlated with knockdown of ULK1 (fig. S7A). Of the five pure compounds isolated from the SN-B-019 fraction, four (Table 1) inhibited autophagy as measured by accumulation of LC3-positive punctae (fig. S7B). Of these, SN-B-019-cmp1 also induced accumulation of GFP-LC3 and p62 and phosphorylation of AMPKα (Thr172) in a dose-dependent manner (EC50 = 150 nM, Fig. 5A, B). Structural determination revealed this compound to be identical to bafilomycin D (Fig. 5B, Table 1), which blocks autophagosome maturation through direct inhibition of the vacuolar ATPase (35, 36). These data show that FUSION mapping can successfully predict matching chemical and genetic perturbations.
Table 1. Structures of the purified natural products characterized in this study.
| Source (UTSW designation) | Compound designation | Compound name | Structure |
|---|---|---|---|
| Streptomyces bacillaris (SNB-019) | SNB-019-cmp1 | bafilomycin D |
|
| Streptomyces bacillaris (SNB-019) | SNB-019-cmp2 | bafilomycin A1 |
|
| Streptomyces bacillaris (SNB-019) | SNB-019-cmp3 | bafilomycin B1 |
|
| Streptomyces bacillaris (SNB-019) | SNB-019-cmp4 | bafilomycin B2 |
|
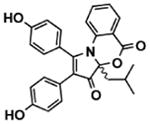
| Bacillus hunanensis (SNA-048) | SNA-048-7-2 | discoipyrroleA |
|
| Salinispora arenicola (SNB-003) | SNB-003-cmpl | 5SNB-003-11-3-2 | structure not shown |
Fig. 5. Mode-of-action annotation of marine-derived natural products by FUSION mapping.
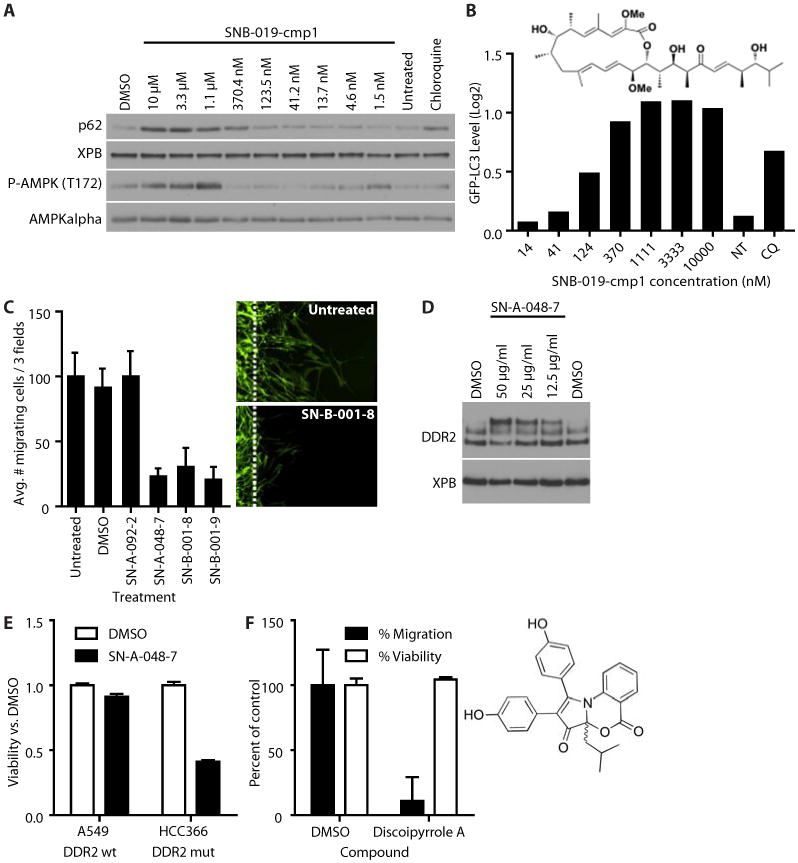
(A) Effect of SNB-019-cmp1 on autophagy and AMPK phosphorylation as measured by Western blot (A) or flow cytometry (B) of U2OS GFP-LC3 cells treated with the indicated concentrations of SNB-019-cmp1, chloroquine (50 μM), DMSO (0.1%), or untreated for two hours. Data are representative of five experiments. (B) Effect of SNB-019-cmp1 on autophagy as measured by the abundance of GFP-LC3 measured by flow cytometry in U2OS cells exposed to the indicated concentrations of SNB-019-cmp1, chloroquine (50 μM), or untreated (NT). Mean + SEM of 20,000 biological replicates. The structure of SNB-091-cmp1 is that of bafilomycin D (C) The effect of the indicated compounds (60 μg/ml) on human BR5 fibroblast migration out of a three-dimensional collagen plug induced by PDGF (50 ng/ml). Mean + SEM, n = 3 biological replicates. Right panels are representative images. Dotted lines indicate the boundary of the collagen plug. Cells were stained for filamentous actin. (D) Western blot for DDR2 in BR5 cells exposed to the indicated concentrations off SN-A-048-7. Data are representative of three experiments. (E) Normalized cell viability of A549 and DDR2-mutant HCC366 cells. Viability was measured using Cell TiterGlo. Data are mean + SEM of triplicate wells. These results are representative of five experiments. (F) The effect of discoipyrrole A (135 μM) or DMSO (0.1%) on the migration or viability of BR5 cells. Results were normalized to DMSO-treated cells. Mean + SEM. n = 3 experiments. The structure of SN-A-048-7 is that of discoipyrrole A.
Next, we asked if FUSION mapping could be used to identify natural products that perturb cellular processes other than autophagy. The discoidin domain receptor tyrosine kinase 2 (DDR2) is encoded by a protooncogene in lung cancer, and activating mutations occur in ∼4% of human squamous cell lung cancer (37). Moreover, in non-transformed mesenchymal cells, DDR2 supports growth factor-induced migration through collagen matrices (38). By FUSION mapping, we identified three natural product fractions with reporter gene signatures that were similar to those produced by knockdown of DDR2 with siRNA (FDR < 16%, fig. S7C) and that inhibited placental-derived growth factor (PDGF)-induced migration of primary human fibroblasts through collagen disks (Fig. 5C). One fraction, SN-A-048-7, dose-dependently increased the apparent molecular weight of DDR2 suggesting that compounds in this fraction may bind DDR2 or alter its posttranslational modifications (Fig. 5D). Knockdown of DDR2 is selectively toxic to lung cancer cell lines with activating mutations in DDR2 (37). Compared to the effect of SN-A-048-7 on the viability of A549 cells with wild-type DDR2, SN-A-048-7 reduced the viability of the DDR2 mutant cell line HCC366 (Fig. 5E, fig. S7D).
Subfractionation of SN-A-048-7 yielded the pure compound (Table 1), discoipyrrole A, which inhibited PDGF-induced migration of fibroblasts in a dose-dependent manner (Fig. 5F, fig. S7E). A combination of nuclear magnetic resonance, mass spectroscopy, and x-ray crystallization analyses of discoipyrrole A revealed a previously unreported structure composed of a core dihydro-2H-pyrrolooxazine-2,8(8aH)-dione ring system substituted at multiple positions with phenyl rings (Fig. 5F). Thus, functional validation of discoipyrrole A derived from natural products supports the conclusion that FUSION mapping is an effective means to identify biologically active, clinically relevant compounds.
In contrast to DDR2, aberrant activation of the AKT survival pathway is widespread throughout cancers of various tissues. Several drugs targeting AKT or other enzymes in the AKT pathway are currently in late stage clinical trials as chemotherapies for multiple cancers (39). The protein kinases TANK-binding kinase 1 (TBK1) and 3-phosphoinositide-dependent protein kinase-1 (PDPK1, also called PDK1) directly and coordinately activate AKT and its family members by phosphorylation in many cells, including HCT116 cells (40). Therefore, we used FUSION mapping to identify 12 natural product fractions that produced reporter gene signatures similar to those produced by knockdown of TBK1 and those produced by knockdown of PDPK1 (fig. S8A), predicting that these would also reduce AKT pathway activity. Of these 12 fractions, seven inhibited AKT signaling as assessed by Western blot for Thr389-phosphorylated 70-kD ribosomal protein S6 kinase polypeptide 1 (P70S6K) a target of the AKT pathway (fig. S8A). Sequential bioassay-guided subfractionation of SN-B-003-5 (fig. S8B) revealed the pure compound, SNB-003-cmp1 (Table 1), which inhibited P70S6K-mediated phosphorylation of its target ribosomal S6 protein (S6) at low nanomolar concentrations (Fig. 6A). In vitro assays with purified TBK1 or PDK1 revealed direct inhibition of kinase activity with an IC50 of ∼300 pM for TBK1 (Fig. 6B). To determine specificity, SN-B-003-cmp1 was tested against a panel of 235 human kinases at 1× and 10× the IC50 for TBK1. At 300 pM, we observed 50% or more inhibition of TBK1 and calcium/calmodulin-dependent protein kinase II gamma (CAMKIIγ), whereas at 3 nM we also found inhibition of PDPK1; AMPKα; glucokinase; MAP/microtubule affinity-regulating kinase 2; 90-kD ribosomal protein S6 kinase polypeptide 1, 2, 3 and 6; and testis-specific serine kinase 1 (Fig. 6B, C, table S4). These results suggest that SN-B-003-cmp1 is a multikinase inhibitor with moderate specificity for TBK1 and CAMKIIγ and further support the conclusion that FUSION mapping can be used to identify biologically active molecules from natural product libraries.
Fig. 6. Identification of SNB-003-cmp1 as a multikinase inhibitor.

(A) Western blot of HCC44 cells treated 2.5 h with the indicated concentrations of SNB-003-cmp1. Data are representative of five experiments. (B) Dose-response curves for SNB-003-cmp1 on recombinant PDK1 (IC50 = 2 nM) and TBK1 (IC50 = 0.3 nM). Mean +/- range for n = 2 experiments. (C) The effects of 3 nM SNB-003-cmp1 on the activity of 235 kinases tested in vitro. Red circles >75% inhibition; orange >50% inhibition; yellow >25% inhibition; green <25% inhibition. See table S4 for additional detail.
Discussion
Assigning mechanism of action to bioactive molecules is a rate-limiting step in biomedical research and pharmaceutical development. We constructed a similarity matrix of reporter gene signatures among miRNAs, siRNAs, and natural products using a simple distance metric. The resulting “guilt by association” relationships were used to generate hypotheses about the cellular pathways and processes that these molecules can perturb. Experimental testing of these hypotheses confirmed the identification of underappreciated roles of several proteins and microRNAs in cell biological processes that are important for normal physiology and disease. Moreover, we were able to assign modes of action and suggest potential therapeutic uses for novel marine-derived natural products. To leverage this resource beyond the chemical-genetic relationships described in this study, we have provided an open-source web-based tool to access our FUSION map for users to identify natural product fractions with statistically similar reporter gene signatures to microRNAs and genes of interest, (http://whitelab.swmed.edu/fmap/fusion1.php). Moreover, the FUSION map is amenable to expansion with data from screening of additional genetic and chemical perturbations. Therefore, this resource has the potential to enhance the pace of cell-based chemical lead discovery.
Materials and Methods
Cell culture and siRNA, miRNA, and plasmid delivery
Cell lines were kind gifts from Fred Grinnell (BR5 human fibroblasts), Xiaodong Wang (U2OS GFP-LC3), Ryan Potts (U2OS), Gray Peasrson (T47D and MCF7), and John Minna (A549, HCC366, and HCC44), or were purchased from the ATCC (HCT116). Parameters for cell culture and transfection of each line are listed in table S5. U2OS mito-mCherry cells stably harbor a mitochondrially-localized mCherry and were made by transfecting parental U2OS cells with pcDNA3 containing the 5′ COX VIII leader sequence fused to mCherry(28) (a kind gift from Christian Junker) and selecting a single stable clone.
miRNA and siRNA reagents and antibodies
We used the miRIDIAN miRNA library and SMARTpool Kinome siRNA library for cell-based screening (Dharmacon, ThermoScientific). Additional siRNAs were purchased from Dharmacon, Sigma, or Ambion and used as pools of four targeting a specific gene except where use of individual siRNAs was indicated. Antibodies against AMPKα, glycogen synthase kinase 3 beta (GSK3beta), P70S6K, phosphorylated acetyl-CoA carboxylase alpha (ACC)(Ser79), phosphorylated AKT(Ser473), phosphorylated AMPK(Thr172), pan-AKT, phosphorylated GSK3beta(Ser9), phospho-P70S6K(Thr389), phosphorylated Rictor (RPTOR-independent companion of mTOR)(Thr1135), phosphorylated ribosomal protein S6(Ser235/6), phosphorylated tuberous sclerosis 2 (TSC2)(Thr1462), phosphorylated ULK1(Ser555), phosphorylated ULK1(Ser757), Rictor, TBK1, TSC2, and ULK1 were from Cell Signaling Technology. The p62 antibody was from Progen Biotechnik, the GFP and XPB (excision repair cross-complementing rodent repair deficiency, complementation group 3) antibodies were from Santa Cruz Bio, the beta-tubulin antibody was from Sigma, and the DDR2 antibody was from R&D Systems.
Natural products library
The natural products library used for this study is composed of extracts from 92 marine-derived bacterial strains and 20 marine invertebrates (19 sponges, 1 tunicate). The library of microbial natural product fractions was derived from marine-derived Actinomycetes (65), Firmicutes (20) and alpha-proteobacteria (7). These bacteria were cultivated from marine sediment samples collected in the Gulf of Mexico (Texas, Louisiana), estuaries in South Carolina, and the Bahamas. Various techniques were utilized to isolate strains, including use of small-molecule signaling compounds (N-acylhomoserine lactones, siderophores, and surfactins) that mimic the natural environment of the bacteria of interest. Nutrient-limited isolation media, such as those composed of only humic or fulvic acid, were used for isolation of actinomycetes and alpha-proteobacteria from mangrove and estuary sediments. The majority of bacterial isolates were characterized using 16S rRNA phylogenetic analysis following previously described methods (41). Universal 16S rRNA primers FC27 and RC 1492 were used. 16S rRNA sequences were compared to sequences in available databases using the Basic Local Alignment Search Tool. Specific details of the strain isolation and phylogenetics for bacteria discussed in the text are included below. For bacterial isolates not characterized by 16S rRNA, we used morphology to ensure that strains in the collection are not duplicated.
To generate the library, bacterial strains were fermented in 5 × 2.8 L Fernbach flasks each containing 1 L of a seawater-based medium (10 g starch, 4 g yeast extract, 2 g peptone, 1 g CaCO3, 40 mg Fe2(SO4)3·4H2O, 100 mg KBr) and shaken at 200 rpm for seven days at 27 °C. After seven days of cultivation, XAD7-HP resin (20 g/L) was added to adsorb the organic products, and the culture and resin were shaken at 200 rpm for 2 h. The resin was filtered through cheesecloth, washed with deionized water, and eluted with acetone to give a crude extract. Fractionation of the bacterial crude extracts was accomplished using an Isco medium pressure automatic purification system using reversed phase C18 chromatography (gradient from 90:10 H2O:CH3CN to 0:100 H2O:CH3CN over 25 minutes). Each bacterial strain gave rise to 20 fractions for further testing. All natural product fractions in the library were standardized to a concentration of 10 mg/mL in DMSO.
The following generic code was used for the natural product fraction nomenclature, SN-X-###-##. SN-A designates strains for 2007 collection; SN-B designates strains for 2008 collection. As an example, SN-A-048, would be the 48th strain isolated in the 2007 collection. Further numbers SN-A-048-# refer to the active fraction in each of the purification steps leading to the pure compound. For example SN-A-048-7 would designate fraction number 7 from the first purification of the crude extract of SN-A-048. Identification of pure bioactive compounds requires regrowth of the bacterial culture followed by bioassay-guided fractionation. Intermediate purification fractions were labeled SNX-###-int#, and resulting pure compounds were labeled SNX-###-cmp#. Complete details of the isolation and purification of natural products can be found in the Supplementary Materials and Methods. Details of the analysis of the purified compounds are provided in fig. S9.
Cell-based, high-throughput screens
All gene expression-based functional signature screens were performed in triplicate in the human colon tumor cell line HCT116 in 384-well microtiter plate format. Cells were propagated in DMEM (Cellgro) supplemented with 10% FBS (serum Lot M0017 from Atlanta Biologicals), L-Glutamine, and NEAA (propagation medium). Transfection of Thermo Fisher Scientific's (Dharmacon) human siARRAY® library SMARTpools and miRNA mimics was based on the Wet Reverse Transfection Version 2.0 protocol with modifications developed for use with equipment and layout of the Eppley Cancer Center HTS Screening Facility. siRNA pools and miRNA mimics (final concentrations of 50 nM) were complexed with Dharmafect 4 (0.05 μl/well) reagent prior to plating with HCT116 cells (2,500 cells/well) in a final volume of 30 μl propagation medium. After 72 hrs, cells in each individual well were lysed in 20 μl of QuantiGene Plex 2.0 assay (Panomics) lysis buffer containing 10 μL of Proteinase K per mL lysis buffer and stored at -80°C until further assayed for gene expression signatures. Natural product library screens were performed in HCT116 cells (2,500 cells/well) plated in 50 μL of propagation medium. 48 hours post plating, cells were treated with 60 μg/mL of natural product extract (0.3 μL) or indicated concentration of known drug for 21 hours. Cells lysates were generated and frozen as described above. Although optimal timing for individual reagents within each library varied, this scheme was chosen to maximize the ability to detect changes in gene expression induced by most reagents within each class. Endogenous expression of ALDOC, NDRG1, BNIP3, BNIP3L, ACSL5, LOXL2, HPRT, and PPIB mRNA in each well were measured using QuantiGene Plex 2.0 assays (Panomics) with a Luminex 200 machine (Luminex) following manufacturer's protocols. The protocol is based on branched DNA signal amplification using eight fluorescent magnetic bead panels with each bead panel comprised of eight different fluorescent magnetic beads (8×8-plex with a total number of individual fluorescent bead classifications=64). Each cell lysate (40 μl) was added directly to a distinct bead and reagent mix and hybridized overnight at 54°C in a Cytomat 2 shaking incubator (1500 hz). After hybridization, branched signal amplification steps with preamplifier, amplifier, biotin label, and streptavidin-phycoerythrin reagents were performed according to manufacturer's protocol and measured by Luminex 200. A background correction was applied by subtracting the mean of the vehicle only control well values from the raw values for each of the 8 probes. To normalize well-to-well signal variation, the 6 background-corrected probe values per well were divided by geometric mean of the two internal control probes, HPRT and PPIB. To normalize probe-to-probe variation, each probe was further median-normalized and log2 transformed. Distribution of the normalized expression values for each probe is shown in fig. S10; complete data are given in table S1.
Informatics and statistics
To quantify the similarity between expression profiles of different genetic and chemical perturbagens, we measured ordinary distance by Euclidean and Mahalanobis methods and non-ordinary distance by rank conversions of the Euclidean distance and by Pearson correlation coefficient. These strategies were pursued in parallel given the distinct strengths and caveats of each. Euclidean distance was employed for the majority of analyses here except where otherwise indicated. Although accuracy of this distance measure can be affected by any covariance structure present in the expression data set, the 6 reporter genes used here responded relatively independently to each other (fig. S11A). However, given the presence of minor but statistically significant correlations, such as observed between NDRG1 and ACSL5 (r = 0.42), Mahalanobis distance, which accounts for covariance, was also calculated. The Mahalanobis distance reduces to Euclidean when the covariance matrix is the identity matrix. A correlation plot of corresponding Euclidean and Mahalanobis distances, for all pairwise comparisons within the siRNA and miRNA mimic data sets, suggests the covariance structure makes at most a minor contribution to the distance measures (fig. S11B). To detect coherent expression signatures with different magnitudes, as might result from differential knockdown efficiency or chemical potency, correlation coefficients were also employed. In all cases, to systematically assess the significance of short distance pairs, test statistics for distance-sum over triplicate measures were calculated from permuted data. Gene labels for each of the 6 reporter genes were permuted 100 times for each of the triplicates, and the background distance-sum distribution was obtained. The empirical p-value for each pair of perturbations was obtained from the background density distribution. False discovery rates (FDR) were defined by the fraction of expected false positives among all significant hypotheses, which was estimated by fitting a beta-uniform mixture model to the estimated p-values using the Bum class of functions in the ClassComparison package for R (http://bioinformatics.mdanderson.org/Software/OOMPA, fig. S12). The natural products library screen was processed in the same way and resulting empirical p-values were corrected for multiplicity of testing by the Benjamini-Hochberg method. All data processing, permutation, and p-value estimation was carried out using the statistical platform R (http://www.R-project.org). Hierarchical and neighbor joining clustering of Euclidean distance were carried out with the ‘hclust’ and ‘ape’ packages, respectively. ‘SplitsTree4’ was used to draw neighbor joining trees (42). High resolution PDFs of each analysis are provided (Fig. 1A, fig. S2, fig. S3, fig. S4A). A web based search and display tool for FUSION matrix is available at http://whitelab.swmed.edu/fmap/fusion1.php.
MicroRNA mimic sequence alignments and functional similarity density distributions were assessed as follows. Among the 90,525 possible miRNA pairs present in the miRBase version 8.0 miRIDIAN library, 105 pairs have identical sequences, 330 pairs have identical seeds (as defined by nucleotides 2-7) but different sequences, and 90,090 pairs have different seeds. Pearson correlations, from the means of triplicate reporter gene expression values, were calculated for each pair of miRNA mimics and density plots were drawn for all correlations within each group. Wilcoxon tests were used to evaluate significant differences between groups. To calculate sequence similarities between miRNA pairs, the sequence information for each miRNA was FASTA formatted for input to the CLUSTALW (43) multiple Sequence alignment using BLOSUM as the substitution matrix of preference. The output alignment file was used to compute a similarity table using PHYLIP DNADIST (44) [Pasteur institute of France at http://mobyle.pasteur.fr (45)] with values indicating the fraction of identical sites between sequences. The diagonal values are 1.0000.
Endogenous microRNA expression arrays
Total RNA was collected from three million cells using the RNeasy Plus Mini Kit (Qiagen) following manufacturer's protocols for collection of small RNA and mRNA simultaneously. The Human Illumina miRNA Array platform was used to measure the abundance of mature microRNAs in HCT116 cells in biological quadruplicate. Data normalization was performed using quantile normalization and the Partek Batch Effect Remover algorithm. Results are given in table S2. For fig. S1D, negative values were replaced with the value “1”.
GFP-LC3 and mito-mCherry quantitation
Total GFP or mCherry fluorescence per cell was measured by flow cytometry of at least 20,000 cells per condition on a BD FACSCalibur using CellQuest and FlowJo software. For visualization of GFP-LC3-positive punctae, cells were cultured on glass coverslips, rinsed in PBS, fixed with 3.7% paraformaldehyde, permeabilized with cold acetone, and mounted with Vectashield containing DAPI. Images were acquired using a Zeiss Axioplan 2E microscope and Hamamatsu monochrome digital camera with OpenLab software.
Erythroblast maturation assays
Ter119-negative erythroid progenitors were isolated from embryonic day 13.5 Balb/c murine fetal livers using biotin-conjugated antibody recognizing Ter119 antibody followed by Streptavidin particles on a magnetic column as described (46). The purity of the cells was confirmed by staining cells with FITC-CD71 and APC-Ter119 antibodies (all from BD Biosciences) by flow cytometry. Ter119-negative erythroid progenitors were transduced with retroviruses expressing shRNA against ULK1, BMP2K, or a non-silencing shRNA control in the pWH99 vector that also expresses GFP (kindly provided by Dr. Harvey Lodish). Twenty four hours later, Ter119-negative cells were re-purified and differentiated. Erythroid differentiation was monitored on day one and day three using PE-CD71 and APC-Ter119 by flow cytometry (47). Propidium iodide staining was used to exclude dead cells and GFP-positive cells were gated for analysis. The data were acquired on BD FACSCalibur and analyzed by FlowJo 8.8.4. To measure mitochondrial content, cells were stained with 500 nM MitoTracker Deep Red FM (Molecular Probes, Invitrogen) for 30 minutes at 37 degrees C on day three of in vitro differentiation. GFP-positive cells were gated and histograms are overlaid using FlowJo 8.8.4.
Migration through collagen
BR5 human fibroblasts were suspended in 4 mg/ml rat tail collagen (Collagen I, High Concentration from BD Bioscience, catalog #354249) at a concentration of 30 × 106 cells per ml. Two ul were placed in the center of each well in a 96-well plate and incubated for 10 minutes to allow collagen polymerization. The remainder of the well was then coated with 3 mg/ml rat tail collagen without cells for 10 minutes, followed by two washes with DMEM and addition of growth medium containing 50 ng/mL PDGF to stimulate migration with or without DMSO or the indicated natural products in triplicate wells per condition. After overnight incubation cells were fixed, stained for actin and DNA, and imaged. Migration was quantified as the number of nuclei outside the rim of the initial collagen plug. Triplicates were averaged and values were normalized to treatment with DMSO alone to obtain percent migration as compared to control.
Cell viability assays
A549 or HCC366 cells were seeded at 5000 cells per 96-well and allowed to adhere overnight. SN-A-048-7 (6.7 μg/ml) or DMSO alone was added. Five days later, viability was measured using Cell TiterGlo.
Protein kinase activity assays
Kinase assays for TBK1 were performed as previously described (40). SNB-003-cmp1 at the indicated concentrations was assayed with the KinaseProfiler (Millipore)in vitro kinase activity assays for TBK1, PDK1, and a panel of 235 additional human kinases (table S4).
Supplementary Material
Acknowledgments
We thank Angela Diehl, the UT Southwestern Live Cell Imaging Facility, the UT Southwestern High Throughput Screening Laboratory, and the UNMC Eppley Cancer Center High Throughput Screening Facility for their assistance. We also thank Fred Grinnell, Xiaodong Wang, Ryan Potts, Gray Peasrson, John Minna, and Christian Junker for providing reagents.
Funding: M.P. was supported by T32 CA124334 and a Komen for the Cure Postdoctoral Fellowship. K.F. was supported by a Physician/Scientist Training Award from the American Diabetes Association. H.K, Y.O., and Y.C. were supported by the Cancer Intervention and Prevention Discovery Program (RP101496). M.H. was supported by Consejo Nacional de Ciencia y Tecnología. Additional support was from the Welch Foundation (I-1414 to M.W. and I-1689 to J.M.), the National Institutes of Health (CA129451 and CA071443 to M.W., CA157774 and CA90400 to R.E.L., CA149833 to J.M., and CA152301 to Y.X.,), and the Chilton/Bell Foundation (J.M.).
Footnotes
Author Contributions: Experiments were designed by M.B.P. and M.A.W. and performed by M.B.P. with assistance from F.C. and S.M. unless otherwise stated. The gene expression assay was designed by R.E.L. and K.W.F. and performed by K.W.F. Adaptation of the gene expression assay to identify previously unkown functions of chemical and genetic reagents on a broad scale was conceived by M.A.W. and M.B.P. The informatics and statistical analyses were performed by H.S.K., G.X., and Y.X. except for the analysis of physically interacting kinases which was carried out by T.I. and M.H. The website was designed by H.S.K. and M.A.W. and created by H.S.K. The natural product library was conceived and assembled by J.B.M. Purification and structural determination of select bioactive compounds were performed by Y.H. and Y.C. with bioassays designed and performed by Y.-H.O., M.L.H.-H., and M.B.P. The erythrocyte experiments were designed by L.J.H. and performed by G.B.B. The BR5 migration experiments were designed and performed by M.L.H.-H. The figures were assembled by M.B.P. The manuscript was written by M.B.P., J.B.M., and M.A.W.
Data availability: A web based search and display tool for FUSION matrix is available at http://whitelab.swmed.edu/fmap/fusion1.php. Data requests should be addressed to M.W. (Michael.White@UTSouthwestern.edu). Requests for natural products should be addressed to J.M. (John.MacMillan@UTSouthwestern.edu).
Competing Interests: The authors declare they have no competing interests.
References and Notes
- 1.Newman DJ, Cragg GM. Natural products as sources of new drugs over the 30 years from 1981 to 2010. J Nat Prod. 2012;75:311–335. doi: 10.1021/np200906s. [DOI] [PMC free article] [PubMed] [Google Scholar]
- 2.Shoemaker RH. The NCI60 human tumour cell line anticancer drug screen. Nat Rev Cancer. 2006;6:813–823. doi: 10.1038/nrc1951. [DOI] [PubMed] [Google Scholar]
- 3.Carter GT. Natural products and Pharma 2011: strategic changes spur new opportunities. Nat Prod Rep. 2011;28:1783–1789. doi: 10.1039/c1np00033k. [DOI] [PubMed] [Google Scholar]
- 4.Hieronymus H, Lamb J, Ross KN, Peng XP, Clement C, Rodina A, Nieto M, Du J, Stegmaier K, Raj SM, Maloney KN, Clardy J, Hahn WC, Chiosis G, Golub TR. Gene expression signature-based chemical genomic prediction identifies a novel class of HSP90 pathway modulators. Cancer Cell. 2006;10:321–330. doi: 10.1016/j.ccr.2006.09.005. [DOI] [PubMed] [Google Scholar]
- 5.Hughes TR, Marton MJ, Jones AR, Roberts CJ, Stoughton R, Armour CD, Bennett HA, Coffey E, Dai H, He YD, Kidd MJ, King AM, Meyer MR, Slade D, Lum PY, Stepaniants SB, Shoemaker DD, Gachotte D, Chakraburtty K, Simon J, Bard M, Friend SH. Functional discovery via a compendium of expression profiles. Cell. 2000;102:109–126. doi: 10.1016/s0092-8674(00)00015-5. [DOI] [PubMed] [Google Scholar]
- 6.Lamb J, Crawford ED, Peck D, Modell JW, Blat IC, Wrobel MJ, Lerner J, Brunet JP, Subramanian A, Ross KN, Reich M, Hieronymus H, Wei G, Armstrong SA, Haggarty SJ, Clemons PA, Wei R, Carr SA, Lander ES, Golub TR. The Connectivity Map: using gene-expression signatures to connect small molecules, genes, and disease. Science. 2006;313:1929–1935. doi: 10.1126/science.1132939. [DOI] [PubMed] [Google Scholar]
- 7.Stegmaier K. Genomic approaches in acute leukemia. Best Pract Res Clin Haematol. 2006;19:263–268. doi: 10.1016/j.beha.2005.11.001. [DOI] [PubMed] [Google Scholar]
- 8.Stegmaier K, Ross KN, Colavito SA, O'Malley S, Stockwell BR, Golub TR. Gene expression-based high-throughput screening(GE-HTS) and application to leukemia differentiation. Nat Genet. 2004;36:257–263. doi: 10.1038/ng1305. [DOI] [PubMed] [Google Scholar]
- 9.Zimmer M, Lamb J, Ebert BL, Lynch M, Neil C, Schmidt E, Golub TR, Iliopoulos O. The connectivity map links iron regulatory protein-1-mediated inhibition of hypoxia-inducible factor-2a translation to the anti-inflammatory 15-deoxy-delta12,14-prostaglandin J2. Cancer Res. 2010;70:3071–3079. doi: 10.1158/0008-5472.CAN-09-2877. [DOI] [PMC free article] [PubMed] [Google Scholar]
- 10.Farh KK, Grimson A, Jan C, Lewis BP, Johnston WK, Lim LP, Burge CB, Bartel DP. The widespread impact of mammalian MicroRNAs on mRNA repression and evolution. Science. 2005;310:1817–1821. doi: 10.1126/science.1121158. [DOI] [PubMed] [Google Scholar]
- 11.Bartel DP. MicroRNAs: target recognition and regulatory functions. Cell. 2009;136:215–233. doi: 10.1016/j.cell.2009.01.002. [DOI] [PMC free article] [PubMed] [Google Scholar]
- 12.Papin JA, Hunter T, Palsson BO, Subramaniam S. Reconstruction of cellular signalling networks and analysis of their properties. Nat Rev Mol Cell Biol. 2005;6:99–111. doi: 10.1038/nrm1570. [DOI] [PubMed] [Google Scholar]
- 13.Griffith OL, Pleasance ED, Fulton DL, Oveisi M, Ester M, Siddiqui AS, Jones SJ. Assessment and integration of publicly available SAGE, cDNA microarray, and oligonucleotide microarray expression data for global coexpression analyses. Genomics. 2005;86:476–488. doi: 10.1016/j.ygeno.2005.06.009. [DOI] [PubMed] [Google Scholar]
- 14.Eisen MB, Spellman PT, Brown PO, Botstein D. Cluster analysis and display of genome-wide expression patterns. Proc Natl Acad Sci U S A. 1998;95:14863–14868. doi: 10.1073/pnas.95.25.14863. [DOI] [PMC free article] [PubMed] [Google Scholar]
- 15.Saitou N, Nei M. The neighbor-joining method: a new method for reconstructing phylogenetic trees. Mol Biol Evol. 1987;4:406–425. doi: 10.1093/oxfordjournals.molbev.a040454. [DOI] [PubMed] [Google Scholar]
- 16.Griffiths-Jones S, Grocock RJ, van Dongen S, Bateman A, Enright AJ. miRBase: microRNA sequences, targets and gene nomenclature. Nucleic Acids Res. 2006;34:D140–144. doi: 10.1093/nar/gkj112. [DOI] [PMC free article] [PubMed] [Google Scholar]
- 17.Caffrey DR, Zhao J, Song Z, Schaffer ME, Haney SA, Subramanian RR, Seymour AB, Hughes JD. siRNA off-target effects can be reduced at concentrations that match their individual potency. PLoS One. 2011;6:e21503. doi: 10.1371/journal.pone.0021503. [DOI] [PMC free article] [PubMed] [Google Scholar]
- 18.Parsons BD, Schindler A, Evans DH, Foley E. A direct phenotypic comparison of siRNA pools and multiple individual duplexes in a functional assay. PLoS One. 2009;4:e8471. doi: 10.1371/journal.pone.0008471. [DOI] [PMC free article] [PubMed] [Google Scholar]
- 19.Birmingham A, Anderson EM, Reynolds A, Ilsley-Tyree D, Leake D, Fedorov Y, Baskerville S, Maksimova E, Robinson K, Karpilow J, Marshall WS, Khvorova A. 3′ UTR seed matches, but not overall identity, are associated with RNAi off-targets. Nat Methods. 2006;3:199–204. doi: 10.1038/nmeth854. [DOI] [PubMed] [Google Scholar]
- 20.Jackson AL, Burchard J, Schelter J, Chau BN, Cleary M, Lim L, Linsley PS. Widespread siRNA “off-target” transcript silencing mediated by seed region sequence complementarity. RNA. 2006;12:1179–1187. doi: 10.1261/rna.25706. [DOI] [PMC free article] [PubMed] [Google Scholar]
- 21.Chan EY, Kir S, Tooze SA. siRNA screening of the kinome identifies ULK1 as a multidomain modulator of autophagy. J Biol Chem. 2007;282:25464–25474. doi: 10.1074/jbc.M703663200. [DOI] [PubMed] [Google Scholar]
- 22.Kim J, Kundu M, Viollet B, Guan KL. AMPK and mTOR regulate autophagy through direct phosphorylation of Ulk1. Nat Cell Biol. 2011;13:132–141. doi: 10.1038/ncb2152. [DOI] [PMC free article] [PubMed] [Google Scholar]
- 23.Behrends C, Sowa ME, Gygi SP, Harper JW. Network organization of the human autophagy system. Nature. 2010;466:68–76. doi: 10.1038/nature09204. [DOI] [PMC free article] [PubMed] [Google Scholar]
- 24.Ni HM, Bockus A, Wozniak AL, Jones K, Weinman S, Yin XM, Ding WX. Dissecting the dynamic turnover of GFP-LC3 in the autolysosome. Autophagy. 2011;7:188–204. doi: 10.4161/auto.7.2.14181. [DOI] [PMC free article] [PubMed] [Google Scholar]
- 25.Yue Z, Jin S, Yang C, Levine AJ, Heintz N. Beclin 1, an autophagy gene essential for early embryonic development, is a haploinsufficient tumor suppressor. Proc Natl Acad Sci U S A. 2003;100:15077–15082. doi: 10.1073/pnas.2436255100. [DOI] [PMC free article] [PubMed] [Google Scholar]
- 26.Kundu M, Lindsten T, Yang CY, Wu J, Zhao F, Zhang J, Selak MA, Ney PA, Thompson CB. Ulk1 plays a critical role in the autophagic clearance of mitochondria and ribosomes during reticulocyte maturation. Blood. 2008;112:1493–1502. doi: 10.1182/blood-2008-02-137398. [DOI] [PMC free article] [PubMed] [Google Scholar]
- 27.Su AI, Wiltshire T, Batalov S, Lapp H, Ching KA, Block D, Zhang J, Soden R, Hayakawa M, Kreiman G, Cooke MP, Walker JR, Hogenesch JB. A gene atlas of the mouse and human protein-encoding transcriptomes. Proc Natl Acad Sci U S A. 2004;101:6062–6067. doi: 10.1073/pnas.0400782101. [DOI] [PMC free article] [PubMed] [Google Scholar]
- 28.Quintana A, Kummerow C, Junker C, Becherer U, Hoth M. Morphological changes of T cells following formation of the immunological synapse modulate intracellular calcium signals. Cell Calcium. 2009;45:109–122. doi: 10.1016/j.ceca.2008.07.003. [DOI] [PubMed] [Google Scholar]
- 29.Zhu H, Wu H, Liu X, Li B, Chen Y, Ren X, Liu CG, Yang JM. Regulation of autophagy by a beclin 1-targeted microRNA, miR-30a, in cancer cells. Autophagy. 2009;5:816–823. doi: 10.4161/auto.9064. [DOI] [PMC free article] [PubMed] [Google Scholar]
- 30.Zou Z, Wu L, Ding H, Wang Y, Zhang Y, Chen X, Zhang CY, Zhang Q, Zen K. MicroRNA-30a Sensitizes Tumor Cells to cis-Platinum via Suppressing Beclin 1-mediated Autophagy. J Biol Chem. 2012;287:4148–4156. doi: 10.1074/jbc.M111.307405. [DOI] [PMC free article] [PubMed] [Google Scholar]
- 31.Kohmura N, Yagi T, Tomooka Y, Oyanagi M, Kominami R, Takeda N, Chiba J, Ikawa Y, Aizawa S. A novel nonreceptor tyrosine kinase, Srm: cloning and targeted disruption. Mol Cell Biol. 1994;14:6915–6925. doi: 10.1128/mcb.14.10.6915. [DOI] [PMC free article] [PubMed] [Google Scholar]
- 32.Aita VM, Liang XH, Murty VV, Pincus DL, Yu W, Cayanis E, Kalachikov S, Gilliam TC, Levine B. Cloning and genomic organization of beclin 1, a candidate tumor suppressor gene on chromosome 17q21. Genomics. 1999;59:59–65. doi: 10.1006/geno.1999.5851. [DOI] [PubMed] [Google Scholar]
- 33.Cerami E, Gao J, Dogrusoz U, Gross BE, Sumer SO, Aksoy BA, Jacobsen A, Byrne CJ, Heuer ML, Larsson E, Antipin Y, Reva B, Goldberg AP, Sander C, Schultz N. The cBio cancer genomics portal: an open platform for exploring multidimensional cancer genomics data. Cancer Discov. 2012;2:401–404. doi: 10.1158/2159-8290.CD-12-0095. [DOI] [PMC free article] [PubMed] [Google Scholar]
- 34.Gao J, Aksoy BA, Dogrusoz U, Dresdner G, Gross B, Sumer SO, Sun Y, Jacobsen A, Sinha R, Larsson E, Cerami E, Sander C, Schultz N. Integrative analysis of complex cancer genomics and clinical profiles using the cBioPortal. Sci Signal. 2013;6:pl1. doi: 10.1126/scisignal.2004088. [DOI] [PMC free article] [PubMed] [Google Scholar]
- 35.Carr G, Williams DE, Diaz-Marrero AR, Patrick BO, Bottriell H, Balgi AD, Donohue E, Roberge M, Andersen RJ. Bafilomycins produced in culture by Streptomyces spp. isolated from marine habitats are potent inhibitors of autophagy. J Nat Prod. 2010;73:422–427. doi: 10.1021/np900632r. [DOI] [PubMed] [Google Scholar]
- 36.Yamamoto A, Tagawa Y, Yoshimori T, Moriyama Y, Masaki R, Tashiro Y. Bafilomycin A1 prevents maturation of autophagic vacuoles by inhibiting fusion between autophagosomes and lysosomes in rat hepatoma cell line, H-4-II-E cells. Cell Struct Funct. 1998;23:33–42. doi: 10.1247/csf.23.33. [DOI] [PubMed] [Google Scholar]
- 37.Hammerman PS, Sos ML, Ramos AH, Xu C, Dutt A, Zhou W, Brace LE, Woods BA, Lin W, Zhang J, Deng X, Lim SM, Heynck S, Peifer M, Simard JR, Lawrence MS, Onofrio RC, Salvesen HB, Seidel D, Zander T, Heuckmann JM, Soltermann A, Moch H, Koker M, Leenders F, Gabler F, Querings S, Ansen S, Brambilla E, Brambilla C, Lorimier P, Brustugun OT, Helland A, Petersen I, Clement JH, Groen H, Timens W, Sietsma H, Stoelben E, Wolf J, Beer DG, Tsao MS, Hanna M, Hatton C, Eck MJ, Janne PA, Johnson BE, Winckler W, Greulich H, Bass AJ, Cho J, Rauh D, Gray NS, Wong KK, Haura EB, Thomas RK, Meyerson M. Mutations in the DDR2 kinase gene identify a novel therapeutic target in squamous cell lung cancer. Cancer Discov. 2011;1:78–89. doi: 10.1158/2159-8274.CD-11-0005. [DOI] [PMC free article] [PubMed] [Google Scholar]
- 38.Ruiz PA, Jarai G. Discoidin domain receptors regulate the migration of primary human lung fibroblasts through collagen matrices. Fibrogenesis Tissue Repair. 2012;5:3. doi: 10.1186/1755-1536-5-3. [DOI] [PMC free article] [PubMed] [Google Scholar]
- 39.Wu P, Hu YZ. PI3K/Akt/mTOR pathway inhibitors in cancer: a perspective on clinical progress. Curr Med Chem. 2010;17:4326–4341. doi: 10.2174/092986710793361234. [DOI] [PubMed] [Google Scholar]
- 40.Ou YH, Torres M, Ram R, Formstecher E, Roland C, Cheng T, Brekken R, Wurz R, Tasker A, Polverino T, Tan SL, White MA. TBK1 directly engages Akt/PKB survival signaling to support oncogenic transformation. Mol Cell. 2011;41:458–470. doi: 10.1016/j.molcel.2011.01.019. [DOI] [PMC free article] [PubMed] [Google Scholar]
- 41.Mincer TJ, Jensen PR, Kauffman CA, Fenical W. Widespread and persistent populations of a major new marine actinomycete taxon in ocean sediments. Appl Environ Microbiol. 2002;68:5005–5011. doi: 10.1128/AEM.68.10.5005-5011.2002. [DOI] [PMC free article] [PubMed] [Google Scholar]
- 42.Huson DH, Bryant D. Application of phylogenetic networks in evolutionary studies. Mol Biol Evol. 2006;23:254–267. doi: 10.1093/molbev/msj030. [DOI] [PubMed] [Google Scholar]
- 43.Thompson JD, Higgins DG, Gibson TJ. CLUSTAL W: improving the sensitivity of progressive multiple sequence alignment through sequence weighting, position-specific gap penalties and weight matrix choice. Nucleic Acids Res. 1994;22:4673–4680. doi: 10.1093/nar/22.22.4673. [DOI] [PMC free article] [PubMed] [Google Scholar]
- 44.Lim A, Zhang L. WebPHYLIP: a web interface to PHYLIP. Bioinformatics. 1999;15:1068–1069. doi: 10.1093/bioinformatics/15.12.1068. [DOI] [PubMed] [Google Scholar]
- 45.Neron B, Menager H, Maufrais C, Joly N, Maupetit J, Letort S, Carrere S, Tuffery P, Letondal C. Mobyle: a new full web bioinformatics framework. Bioinformatics. 2009;25:3005–3011. doi: 10.1093/bioinformatics/btp493. [DOI] [PMC free article] [PubMed] [Google Scholar]
- 46.Sulahian R, Cleaver O, Huang LJ. Ligand-induced EpoR internalization is mediated by JAK2 and p85 and is impaired by mutations responsible for primary familial and congenital polycythemia. Blood. 2009;113:5287–5297. doi: 10.1182/blood-2008-09-179572. [DOI] [PMC free article] [PubMed] [Google Scholar]
- 47.Socolovsky M, Fallon AE, Wang S, Brugnara C, Lodish HF. Fetal anemia and apoptosis of red cell progenitors in Stat5a-/-5b-/- mice: a direct role for Stat5 in Bcl-X(L) induction. Cell. 1999;98:181–191. doi: 10.1016/s0092-8674(00)81013-2. [DOI] [PubMed] [Google Scholar]
- 48.Bandyopadhyay S, Chiang CY, Srivastava J, Gersten M, White S, Bell R, Kurschner C, Martin C, Smoot M, Sahasrabudhe S, Barber DL, Chanda SK, Ideker T. A human MAP kinase interactome. Nat Methods. 2010;7:801–805. doi: 10.1038/nmeth.1506. [DOI] [PMC free article] [PubMed] [Google Scholar]
Associated Data
This section collects any data citations, data availability statements, or supplementary materials included in this article.