

Abstract
The exact nature of the immune response elicited by autologous induced pluripotent stem cell (iPSC) progeny is still not well understood. Here we show in murine models that autologous iPSC-derived endothelial cells (iECs) elicit an immune response that resembles the one against a comparable somatic cell, the aortic endothelial cell (AEC). These cells exhibit long-term survival in vivo and prompt a tolerogenic contexture of intra-graft characterized by elevated IL-10 expression. In contrast, undifferentiated iPSCs elicit a very different immune response with high lymphocytic infiltration and elevated IFN-γ, granzyme-B, and perforin intra-graft. Furthermore, the clonal structure of infiltrating T cells from iEC grafts is statistically indistinguishable from that of AECs, but is different from that of undifferentiated iPSC grafts. Taken together, our results indicate that the differentiation of iPSCs results in a loss of immunogenicity and leads to the induction of tolerance, despite expected antigen expression differences between iPSC-derived versus original somatic cells.
Keywords: Induced pluripotent stem cells, differentiated derivatives, immunogenicity, T cell receptor (TCR) sequencing
Introduction
Pluripotent stem cells can be artificially generated in vitro by introducing a combination of defined factors into somatic cells 1,2. These cells, termed induced pluripotent stem cells (iPSCs), can differentiate into essentially any somatic cells and thus hold exceptional potential as sources of therapeutic cells for personalized medical applications such as organ repair. From an immunological standpoint, this technology brings tremendous benefits because patients could be treated with autologous cells, thereby avoiding life-long immunosuppressive therapy currently required for preventing rejection of allografts, which is costly and associated with significant side effects. However, the unexpected immunogenicity of syngeneic iPSCs demonstrated by a previous study 3 raised serious concerns about the value of these iPSCs as a source of autologous cellular therapeutics. Slight differences in antigen repertoire introduced by neoantigens arising from genomic alterations acquired during the reprogramming process, or during the differentiation of iPSCs into the desired tissue, can profoundly alter the immunogenicity profiles 4–7. Hence, a thorough assessment of the immunological phenotype elicited by tissues derived from iPSCs is essential prior to the potential translation of this technology into clinics.
In this study, we sought to delineate the impact of terminal differentiation of iPSCs on immunogenicity of their progeny using an autologous mouse model of transplantation and to determine how closely the immunological phenotype elicited by these cells relates to that of corresponding self somatic cells. We show that autologous endothelial tissues derived from iPSCs can elicit an immune response that resembles the one against self, as represented by the aortic endothelial cells (AECs). These cells exhibited long-term survival in vivo and elicited an immune contexture consistent with self-tolerance. By contrast, autologous undifferentiated iPSCs were rejected with hallmark features of lymphocytic infiltration accompanied by abundant expression of interferon-γ and cytotoxic factors (granzyme-B and perforin). To further examine the immunological relatedness among iECs, AECs, and undifferentiated iPSCs, we used high-throughput T cell receptor (TCR) sequencing analysis and found that the clonal structure of infiltrating T cells found in iEC grafts was statistically indistinguishable from that of AEC grafts, but was clearly different from that of undifferentiated iPSC grafts. Taken together, our results demonstrate that differentiation of iPSCs could result in a loss of immunogenicity and in immunological responses that are similar to the one elicited by a corresponding self somatic cell.
Results
Murine iPSCs are rejected in syngeneic recipients
In order to determine the survival kinetics of iPSCs in vivo, fibroblasts from transgenic FVB mice ubiquitously expressing green fluorescence protein and luciferase (GFP.Luc+) were used to generate iPSC lines using two approaches. Reprogramming of fibroblasts was performed using a lentiviral-based or a minicircle plasmid-based approach (genome-integration free) for delivery of the 4 reprogramming factors (Klf4, Oct-4, Sox-2, and c-Myc) as described elsewhere 1,8. The resulting iPSCs were characterized for pluripotency (Supplementary Fig. 1) and their immunogenicity assessed in syngeneic versus immunodeficient recipients. Transgenic expression of the luciferase reporter gene allowed tracking of iPSCs in vivo by bioluminescence imaging (BLI) over the course of the experiment. Mouse iPSCs (1 × 10⁶) were implanted intra-muscularly in the legs of syngeneic FVB mice. BLI tracking of cell survival revealed a complete loss of bioluminescence in both lentiviral- and minicircle-derived iPSCs by days 21 and 42, respectively (Fig. 1a). By contrast, bioluminescence of two iPSC lines persisted in immunodeficient NOD/SCID mice, showing a substantial increase over time consistent with teratoma development. These results suggest that the loss of iPSC bioluminescence observed in syngeneic recipients was due to immunological rejection. A consecutive challenge of iPSC-primed mice with syngeneic iPSCs resulted in the accelerated loss of bioluminescence signals, suggesting that antigen-specific immunological memory had developed (Fig. 1b). To rule out the possibility that the immune response against iPSCs was elicited by the expression of GFP and luciferase, endpoint survival of a lentiviral iPSC line (B6.129.F1) free of these reporter transgenes was also examined 9. To facilitate graft explantation, these reporter transgene-free iPSCs were implanted subcutaneously in the dorsa of syngeneic and immunodeficient mice and removed after 30 days in vivo. Mouse iPSC grafts explanted from syngeneic mice did not show histological features consistent with teratomas (i.e., 3 germ-layer structure) (Supplementary Fig. 2a) and were significantly smaller in size compared to grafts extracted from immunodeficient animals (Supplementary Fig. 2b). To gain additional insight into the quality of the immune response elicited by the syngeneic reporter transgene-free iPSCs, splenocytes from iPSC-primed or naïve syngeneic (B6.129.F10) or allogeneic (BALB/c, C57BL/6, and FVB) mice were re-exposed to B6.129.F1 iPSCs ex vivo for 24 h, and IFN-γ production was measured by ELISPOT. Production of IFN-γ by syngeneic mice was statistically undistinguishable to two allogeneic mouse strains (BALB/c and FVB) but significantly lower than the C57BL/6 allogeneic mouse strain (Supplementary Fig. 2c). To further examine the effect of IFN-γ on the rejection of these cells, a third iPSC line (C57BL/6) was implanted subcutaneously in the dorsa of syngeneic wild type or in IFN-γ knockout (IFN-γ−/−) C57BL/6 recipients. The status of the iPSC grafts was evaluated 30 days post-implantation and, as expected, rejection of iPSCs was abrogated in IFN-γ−/− recipients (Supplementary Fig. 2d).
Fig. 1. Undifferentiated iPSCs derived by lentiviral or genome-integration-free strategies are rejected in syngeneic recipients.

Lentiviral or minicircle-derived iPSCs expressing GFP and luciferase were injected intra-muscularly in syngeneic or immunodeficient recipients and their survival monitored in vivo by bioluminescence imaging (BLI). (a) Representative BLI from one mouse per group demonstrating the longitudinal survival of minicircle and lentiviral-derived iPSCs in syngeneic and immunodeficient recipients. (b) Mean ± s.e.m. bioluminescence of minicircle- versus lentiviral-derived iPSCs in syngeneic and immunodeficient recipients demonstrating a progressive decay in bioluminescence to background levels by 42 days following implantation. After complete decay of bioluminescence signal, mice received a second injection of iPSCs. (c–d) Bioluminescence of iPSCs implanted in primed animals (2nd) had an accelerated decay compared to those receiving the first cell injection (1st). Data are representative of at least 10 animals and 3 independent experiments.
The contextual cellularity of iPSC grafts extracted from syngeneic and immunodeficient mice were drastically different (Supplementary Fig. 3a). Grafts from syngeneic mice comprised predominantly of pauricellular Matrigel and adipocytes but also contained small areas of undifferentiated iPSCs that could still be detected for up to 14 days post-implantation (Supplementary Fig. 3b). Surprisingly, large nodules of undifferentiated iPSCs could still be found in teratomas extracted from immunodeficient mice for at least 30 days post-cell implantation (Supplementary Fig. 3c). Differences in the contextual cellularity of grafts extracted from syngeneic and immunodeficient mice support the premise that iPSCs, or the early progenitors that spontaneously differentiate upon transplantation, are immunogenic. The ability of iPSCs to elicit immune response in a syngeneic setting was also assessed by measuring ex-vivo cytokine responses by splenocytes from mice primed with syngeneic iPSCs. Primed splenocytes co-cultured with syngeneic iPSCs released significantly higher abundance of cytokines associated with innate as well as adaptive immune responses compared to naïve splenocytes (Supplementary Fig. 4). Although iPSCs did undergo certain level of differentiation during the 3 day-assay, ‘terminal’ differentiation of cells did not occur. Overall, these results support the premise that undifferentiated iPSCs or their early progenitors, which may still carry antigenic determinants from the parental iPSCs, are intrinsically immunogenic and elicit an immune response with strong pro-inflammatory and T-helper 1 (TH1) elements.
Terminal differentiation enables survival of iECs in syngeneic mice
GFP.Luc+ iPSCs generated by lentiviral-based reprograming were differentiated in vitro into endothelial cells as previously described 10, and purified by FACS sorting, based on the expression of CD144 and CD31 (Supplementary Fig. 5a). Mouse iECs exhibited transcriptome (Supplementary Fig. 5b) and surface protein marker (Supplementary Fig. 5c–d) profiles that are consistent with endothelial cells. Furthermore, iECs displayed a functional phenotype consistent with endothelial cells, including the production of extracellular matrix material (Supplementary Fig. 5e), uptake of low-density lipoprotein (Supplementary Fig. 5f), and vasculogenesis (Supplementary Fig. 5g). Expression of major histocompatibility complex (MHC) molecules (class-I and class-II) was similar between iECs and AECs (Supplementary Fig. 5h). Functionality and tumorigenicity of iECs were also tested in vivo. In a hindlimb ischemia model, immunodeficient mice were injected with either iECs or vehicle. Engraftment of iECs as well as blood flow in the injured hindlimb were assessed by immunofluorescence staining and laser Doppler perfusion, respectively, 14 days post-cell implantation. iECs successfully engrafted and improved blood perfusion in the hindlimb ischemia model (Supplementary Fig. 6a). Histological evaluation of transplanted murine iECs in the ischemic hindlimb revealed muscle atrophy and degeneration, but no signs of teratoma formation (Supplementary Fig. 6b). Furthermore, immunofluorescence staining for CM-DiI labeled iPSC-ECs verified the localization and survival of iECs in the ischemic hindlimbs (Supplementary Fig. 6c).
Assessment of syngeneic iECs’ immunogenicity was then carried out in vivo and compared to the immunogenicity of the parental iPSC line and to the corresponding syngeneic somatic cell, AEC (Supplementary Fig. 7). To determine the kinetics of cell survival in vivo, cells (1 × 10⁶) were mixed in Matrigel able to maintain graft integrity in situ, and implanted subcutaneously in the dorsa of syngeneic recipients. Survival was monitored by bioluminescence imaging over 63 days. Unlike iPSCs, bioluminescence signals of iECs and AECs were sustained throughout the entire period (Fig 2a–b). The long-term survival of iECs and AECs in syngeneic recipients provides additional evidence that rejection of iPSCs was not due to alloresponses directed against the reporter transgenes (GFP and luciferase). The survival of iECs and AECs was accompanied by a down-regulation of genes previously shown to elicit T cell-mediated rejection of iPSCs in syngeneic mice 3, including HORMA domain-containing protein 1 (Hormad1) and zymogen granule protein 16 (Zg16) (Fig. 2c).
Fig. 2. Terminal differentiation of iPSCs results in prolonged survival in vivo and in loss of antigenic determinants. (a).
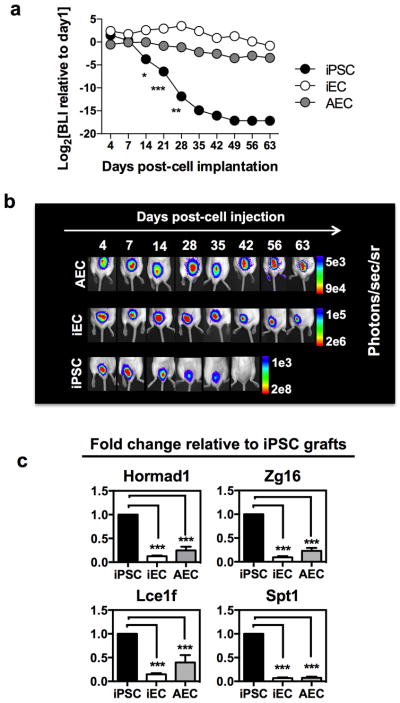
Cellular bioluminescence intensity normalized to day 1 demonstrate a prolonged survival of iECs and AECs relative to iPSCs. (b) Representative bioluminescence images from one animal from each of the 3 groups over 63 days. Bioluminescence data are representative of 2 independent experiments with 3–4 animals per group. (c) Gene expression fold-change in iEC and AEC grafts relative to iPSC grafts. Genes previously shown to elicit T cell-mediated immunological rejection of iPSCs were significantly down-regulated in iEC and AEC grafts. Data are representative of mean ± s.e.m. of 8 biological replicates from 3 independent experiments. Significance of differences between series of results was assessed using ANOVA with Tukey for multiple comparisons. *p<0.05, **p<0.01, ***p<0.001, ****p<0.0001.
Immune response elicited by iECs is similar to the one elicited by self
In order to elucidate and compare the nature of the immune response elicited by different cell types, we next implanted subcutaneously lentivirally-derived iPSCs devoid of reporter transgenes (B6.129.F1), their progeny iECs, and AECs. Cellular grafts were explanted at day 14 and digested enzymatically for cell retrieval. Flow cytometric analysis of the retrieved cells revealed a prominent lymphocytic infiltration in iPSC grafts compared to iEC, AEC, and sham (Matrigel only) grafts (Fig. 3a). T cell infiltration was detected in all graft types but was negligible in sham grafts. This suggests that the vehicle used for cell injection had a minimal effect on the immunological response that developed against the different cellular grafts. iECs and AECs elicited similar T cell infiltration (~4–5% of CD45+ leukocytes), with CD4+ T cells being the most prevalent T cell type found in these grafts (accounting for ~80% of the CD3+ infiltrating T cells) (Fig. 3b–c). Overall, macrophages (F4/80+) represented the majority of the leukocytes infiltrating iECs, AECs, and sham grafts (Supplementary Fig. 8a). The percentage of FoxP3-expressing CD4+ T cells detected in iEC grafts was statistically undistinguishable from the one found in AECs but was significantly lower than in iPSC (Fig. 3d). At the transcript level, FoxP3 expression in iEC and AEC grafts were elevated compared to iPSC but these differences did not reach statistical significance (Supplementary Fig. 8b). By contrast, a much more hostile immune response was elicited by iPSCs, with significantly higher infiltration of T cells, and CD8+ T cells representing ~50% of the T cell infiltrates (Fig. 3b–c). To further characterize the immunobiology of iECs compared to ‘self’ (AECs) and the parental iPSC lines, mRNA expression of cytokines and cytolytic factors known to be important in rejection responses was measured intra-graft. Expression analysis revealed a significant up-regulation of granzyme-B, perforin, and IFN-γ in iPSC grafts compared to iEC and AEC grafts (Fig. 3e). These results suggest that with terminal differentiation, iECs may approach a state of ‘self’ and are tolerated by the immune system.
Fig. 3. Immune response elicited by iECs resembled the one by AECs.

Lymphocytic infiltration in cellular grafts was measured by FACS. (a) The iPSC graft displayed marked increase in lymphocytes compared to iEC, AEC, and sham grafts. (b) Percentage (left) and absolute counts (right) of infiltrating CD3+ T cells was reduced in terminally differentiated iECs and AECs. (c) Helper CD4+ T cells were predominant among the T cells infiltrating iEC and AEC grafts. By contrast, cytotoxic (CD8+) T cells were found at a much higher percentage in iPSC grafts. Percentages of CD4+ and CD8+ cells were calculated from CD3+ parental gate. (d) Percentage of FoxP3 expression in CD4+ T cells demonstrating similarity between iEC and AECs and higher expression in iPSC, that is consistent with tumor microenvironment. (e) Fold-change in gene expression relative to sham grafts demonstrating the differences in immunological milieu intra-grafts, with iPSCs having significantly higher mRNA expression of cytotoxic and cytolitic factors compared to iEC and AEC grafts. Data are representative of mean ± s.e.m. of 8 animals per group from 3 experiments. Significance of differences between series of results was assessed using ANOVA with Tukey for multiple comparisons. *p<0.05, **p<0.01, ***p<0.001, ****p<0.0001.
iPSC immunogenicity is not dictated by reprogramming method
In order to determine the potential immunologic effects associated with residual viral DNA in the iPSCs and iEC progeny, an additional integration-free iPSC line was generated. Reprogramming of murine tail fibroblasts was performed using a novel codon optimized mini-intronic plasmid (MIP) expressing the four reprogramming factors Oct4, KLF4, Sox2 and c-Myc. MIP-iPSCs were then differentiated to endothelial cells (MIP-iECs) and characterized for endothelial phenotype (Supplementary Fig. 9). Subsequently, MIP-iECs were implanted into syngeneic recipients and grafts characterized for elements of innate and adaptive immune response such as the percentages of infiltrating immunosuppressive versus pro-inflammatory cell types compared to endothelial cells derived from lentiviral-reprogrammed iPSCs (LV-iECs). Interestingly, our results suggest that transplantation of integration-free non-viral MIP-iECs may not be immunologically advantageous over its lentiviral counterpart. MIP-iECs elicited a 10% higher infiltration of neutrophils compared to LV-iECs (Fig. 4a). Among the CD4+ and CD8+ T cells infiltrating MIP-iEC grafts, a higher percentage had an effector memory phenotype (CD44+) compared to LV-iEC (Fig. 4b,c). Among the CD4+ T cells infiltrating the LV-iEC grafts, a higher percentage of them expressed the activation marker CD69 (Fig. 4c), but it is important to note that CD69 expression has also been reported in T regulatory cells known to suppress T cell proliferation among other suppressive functions.11 Furthermore, the percentage of CD8+ T cells-expressing granzyme-B, a serine protease released with cytotoxic activity, was significantly higher in MIP-iEC compared to LV-iEC grafts (Fig. 4d). Finally, the percentage of FoxP3+-expressing CD4+ T cells was undistinguishable between MIP- and LV-iEC grafts. Taken together, these data suggest that viral-based methods of iPSC reprogramming may not be any less advantageous than non-viral integration-free-based methods in the context of establishing non-immunogenic iPSC derivatives. We believe that other factors, such as partial reprogramming or genetic instabilities, are likely to play a much more relevant role in dictating the immunological fate of iPSC progeny.
Fig. 4. FACS analysis of digested LV-iEC and MIP-iEC grafts show differences in immune response elicited in syngeneic recipients.

(a) Among the leukocytes infiltrating MIP-iEC and LV-iEC grafts, macrophages with either suppressor (CD3−CD11b+CD11c−Gr1+) or activated (CD3−CD11b+CD11c+MHC-II+Gr1−) phenotype were present at similar proportions. MIP-iEC grafts had a significantly higher prevalence of neutrophils (CD3−CD11b−CD11c−Gr1+) compared to LV-iEC. (b–c) A higher percentage of CD8+ and CD4+ T cells infiltrating MIP-iEC grafts expressed CD44 effector memory marker compared to the ones infiltrating LV-iEC grafts. (d) CD8+ T cells infiltrating MIP-iEC grafts had a significantly higher expression of Granzyme-B compared to the ones infiltrating LV-iEC grafts. Data are representative of mean ± s.e.m. of 4 to 5 animals per group from one experiment. Significance of differences between series of results was assessed using two-tailed unpaired Student t-test.*p<0.05.
Terminally differentiated iECs elicit tolerance intra-graft
In order to better characterize the events that led to the acceptance of iECs, the expression of 84 genes linked to T cell quiescence and tolerance was quantified in iEC and iPSC grafts. Expression analysis revealed a panel of 19 genes that were significantly up-regulated in iEC compared to iPSC grafts (Supplementary Table 1). Hierarchical clustering revealed that some of these genes were part of a prominent aggregate in iEC grafts (Fig. 5a). This cluster contained genes known to be negative regulators of T helper 1 (TH1) cell-mediated inflammation (STAT3) 12–14, transducers of apoptosis signals (TNFRSF10b) 15, mediators of TGF-β signaling (Fos) 16, and potent regulators of adaptive immunity (IL-10 and TGF-β) 17,18. More importantly was the striking up-regulation of genes that encode the immunoregulatory cytokines IL-10 and TGF-β found in iEC grafts compared to iPSC grafts which was validated on a larger biological sample size (Fig. 5b). Furthermore, immunofluorescence staining supported these findings by demonstrating a significant presence of IL-10 in iEC grafts compared to other grafts (Fig. 5c and Supplementary Fig. 10a). To rule out the possibility that the abundant IL-10 in iEC grafts originated from cellular infiltrates and not from the iECs themselves, staining of IL-10 was performed in conjunction with an endothelial-specific marker, von Willebrand Factor (vWF). No association between IL-10 and vWF was found, suggesting that this cytokine originated from the cellular infiltrates rather than the iECs themselves (Supplementary Fig. 10b). Next, to determine the role of IL-10 in promoting iEC acceptance, antibody-based neutralization of IL-10 was performed. Treatment with anti-IL-10 resulted in a reduction of iEC bioluminescence in syngeneic recipients by 3 weeks after cell implantation, suggesting that IL-10 was required for tolerance to iECs (Supplementary Fig. 11a). Finally, in order to exclude the possibility that the effects mediated by anti-IL-10 were due to antibody-dependent cell death, anti-IL-10 cytotoxicity to iECs was examined in vitro. Our results showed that anti-IL-10 did not induce iEC cytotoxicity (Supplementary Fig. 11b).
Fig. 5. iECs elicited activation of a tolerogenic transcriptome network.

(a) Hierarchical clustering revealed a group of 9 genes (right panel) consistently up-regulated iEC grafts and with similar expression levels. These genes are known members of a pathway involved in regulation of IL-10. Data are representative of 3 animals per group. (b) Fold-change in gene expression relative to sham grafts confirming the pro-tolerogenic phenotype of iEC and AEC grafts. Data are representative of mean ± s.e.m. of 3 to 4 animals per group from 3 independent experiments. Significance of differences between series of results was assessed using ANOVA with Tukey for multiple comparisons. (c) Immunofluorescence staining demonstrating IL-10 abundance in iPSC, iEC, and AEC grafts. Quantification of IL-10 expression was performed in 5 random fields from each graft type (40× magnitude). Data are representative of mean ± s.e.m. of a minimum of 1000 cells from 5 randomly selected fields. *p<0.05, **p<0.01, ***p<0.001, ****p<0.0001.
Immune cells infiltrates in differentiated grafts are tolerogenic
The tolerogenic effect associated with terminal differentiation of iPSCs on the elicited immune response was further characterized directly on graft infiltrating immune cells. For this, T cells (CD4+ and CD8+) and suppressor macrophages (CD11c−CD11b+Gr1+) were isolated from the different grafts by FACS. The expression analysis of a panel of 14 genes, well described in the literature to be associated with suppression of T cell function and peripheral tolerance 19, were analyzed using the Fluidigm single cell-PCR platform 20. Expression analysis of the immune cells supported our results by demonstrating that induction of immunological self-tolerance accompanies terminal differentiation of iPSCs (Fig. 6). In the three immune cell types analyzed, up-regulation of a tolerogenic network of genes was found in T cells and macrophages infiltrating iEC and AEC compared to iPSC grafts. Protein-encoding genes associated with the suppressor function of regulatory T cells (Tregs) and type-1 regulatory T cells (Tr1), such as IL-10 and TGF-β, were consistently up-regulated in CD4+ T cell isolated from iEC and AEC grafts. The up-regulation of IL-10, which was accompanied by an overexpression of FoxP3 in CD4+ T cells, further strengthens the notion that regulatory T cells may be key players in modulating acceptance of iECs. Additional protein-encoding genes associated with suppression function as well as with anergy of T cells, such as CD39, CD73 21, and CTLA4 22, were also similarly up-regulated in iECs and AECs. These similarities were particularly evident when comparing AECs to LV-iECs, supporting the flow cytometric results demonstrated in Fig. 5. Interestingly, MIP-iECs induced a different set of genes to similar levels as the AECs, especially in CD8+ T cells and macrophages. Among these are Egr2 and Egr3 that increase E3 ubiquitin ligases, thereby inhibiting T cell activation. Furthermore, the induction of PD-1, as well as GRAIL and Itch, which was more evident in MIP-iECs compared to LV-iEC-infiltrating CD8+ T cells and macrophages, are known to result in T cell inhibition 23,24 and suppression of pro-inflammatory cytokines 25. Taken together, our results support the notion that terminal differentiation towards iECs induces a tolerogenic network that is also induced by self.
Fig. 6.

Heatmaps illustrating the patterns of expression of genes associated with tolerance and anergy in CD4+ T cells, CD8+ T cells, and suppressor macrophages (CD3−CD11c−CD11b+Gr1+) extracted from grafts. Fold-change in gene expression of immune cell infiltrates in iEC and AEC grafts relative to undifferentiated iPSC grafts, demonstrating a more tolerogenic and anergic phenotype of immune cells infiltrates from iEC and AEC grafts compared to iPSC grafts. Data are representative of 5 animals per group.
T cell clonality of iEC grafts is fundamentally different from iPSCs
To further examine similarities among grafts, we next used high-throughput T cell receptor (TCR) sequencing analysis of genomic DNA isolated from the tissue grafts to elucidate differences in the clonal structure of T cells infiltrating iPSC, iEC, and AEC grafts. We first examined the distribution of CDR3 lengths obtained by sequencing, which yielded results very similar to those of a conventional spectratyping method of measuring T cell repertoire diversity. This produced a restricted skewing in the distribution of CDR3 lengths in iPSC-infiltrating T cells versus iEC- or AEC-infiltrating T cells (Fig. 7a). This pattern of restriction in the distribution of CDR3 lengths correlates closely with oligoclonal or monoclonal cells 26–28. One major limitation of CDR3 spectratyping has been the difficulty in statistically comparing samples or quantifying T cell clones by sequence identity. We next compared the clonal T cell repertoire structure in iPSC-, iEC-, and AEC-infiltrating T cells. We found that the iPSC-infiltrating T cell repertoire showed a remarkable expansion of only a few clones when compared to iEC- or AEC-infiltrating T cell repertoires. We found that the top five dominant T cell clones accounted for 30–55% of the total TCR diversity of T cell infiltrates in iPSC grafts, making this T cell response highly skewed towards a few clones in comparison to the fraction of diversity of the top five clones in iEC (15–20%) or AEC (10–25%) grafts. Therefore, relatively few clones dominated the T cell infiltrates of iPSC grafts, a pattern that was statistically different from that seen in iEC grafts (Fig. 7b; p<0.001; two-tailed unpaired Student t-test). Control experiments with splenic samples from the same mice showed no repertoire skewing in the spleens of mice with iPSC grafts, which suggests that the skewed clonality is a property of the grafts themselves and not a biased sampling of the repertoire (Supplementary Fig. 12). These data are consistent with the observation that oligoclonal expansion of a limited number of T cell clones is a hallmark of adaptive immune recognition that has been characterized as a reproducible feature of tissue rejection and is regarded as a measure of skewness in TCR repertoire 29,30.
Fig. 7. T cell repertoire studies of graft infiltrates.

(a) T cells infiltrating iPSC grafts show repertoire restriction. CDR3 length distribution of TCR sequences obtained from a representative syngeneic rejected iPSC graft (left panel), accepted iEC graft (central panel), and accepted AEC graft (right panel). (b) T cells infiltrating iPSC grafts show a statistically significant expansion of a few dominant T cell clones compared to iEC or AEC infiltrating cells. Results are pooled from two experiments, n=3 mice per group. (c) The T cell repertoires of iEC and AEC grafts are statistically indistinguishable but different from iPSC repertoires. Bhattacharyya coefficients of relatedness averaged for comparisons within experimental groups. Data are representative of mean ± s.e.m. of 3 animals per group from two independent experiments are reported here. Significance of differences between series of results was assessed using unpaired two-tailed Student t-test ***p<0.001, ****p<0.0001.
One remaining question is whether the same T cell clones were expanding within the grafts. We examined this in two ways: the first was to look at how the top 50 T cell clones within the graft were shared, and the second approach used statistical methods of whole repertoire comparison. We compared all of the mice within each experiment for the number of shared clones in the top 50 by rank order. We found that very few T cell clones were shared overall (Supplementary Table 2), with iPSC to iPSC comparisons averaging 3.7 shared clones in the top 50 between any two mice within experiments, versus iEC to AEC (11.1 shared clones), iEC to iEC (8.7 shared clones), and AEC to AEC (12.3 shared clones). Importantly, while the exact CDR3 sequence of the top T cell clones was not the same among grafts for different mice within and between each experiment, the proportion of T cell expansion was similar.
Using an information theory based metric of similarity, the Bhattacharyya coefficient (BC) of relatedness that takes into account sequence identity and relative frequency of clones between samples 31, we next examined the similarity in the entire TCR repertoires of T cells infiltrating the different grafts. A comparison of the grafts derived from the same tissue type among mice (iEC versus iEC or AEC versus AEC) showed values between 0.20 and 0.24, whereas the iPSC to iPSC comparison showed a value 0.15 to 0.18. The comparison of iEC to AEC tissues was statistically indistinguishable from iEC versus iEC, or AEC versus AEC, comparisons (Fig. 7c; p=0.66; two-tailed unpaired Student t-test). By contrast, comparisons of iPSC to iEC and AEC showed less relatedness with values of 0.12 for iPSC versus iEC and 0.10 for iPSC versus AEC. These results indicate that the TCR repertoire of iPSC-infiltrating T cells is statistically distinguishable from that of iEC- or AEC-infiltrating T cells (Fig. 7c). Since AEC and iEC relatedness cannot be distinguished between themselves or from one another, but can be distinguished for comparisons to iPSC, we conclude that the T cell response to iPSCs is fundamentally different from that of AEC or iEC tissues at a clonal level.
Discussion
Transplantation of tissues derived from autologous iPSCs has the potential to treat many medical conditions, but a major concern for this approach is whether the immune system will accept iPSC-derived terminally differentiated tissues. Recent research has demonstrated that iPSCs retain epigenetic artifacts from the parental cells and from the reprogramming process 32,33. These changes can affect iPSCs’ ability to efficiently differentiate into functional somatic cells, and most importantly, their ability to persist in their differentiated state after terminal differentiation 34. These factors can have serious implications for the safety and sustainability of iPSC derivatives in vivo, including tumorigenicity 35 and immunogenicity 3,36,37. Here we show that iPSCs generated by either lentiviral or genome integration-free methods are immunogenic in syngeneic recipients, which supports previous findings by Zhao et al. 3. Moreover, our results support recent studies demonstrating that terminal differentiation of iPSCs can result in a loss of immunogenicity 36,37 and show for the first time that terminally differentiated iPSCs elicit immune responses consistent with self-tolerance.
Although the lack of rejection of transplanted tissues derived from iPSCs demonstrated here supports findings by Araki et al. 36 and Guha et al. 37, there are critical differences in the experimental methodologies in these studies with respect to this current study. Here we used a mouse model of autologous transplantation to assess the immunogenicity of cells implanted subcutaneously, similar to the mouse model used by Zhao et al. and Araki et al. We observed that undifferentiated lentiviral iPSCs and genome integration-free iPSCs elicited a robust immune response in syngeneic recipients that resulted in bioluminescence signal decay over-time and failure to form teratomas. However, the identity of the antigenic determinants in iPSC grafts was not addressed in our study and it remains unclear whether the robust immune response observed was elicited by the pluripotent cells themselves or by early progenitors that originate from spontaneous differentiation of iPSCs upon transplantation. Our results support the findings described by Zhao et al. but not by Araki et al. In the study by Guha et al., cells were implanted in the sub-renal capsule and rejection of undifferentiated iPSCs was not reproduced. The vascularity and niche of the graft are important factors determining cell survival, immune cell homing and engraftment. The sub-renal capsule is a highly vascularized site that has been vastly used for testing cellular tumorigenicity and has been known to support the growth of tumors that are unable to grow when implanted subcutaneously 38. Secondly, the endpoint for the experiments in Guha et al.’ study was 30 days post-cell implantation. While histological evidence of cell survival was provided at the study end-point, no information that addresses a possible immunogenicity-associated decay in graft viability over the time-course of the study is shown.
In regards to the immunogenicity of terminally differentiated iPSC progeny, our findings support both Guha et al. and Araki et al. who demonstrate that terminally differentiated cells are immunologically accepted when transplanted syngeneically. Similar to our study, Guha et al. transplanted iPSC derivatives (endothelial, neuronal, hepatocytes) differentiated in vitro, while Araki et al. transplanted dermal and bone marrow tissues from highly chimeric mice developed from iPSC and ESC, a strategy that is arguably unrepresentative of a clinical setting. In both studies, grafts were deemed immunogenic based on one end-point assessment of cell survival in histological tissue sections collected at 4 to 5 weeks post-transplantation and based on the amount of T cell infiltration found in grafts. Both studies demonstrated survival of iPSC derivatives at 4 to 5 weeks post-cell transplantation, with minimal to no T cell infiltration. However, while the abundance of T cell infiltration provides important information regarding the involvement of adaptive immune responses on the status of the grafts, relying exclusively on this one parameter to assess the immunogenicity of grafts can be misleading. For instance, regulatory39, anergic40 or exhausted41 T cells are often found in thriving tumors. These T cells are known to facilitate tumor survival and tumor growth by supporting an immunosuppressive environment. Hence utilizing T cell infiltration as main evidence for graft immunogenicity may not be ideal.
In contrast to the undifferentiated parental iPSCs, the endothelial progeny exhibited long-term survival in syngeneic recipients and produced a shift in immunological response consistent with self-tolerance and tissue acceptance. Contrary to previous reports correlating iPSC-derived tissue acceptance to the presence or absence of T cell infiltration 3, our results indicate that T cell infiltration is common to both somatic and iPSC-derived cell grafts. The infiltration of T cells into early grafts may be in response to immune rejection, or in response to the trauma of graft introduction and intra-graft cell death of some tissue that invariably occurs. Importantly, while T cells infiltrating grafts early on was a common theme among iPSC, iEC, and AEC grafts, we found that the cytokine milieu was very different among grafts. Undifferentiated iPSC grafts possessed hallmark elements of cytotoxic T cell responses, whereas iEC and AEC grafts elicited a much more “benign” immune phenotype that was dominated by immunoregulatory cytokines such as IL-10 and TGF-β. The highest IL-10 responses were elicited by iEC grafts, suggesting that while the immune acceptance of iEC grafts is similar to AEC grafts, iECs may still have a certain level of antigen disparity with the recipient. Similar situation occurs for tolerance-inducing approaches in solid organ transplantation where IL-10 is needed for the immune protection of MHC-matched, minor-mismatched, or major-mismatched grafts in many animal models. In these systems, the production of IL-10 in the graft environment is critical for peripheral tolerance and graft acceptance. A key question in the field is how similar to ‘self’ must a graft be in order to be tolerated by the immune cells. Our work shows that iECs are sufficiently similar to ‘self’ tissue to be tolerated. At this point, how similar iECs must be to self remains an open question; hence the mechanism that led to the differences in tolerogenic response elicited by iEC and AEC grafts warrants further investigation. Finally, it is important to consider that the self-tolerogenic response elicited by terminally differentiated endothelial cells may also facilitate the survival of cells with oncogenic potential. Thus, the realization that self-tolerance may potentiate tumorigenesis of autologous iPSC-derived cells needs to be carefully considered and evaluated prior to clinical translation. Finally, the percentage of FoxP3-expressing CD4+ T cells detected in iEC grafts was statistically undistinguishable from the one found in AECs but was significantly lower than in iPSC. Increases in FoxP3 expression have been noted in active immune rejection and may not be as reliable as a marker of tolerance in this setting as measuring effector molecules 45,46. Similarities in FoxP3 expression between iEC and AEC grafts were also present at the mRNA level in total graft tissue as well as in T cell infiltrates.
We also examined the TCR clonal structure of rejecting tissue. Until very recently, oligoclonal and monoclonal T cell responses in tissue rejection were measured using spectratyping and V- and J-chain usage restriction, which is a relatively low-resolution method for tracking specific T cell clones mediating rejection. Alternatively, exhaustive studies have identified specific antigen responses in allogeneic transplants. In some of these cases, the expansion of dominant allo-reactive T cells was found. Using a higher-resolution method for tracking clonal T cell responses of repertoire sequencing, we found that relatively few oligoclonal T cells are greatly expanded in iPSC graft infiltrates versus AEC or iEC grafts. This suggests that iPSC graft infiltrating repertoire has a pattern of immune rejection. Importantly, the same T cell clones do not appear to dominate tissue rejection responses, likely because iPSCs can rapidly and stochastically divide into any number of differentiating tissues and the resulting T cell responses are variable. Our analysis offers novel ways to use TCR repertoire sequencing to help distinguish graft rejection from graft tolerance. Although there is potential for PCR bias in the TCR amplification, all experiments were performed such that all samples from each group—iPSC, iEC, AEC, sham control—were processed at the same time and had the same primers and reagents. Given that the iPSC grafts clearly had different dominant clonal sequences amongst themselves in the grafts, we believe these results are less likely due to the artificial overstating of a clone that appears in iPSC grafts and not in other grafts. In addition, control experiments with splenic samples from the same mice showed no repertoire skewing in the spleens of mice with iPSC grafts, which suggests that the skewed clonality is a property of the grafts themselves and not a biased sampling of the repertoire. While correction of PCR amplification bias should be a goal of the field, so far this is an underappreciated point in the current literature. Researchers are still trying to optimize methods to control for PCR amplification bias and disseminate these methods which is a highly innovative approach not previously available and not tested for murine or other animal models, as recently pointed out by Carlson et al. 47 study. PCR amplification bias is very important for questions such as the detection of minimal residual disease, and statistical analysis can now be applied without bias correction as discussed in Meyer et al. 48. Overall, our statistical analysis explicitly examines the probability of a chance event that a specific clone is somehow amplified better in one sample versus another, but our p-values suggest this is not the case.
In summary, our results indicate that iPSC-derived tissues can be accepted by the immune system without immunosuppressive therapy in a tolerant manner very similar to autologous tissues. Our results also suggest that viral-based reprogramming of iPSCs may not be critical in dictating downstream immunogenicity of iPSC progeny. Prior to clinical translation of iPSC-derived cellular therapy, it will be critical to determine the level of permissible dissimilarity that allows these therapeutic cells to be seen as ‘self’ in autologous transplantation settings. Moreover, establishing the “ground” state of iPSCs (at the epigenome, genome, and proteome levels) required for derivation of safe cellular therapeutics that act as ‘self’ upon transplantation is imperative for the eventual clinical adoption of this technology.
Methods
Mice
Six- to eight-week old female FVB, NOD-scid IL2Rgammanull, C57BL/6, and IFN−/− were obtained from The Jackson Laboratory. B6.129.F1 females were obtained from Taconic. Transgenic FVB mice expressing luciferase and green fluorescence protein were generated at the transgenic animal facility in the Department of Pathology at Stanford University by pronuclear injection of the reporter gene construct. Mice were maintained at the Stanford University Research Animal Facility in accordance with Stanford University’s Institutional Animal Care and Use Committee (IACUC) guidelines.
Derivation and characterization of iECs
iECs were derived using a three-dimensional approach with modifications 10. Briefly, to initiate differentiation, iPSCs were cultured in ultra-low, non-adhesive dishes to form embryoid body (EB) aggregates in EBM2 media (Lonza) in the absence of leukemia inhibitor factor (LIF). After 4 days of suspension culture, the EBs were reattached onto 0.2% gelatin-coated dishes and cultured in EBM2 medium supplemented with VEGF-A165 (50 ng/mL; PeproTech). After 3 weeks of differentiation, single cell suspensions were obtained using a cell dissociation buffer (Life Technologies) and labeled with APC-conjugated CD31 (eBiosciences) and PE-conjugated CD144 (BD Biosciences) anti-mouse antibodies. iECs were purified by fluorescence activated cell sorting (FACS) of CD31+CD144+ population. iECs were maintained in EBM2 media supplemented with recombinant murine vascular endothelial growth factor (50 ng/ml).
Isolation of aortic endothelial cells
B6.129.F10 mice were euthanized and the ascending and descending aorta segments harvested. Aorta was cleaned from surrounding adipose tissue under dissecting microscope. Subsequently, aorta was mechanically and enzymatically dissociated in Collagenase II (1 mg/ml) by incubating at 37°C for 45 min. The digestion mix was triturated every 10 min to ensure complete dissociation. At the end of 45 minutes, the cell suspension was filtered through a 70 um strainer to attain a single cell suspension. Cell suspension was centrifuged at 1200 rpm for 5 min. The pellet obtained was subjected to RBC lysis, followed by a wash with phosphate buffered saline and centrifugation at 1200 rpm for 5 min. The pellet enriched in endothelial cells was immediately seeded on a 0.2% gelatin-coated plate in EGM2 media (Lonza). After 2 weeks of in vitro expansion, endothelial cells were further purified by FACS based on the expression of CD144 and CD31.
Cell graft implantations
Cell injection was conducted under the guidelines of Stanford University Administrative Panel of Laboratory Animal Care. Mice were placed in an induction chamber and anesthesia was induced with 2% isoflurane (Isothesia, Butler Schein) in 100% oxygen with a delivery rate of 2 l/min until loss of righting reflex. Cells (1 × 10⁶) were mixed in 200 ul BD Matrigel High Concentration (1:2) (BD Biosciences) and injected subcutaneously in the lower dorsa of mice using a 28G syringe.
In vivo bioluminescence imaging
Transplanted cell survival was longitudinally monitored via BLI using the Xenogen In Vivo Imaging System (Caliper Life Sciences). Briefly, D-Luciferin (Promega) was administered intraperitoneally at a dose of 375 mg/kg of body weight. Animals were placed in a light-tight chamber, and photons emitted from luciferase expressing cells were collected with integration times of 5 sec to 2 min, depending on the intensity of the bioluminescence emission. BLI signal was quantified in maximum photons per second per centimeter square per steradian (p/s/cm2/sr) and presented as Log10 [photons/second].
Graft explantation and cell isolation
Grafts were explanted, chopped into small fragments and digested with Liberase (27 WU/ml; Roche, Indianapolis, IN) and DNase I (0.1 %; Roche) in DMEM media at room temperature for 30 min followed by incubation at 37°C for 15 min. Digested grafts were passed through a 100 um strainer and centrifuged at 300× g for 10 min at 4°C. Cells were counted and prepared for flow cytometry or snap frozen for RNA and DNA extractions.
Flow cytometric analysis of graft-infiltrating lymphocytes
Fluorophore-conjugated monoclonal antibodies against mouse CD3, CD4, CD8, CD25, FoxP3, CD11c, and NK1.1 (1:100; BD Bioscience or eBioscience) were used in various combinations to stain cells extracted from grafts. For staining, 1×10⁶ cells were used. The Fc receptor was blocked by CD16/32 antibody. Cells were fixed and permeabilized using BD Cytofix/Cytoperm™ Fixation and intra-cellular staining was performed. Cells were assayed using a LSRII flow cytometer (BD Biosciences) and further analyzed with FlowJo software (Tree Star, Ashland, OR, USA).
T cell tolerance and anergy PCR array
Cell grafts harvested from syngeneic recipients 14 days post-implantation were enzymatically dissociated to a single cell suspension and washed with PBS for total RNA extraction by Qiagen RNeasy Mini kit. The RT2Profiler™ PCR Array kits were purchased from SA Bioscience Corporation (Frederick, MD), and all assay procedures were conducted in accordance with the user kit manual. Briefly, one microgram of total RNA from iPSCs or iECs was transcribed into first strand cDNA and loaded into 96-well PCR array plates with 25 μL Q-PCR master mix per well. After performing Q-PCR, resulting threshold cycle values for all genes were exported into the company-provided data analysis template Excel files for comparison of gene expression between iPSC and iEC grafts.
Immunocytochemistry for iEC characterization
Primary antibodies for mouse von Willebrand factor (1:150; Millipore), laminin (1:100; Abcam), and CD144 (1:100; Abcam) were used for iEC characterization. iECs were grown in 0.2% gelatin-coated coverslips and fixed in 4% PFA when they reached 80% confluence. Prior to immunostaining, cells were blocked with 1% BSA for 1 h at room temperature. Subsequently, primary antibodies were maintained overnight at 4°C. Coverslips were washed in PBS and incubated with goat anti-rabbit Alexa Fluor 594 (Invitrogen) for 1.5 h at room temperature. For intra-cellular staining of von Willebrand factor, cells were permeabilized with 0.2% Triton X-100 then subjected to BSA blocking and incubation with the antibody diluted in 1% BSA and 0.1% Triton X-100. Confocal images were taken using Carl Zeiss, LSM 510 Meta (Göttingen, Germany) using a 63x plan apochromat (oil) objective microscope. Images were analyzed using the ZEN software (Carl Zeiss).
LDL uptake
Acetylated low-density lipoprotein (ac-LDL) uptake was performed by incubating iEC monolayers in rhodamine conjugated-ac-LDL (10 μg/ml; Biomedical) for 4 h at 37°C. Subsequently, the medium was removed, and cells were washed with a probe-free medium and harvested for flow cytometric characterization.
Histological analysis
Grafts were harvested and cryo-embedded directly in Tissue Tek O.C.T. (Sakura Finetek) or fixed in 10% buffered formalin overnight after which they were transferred to a 15% w/v sucrose solution until tissue processing and paraffin embedding. Multiple 5 μm tissue sections from each sample were cut at mid-teratoma and stained with hematoxylin and eosin (H&E) for histological analysis. Frozen blocks were mounted on a Leica cryostat CM3050 S (Leica Microsystems) and 8 μm sections were transferred to Superfrost/Plus adhesive slides (Fisher brand) and stored at −80°C. For characterization of cellular contexture of grafts, a surgical pathologist, blinded to the to sample assignment, measured the total surface area of each graft cross-section, assigned lineage differentiation to each of the morphologic components, and determined the representation of each component as a percentage of the total mid-tumor cross-sections area.
IL-10 immunoassaying
Immunostaining was performed using antibodies against IL-10 (1:100; Abcam) and Alexa-488-conjugated (Life Technologies) secondary antibodies (1:1000). Frozen sections were fixed in acetone followed by blocking in 5% horse serum for 60 minutes at room temperature. Sections were then incubated with primary antibody in blocking solution overnight at 4°C. Nuclei were stained with Hoechst 33342 (Life Technologies). Fluorescent images were taken with a Leica SP2 AOBS (Acousto-Optical Beam Splitters) Confocal Laser Scanning Microscope with 20x, 40x, and 63x oil objectives. For resolution of nuclei-dense regions, Z-stacked confocal images were rendered into 3-dimensions using Volocity 6.0.1 software. For IL-10+ cell counts, one independent blinded observer examined 5 random fields at 40x magnitude. Quantification of IL-10 staining was determined by planar association of stain and nuclei.
IL-10 neutralization in vivo
Neutralization of IL-10 was performed using anti-IL-10 antibody (JES5-2A5, BioXCell) or isotype control anti-Rat IgG1 (BioXCell). Mice received 250 μg of antibody intra-peritoneally on days -1, 1, 3, 6, 9, and 12 relative to cell implantation.
Cell viability assay
Cell viability upon treatment with JES5-2A5 antibody was analyzed using an XTT-based in vitro toxicology assay kit (Sigma-Aldrich). Cells were grown in a 96-well plate (Corning) to about 50% confluency, and subsequently subjected to 48 h treatment of different concentrations of JES5-2A5 antibody. During the last 12 h, control cells were treated with 50 nM Antimycin A, a Complex III inhibitor of the mitochondrial electron transport chain, as a positive control for cytotoxicity. Cells at a final density of ~80% were incubated for 4 h in the presence of a 20% XTT reagent diluted in culture medium, protected from light. Absorbance at 450 nm was measured using a plate-reader (Promega).
Derivation and culture of non-viral murine iPSCs
Murine tail tip fibroblasts of mice were dissociated and isolated with collagenase type IV (Life Technologies, Grand Island, NY, USA) and maintained with Dulbecco’s modified Eagle medium (DMEM) containing 10% fetal bovine serum (FBS), L-glutamine, 4.5 g/L glucose, 100 U/mL penicillin, and 100 μg/mL streptomycin at 37°C, 20% O2, and 5% CO2 in a humidified incubator. 1×10⁶ murine fibroblasts were then reprogrammed using a novel codon optimized mini-intronic plasmid (co-MIP) (10–12 μm of DNA) expressing the four reprogramming factors Oct4, KLF4, Sox2 and c-Myc using the Neon Transfection system (unpublished data). After transfection, fibroblast were plated on a MEF feeder layer and kept in fibroblast media with the addition of sodium butyrate (0.2 mM) and 50 μg/mL ascorbic acid. When ESC-like colonies appeared, media was changed to murine iPSC media containing DMEM, 20% FBS, L-glutamine, non-essential amino acids (NEAA), β-mercaptoethanol, and 10 ng/mL leukemia inhibitory factor (LIF). After 2 passages, the murine iPSCs were transferred to 0.2% gelatin coated plates and further expanded. With every passage, the iPSCs were sorted for the murine pluripotency marker SSEA-1 using magnetic activated cell sorting (MACS).
Immunofluorescence staining of cultured cells
Cells were fixed with 4% paraformaldehyde for 20 minutes, permeabilized with 0.2% Triton X-100 in phosphate-buffered saline (PBS) for 30 minutes, and blocked with serum in PBS for 1 h. Cells were then stained with appropriate primary antibodies and AlexaFluor-conjugated secondary antibodies (Life Technologies) and co-stained with DAPI (Vector Laboratories, Burlingame, CA, USA). The primary antibodies for CD31 and CD144 (Abcam, Cambridge, MA, USA) were used in the staining. All murine iECs were also incubated with 10 ug/mL DiI AcLDL (Life Technologies) at 37°C for 6 hours. After washing twice with PBS, DiI AcLDL uptake was detected with fluorescence microscopy. Imaging was performed on a Leica DFC500 inverted microscope.
Quantitative real-time PCR analysis
Total RNA was purified from iPSCs and teratomas using RNeasy Mini kit (Qiagen). RNA (1 μg) was reverse transcribed using a high capacity cDNA transcription kit (Applied Biosystems), followed by high throughput quantitative gene expression analysis using the Syber green-based assay system on the StepOne Plus Realtime PCR platform (Applied Biosystems). Primer sequences for Hormad1, Zg16, Lce1f, and Spt1 were the same as previously described 3. GAPDH was used as the internal control gene for all samples and the ΔΔCt method was used to calculate fold-change of gene expression. For characterization of the intra-graft immunological milieu, Taqman-based realtime PCR was carried out using the same platform as described above. The following Taqman probes were used: IFN-γ (Mm01168134_m1), FoxP3 (Mm00475162_m1), GAPDH (Mm99999915_g1), IL-10 (Mm00439614_m1), TGFβ1 (Mm01178820_m1), Perforin (Mm00812512_m1), and Granzyme B (Mm00442834_m1). For characterization of iECs, the following Taqman probes were used: von Willebrand factor (Mm00550376_m1), CD144 (Mm03053719_s1), and FLK1 (Mm01222421_m1).
TCR sequencing
Genomic DNA was obtained from explanted grafts using Qiagen DNA extraction kits (Qiagen, CA). Multiplex sets of sequencing tagged primers were used to PCR-amplify all the members of the TCRβ repertoire present in a sample using multiplexed primers consisting of 21 V segment primers and 11 J segment primers designed by Gigagen Inc (South San Francisco, CA). Pooled (AEC, iPS, iEC, and Sham) samples were run on an Illumina MiSeq (Illumina, San Diego, CA) to a depth of 2 million sequence reads. The sample sorted fastq files were analyzed using the custom coded in PERL analysis with bash scripting automation. Only error-free TCR sequences occurring at greater than 2 copies were included in analysis. The Bhattacharyya coefficient measures the amount of overlap between two statistical samples, each with a finite number of distinct partitions and probabilities, corresponding to unique clonotypes and their frequencies. It is calculated as:
| (1) |
where fj,1 and fj,2 are the frequencies of clonotype j in samples 1 and 2, respectively, and n is the number of unique clonotypes present across samples 1 and 2. A Bhattacharyya coefficient of 1 between two Rep-Seq samples would mean that the samples are identical in number, sequence, and frequency of unique clonotypes. A value of 0 would mean that no clonotypes are present in both samples, although a value of 0.0 would not be informative about the number of clonotypes or frequencies in either sample. The coefficient was calculated using customize PERL scripts. Statistical evaluation of the comparison of Bhattacharya distances was performed using a standard T test with GraphPad Prism.
Statistical Methods
Differences between groups were assessed by 2-Way ANOVA or Student t- test using GraphPad Prism Software. Bar graphs represent the mean and SEM for each group.
Supplementary Material
Acknowledgments
We thank M. Wernig for providing B6.129.F1 iPSC line; F. Lang and F. Jia for generating FVB.GFP.luc+ iPSC lines; K. Ransohoff and J. Ransohoff for assistance with bioluminescence imaging; M. Grova for assistance with histochemical analysis; A. Morris for assistance with figure preparations; and K. Lee and the Cell Sciences Imaging Facility (CSIF) Fluorescent Microscopy Core at Stanford University for technical assistance with confocal microscopy. This work was supported in part by grants from the California Institute of Regenerative Medicine (CIRM) TR3-05556, CIRM DR2-05394, National Institute of Health (NIH) R01 AI085575, U01 HL099776 (J.C.W); the Oak Foundation, and the Hagey Laboratory for Pediatric Regenerative Medicine (M.T.L); the International Society for Heart and Lung Transplantation Fellowship (P.E.A); American Society for Blood and Marrow Transplantation and NIH NHLBI training grant (E.H.M).
Footnotes
Accession codes
Sequencing data has been deposited in NCBI Biosample under accession number SAMN02708924.
Competing Financial Interests
The authors declare no competing financial interests.
Author Contributions
P.E.A., E.H.M., and N.G.K. conceived, performed, interpreted experiments, and wrote the manuscript. E.H.M analyzed TCR sequencing data; S.D. prepared DNA samples for TCR sequencing and assisted with iPSC derivation; D.D. and V.S-F. conducted gene expression analysis by RT-PCR and Fluidigm and performed immunofluorescence staining of cultured cells; S.H. assisted with derivation of iPSC lines and FACS sorting; A.E. performed IL-10 cytotoxicity assays; J.O. performed histopathological analysis of grafts; N.M. conducted Doppler analysis of vascular perfusion and assisted with histological evaluation of endothelial cell engraftment and LDL uptake; T.P.B. performed bioluminescence imaging and assisted with cell implantation; D.L. and D.M. performed immunohistochemistry for IL-10 immunoassays and assisted with cell implantation. M.T.L. provided part of the histochemical stains and assisted with manuscript writing; R.S.N. provided experimental advice and manuscript writing; and J.C.W. provided experimental advice, manuscript writing, and funding support.
References
- 1.Takahashi K, Yamanaka S. Induction of pluripotent stem cells from mouse embryonic and adult fibroblast cultures by defined factors. Cell. 2006;126:663–676. doi: 10.1016/j.cell.2006.07.024. [DOI] [PubMed] [Google Scholar]
- 2.Takahashi K, et al. Induction of pluripotent stem cells from adult human fibroblasts by defined factors. Cell. 2007;131:861–872. doi: 10.1016/j.cell.2007.11.019. [DOI] [PubMed] [Google Scholar]
- 3.Zhao T, Zhang ZN, Rong Z, Xu Y. Immunogenicity of induced pluripotent stem cells. Nature. 2011;474:212–215. doi: 10.1038/nature10135. [DOI] [PubMed] [Google Scholar]
- 4.Boyd AS, Wood KJ. Characteristics of the early immune response following transplantation of mouse ES cell derived insulin-producing cell clusters. PLoS One. 2010;5:e10965. doi: 10.1371/journal.pone.0010965. [DOI] [PMC free article] [PubMed] [Google Scholar]
- 5.Nicholls S, et al. Secondary anchor polymorphism in the HA-1 minor histocompatibility antigen critically affects MHC stability and TCR recognition. Proc Natl Acad Sci U S A. 2009;106:3889–3894. doi: 10.1073/pnas.0900411106. [DOI] [PMC free article] [PubMed] [Google Scholar]
- 6.Mullally A, Ritz J. Beyond HLA: the significance of genomic variation for allogeneic hematopoietic stem cell transplantation. Blood. 2007;109:1355–1362. doi: 10.1182/blood-2006-06-030858. [DOI] [PubMed] [Google Scholar]
- 7.Ben-David U, Nudel N, Benvenisty N. Immunologic and chemical targeting of the tight-junction protein Claudin-6 eliminates tumorigenic human pluripotent stem cells. Nat Commun. 2013;4:1992. doi: 10.1038/ncomms2992. [DOI] [PubMed] [Google Scholar]
- 8.Jia F, et al. A nonviral minicircle vector for deriving human iPS cells. Nat Methods. 2010;7:197–199. doi: 10.1038/nmeth.1426. [DOI] [PMC free article] [PubMed] [Google Scholar]
- 9.Meissner A, Wernig M, Jaenisch R. Direct reprogramming of genetically unmodified fibroblasts into pluripotent stem cells. Nat Biotechnol. 2007;25:1177–1181. doi: 10.1038/nbt1335. [DOI] [PubMed] [Google Scholar]
- 10.Huang NF, et al. Embryonic stem cell-derived endothelial cells engraft into the ischemic hindlimb and restore perfusion. Arterioscler Thromb Vasc Biol. 2010;30:984–991. doi: 10.1161/ATVBAHA.110.202796. [DOI] [PMC free article] [PubMed] [Google Scholar]
- 11.Han YM, Guo QL, Zhang MG, Chen ZB, Cao XT. CD69(+)CD4(+)CD25(−) T Cells, a New Subset of Regulatory T Cells, Suppress T Cell Proliferation through Membrane-Bound TGF-beta 1. Journal of Immunology. 2009;182:111–120. doi: 10.4049/jimmunol.182.1.111. [DOI] [PubMed] [Google Scholar]
- 12.Wang T, et al. Regulation of the innate and adaptive immune responses by Stat-3 signaling in tumor cells. Nat Med. 2004;10:48–54. doi: 10.1038/nm976. [DOI] [PubMed] [Google Scholar]
- 13.Welte T, et al. STAT3 deletion during hematopoiesis causes Crohn’s disease-like pathogenesis and lethality: a critical role of STAT3 in innate immunity. Proc Natl Acad Sci U S A. 2003;100:1879–1884. doi: 10.1073/pnas.0237137100. [DOI] [PMC free article] [PubMed] [Google Scholar]
- 14.Kortylewski M, et al. Inhibiting STAT3 signaling in the hematopoietic system elicits multicomponent antitumor immunity. Nat Med. 2005;11:1314–1321. doi: 10.1038/nm1325. [DOI] [PubMed] [Google Scholar]
- 15.Peppa D, et al. Up-regulation of a death receptor renders antiviral T cells susceptible to NK cell-mediated deletion. J Exp Med. 2013;210:99–114. doi: 10.1084/jem.20121172. [DOI] [PMC free article] [PubMed] [Google Scholar]
- 16.Zhang Y, Feng XH, Derynck R. Smad3 and Smad4 cooperate with c-Jun/c-Fos to mediate TGF-beta-induced transcription. Nature. 1998;394:909–913. doi: 10.1038/29814. [DOI] [PubMed] [Google Scholar]
- 17.Rubtsov YP, et al. Regulatory T cell-derived interleukin-10 limits inflammation at environmental interfaces. Immunity. 2008;28:546–558. doi: 10.1016/j.immuni.2008.02.017. [DOI] [PubMed] [Google Scholar]
- 18.Le Texier L, et al. Immunoregulatory function of IL-27 and TGF-beta1 in cardiac allograft transplantation. Transplantation. 2012;94:226–233. doi: 10.1097/TP.0b013e31825b0c38. [DOI] [PMC free article] [PubMed] [Google Scholar]
- 19.Schietinger A, Delrow JJ, Basom RS, Blattman JN, Greenberg PD. Rescued tolerant CD8 T cells are preprogrammed to reestablish the tolerant state. Science. 2012;335:723–727. doi: 10.1126/science.1214277. [DOI] [PMC free article] [PubMed] [Google Scholar]
- 20.Narsinh KH, et al. Single cell transcriptional profiling reveals heterogeneity of human induced pluripotent stem cells. J Clin Invest. 2011;121:1217–1221. doi: 10.1172/JCI44635. [DOI] [PMC free article] [PubMed] [Google Scholar]
- 21.Deaglio S, et al. Adenosine generation catalyzed by CD39 and CD73 expressed on regulatory T cells mediates immune suppression. J Exp Med. 2007;204:1257–1265. doi: 10.1084/jem.20062512. [DOI] [PMC free article] [PubMed] [Google Scholar]
- 22.Perez VL, et al. Induction of peripheral T cell tolerance in vivo requires CTLA-4 engagement. Immunity. 1997;6:411–417. doi: 10.1016/s1074-7613(00)80284-8. [DOI] [PubMed] [Google Scholar]
- 23.Keir ME, Butte MJ, Freeman GJ, Sharpe AH. PD-1 and its ligands in tolerance and immunity. Annual review of immunology. 2008;26:677–704. doi: 10.1146/annurev.immunol.26.021607.090331. [DOI] [PMC free article] [PubMed] [Google Scholar]
- 24.Nurieva RI, et al. The E3 ubiquitin ligase GRAIL regulates T cell tolerance and regulatory T cell function by mediating T cell receptor-CD3 degradation. Immunity. 2010;32:670–680. doi: 10.1016/j.immuni.2010.05.002. [DOI] [PMC free article] [PubMed] [Google Scholar]
- 25.Shembade N, et al. The E3 ligase Itch negatively regulates inflammatory signaling pathways by controlling the function of the ubiquitin-editing enzyme A20. Nat Immunol. 2008;9:254–262. doi: 10.1038/ni1563. [DOI] [PubMed] [Google Scholar]
- 26.Zilberberg J, McElhaugh D, Gichuru LN, Korngold R, Friedman TM. Inter-strain tissue-infiltrating T cell responses to minor histocompatibility antigens involved in graft-versus-host disease as determined by Vbeta spectratype analysis. J Immunol. 2008;180:5352–5359. doi: 10.4049/jimmunol.180.8.5352. [DOI] [PMC free article] [PubMed] [Google Scholar]
- 27.Gagne K, et al. Highly altered V beta repertoire of T cells infiltrating long-term rejected kidney allografts. J Immunol. 2000;164:1553–1563. doi: 10.4049/jimmunol.164.3.1553. [DOI] [PubMed] [Google Scholar]
- 28.Guillet M, et al. Different qualitative and quantitative regulation of V beta TCR transcripts during early acute allograft rejection and tolerance induction. J Immunol. 2002;168:5088–5095. doi: 10.4049/jimmunol.168.10.5088. [DOI] [PubMed] [Google Scholar]
- 29.Dietrich PY, et al. Analysis of T-cell receptor variability in transplanted patients with acute graft-versus-host disease. Blood. 1992;80:2419–2424. [PubMed] [Google Scholar]
- 30.Matsutani T, et al. Restricted usage of T-cell receptor alpha-chain variable region (TCRAV) and T-cell receptor beta-chain variable region (TCRBV) repertoires after human allogeneic haematopoietic transplantation. Br J Haematol. 2000;109:759–769. doi: 10.1046/j.1365-2141.2000.02080.x. [DOI] [PubMed] [Google Scholar]
- 31.Bhattacharya A. On a measure of divergence between two statistical populations defined by their probability distribution. Sankhyā: The Indian Journal of Statistics. 1943;7:401–406. [Google Scholar]
- 32.Kim K, et al. Epigenetic memory in induced pluripotent stem cells. Nature. 2010;467:285–290. doi: 10.1038/nature09342. [DOI] [PMC free article] [PubMed] [Google Scholar]
- 33.Bar-Nur O, Russ HA, Efrat S, Benvenisty N. Epigenetic memory and preferential lineage-specific differentiation in induced pluripotent stem cells derived from human pancreatic islet beta cells. Cell Stem Cell. 2011;9:17–23. doi: 10.1016/j.stem.2011.06.007. [DOI] [PubMed] [Google Scholar]
- 34.Lister R, et al. Hotspots of aberrant epigenomic reprogramming in human induced pluripotent stem cells. Nature. 2011;471:68–73. doi: 10.1038/nature09798. [DOI] [PMC free article] [PubMed] [Google Scholar]
- 35.Cunningham JJ, Ulbright TM, Pera MF, Looijenga LH. Lessons from human teratomas to guide development of safe stem cell therapies. Nat Biotechnol. 2012;30:849–857. doi: 10.1038/nbt.2329. [DOI] [PubMed] [Google Scholar]
- 36.Araki R, et al. Negligible immunogenicity of terminally differentiated cells derived from induced pluripotent or embryonic stem cells. Nature. 2013;494:100–104. doi: 10.1038/nature11807. [DOI] [PubMed] [Google Scholar]
- 37.Guha P, Morgan JW, Mostoslavsky G, Rodrigues NP, Boyd AS. Lack of immune response to differentiated cells derived from syngeneic induced pluripotent stem cells. Cell Stem Cell. 2013;12:407–412. doi: 10.1016/j.stem.2013.01.006. [DOI] [PubMed] [Google Scholar]
- 38.Sun B, Chen M, Hawks CL, Pereira-Smith OM, Hornsby PJ. The minimal set of genetic alterations required for conversion of primary human fibroblasts to cancer cells in the subrenal capsule assay. Neoplasia. 2005;7:585–593. doi: 10.1593/neo.05172. [DOI] [PMC free article] [PubMed] [Google Scholar]
- 39.Woo EY, et al. Regulatory CD4(+)CD25(+) T cells in tumors from patients with early-stage non-small cell lung cancer and late-stage ovarian cancer. Cancer Res. 2001;61:4766–4772. [PubMed] [Google Scholar]
- 40.Blank C, et al. PD-L1/B7H-1 inhibits the effector phase of tumor rejection by T cell receptor (TCR) transgenic CD8+ T cells. Cancer Res. 2004;64:1140–1145. doi: 10.1158/0008-5472.can-03-3259. [DOI] [PubMed] [Google Scholar]
- 41.Baitsch L, et al. Exhaustion of tumor-specific CD8(+) T cells in metastases from melanoma patients. J Clin Invest. 2011;121:2350–2360. doi: 10.1172/JCI46102. [DOI] [PMC free article] [PubMed] [Google Scholar]
- 42.Walker LSK, Abbas AK. The enemy within: Keeping self-reactive T cells at bay in the periphery. Nature Reviews Immunology. 2002;2:11–19. doi: 10.1038/nri701. [DOI] [PubMed] [Google Scholar]
- 43.Kohyama M, et al. Inducible costimulator-dependent IL-10 production by regulatory T cells specific for self-antigen. Proc Natl Acad Sci U S A. 2004;101:4192–4197. doi: 10.1073/pnas.0400214101. [DOI] [PMC free article] [PubMed] [Google Scholar]
- 44.Akkaraju S, et al. A range of CD4 T cell tolerance: partial inactivation to organ-specific antigen allows nondestructive thyroiditis or insulitis. Immunity. 1997;7:255–271. doi: 10.1016/s1074-7613(00)80528-2. [DOI] [PubMed] [Google Scholar]
- 45.Batsford S, et al. Is monitoring of FOXP3 Treg cells in renal transplants during acute cellular rejection episodes useful? Clin Nephrol. 2011;75:101–106. [PubMed] [Google Scholar]
- 46.Miyao T, et al. Plasticity of Foxp3(+) T cells reflects promiscuous Foxp3 expression in conventional T cells but not reprogramming of regulatory T cells. Immunity. 2012;36:262–275. doi: 10.1016/j.immuni.2011.12.012. [DOI] [PubMed] [Google Scholar]
- 47.Carlson CS, et al. Using synthetic templates to design an unbiased multiplex PCR assay. Nat Commun. 2013;4:2680. doi: 10.1038/ncomms3680. [DOI] [PubMed] [Google Scholar]
- 48.Meyer EH, et al. A distinct evolution of the T-cell repertoire categorizes treatment refractory gastrointestinal acute graft-versus-host disease. Blood. 2013;121:4955–4962. doi: 10.1182/blood-2013-03-489757. [DOI] [PMC free article] [PubMed] [Google Scholar]
Associated Data
This section collects any data citations, data availability statements, or supplementary materials included in this article.