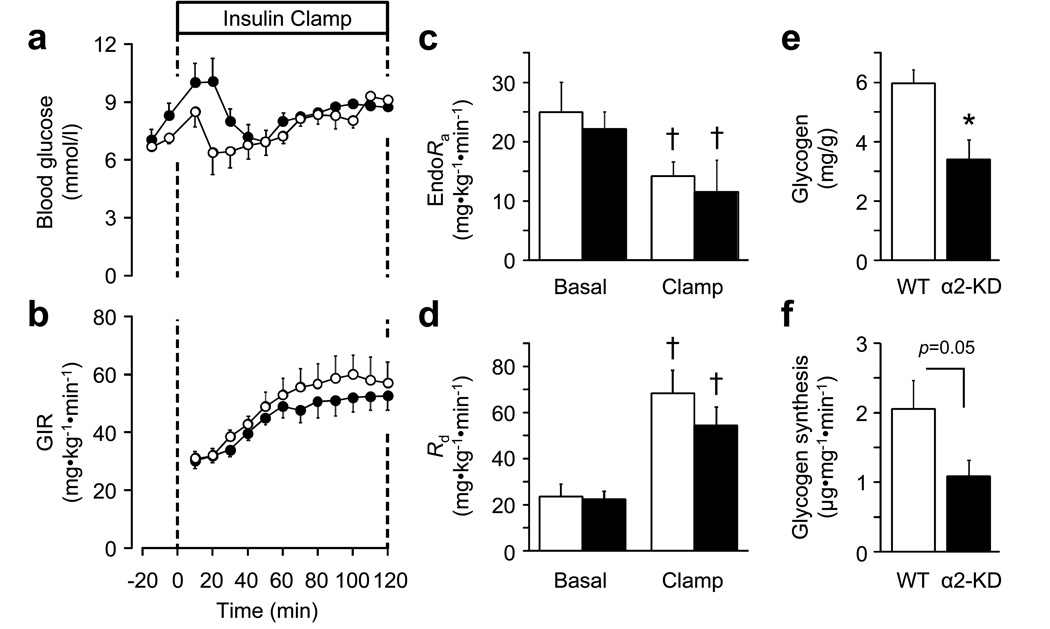
Figure 7.
Blood glucose (a), GIR (b), EndoRa (c) and Rd (d) before (Basal) and in response to an insulin clamp (0 to 120 min) in wild-type (WT) mice (white circles/bars) and mice producing α2-KD in skeletal muscle (black circles/bars). (e) Glycogen levels following the insulin clamp and (f) glycogen synthesis during the insulin clamp. Data are mean±SEM for n=5–6; *p<0.05 vs corresponding WT value; †p<0.05 vs Basal; ‡p=0.05

