Abstract
One in six males will develop prostate cancer during their lifetime. Prostate cancer is the second leading cause of cancer death in American males, behind only lung cancer. Unfortunately, even though this disease is so common, clinical screening methods such as prostate-specific antigen test and transrectal ultrasound-guided prostate biopsy lack sensitivity and specificity in diagnosing prostate cancer. In recent years, multiparametric prostate MRI has emerged as a very important tool in the diagnosis of prostate carcinoma with a high accuracy. However, diagnostic difficulty is often encountered even with an experienced abdominal radiologist. That is mainly because many normal and abnormal entities can mimic prostate carcinoma at multiparametric MRI. Therefore, the purpose of this pictorial review is to discuss the usefulness of multiparametric prostate MRI in the diagnosis of prostate carcinoma, emphasizing the key MRI features that help to make a distinction of prostate carcinoma from its mimics.
Although recent advances in multiparametric prostate MRI have significantly improved the accuracy in the diagnosis of prostate MRI,1–3 a wide variety of normal and abnormal entities still mimic prostate cancer at multiparametric MRI (Mp-MRI) creating diagnostic challenges. These mimics include, but are not limited to: chronic prostatitis; a hypertrophic nodule in the peripheral zone or in the central gland; focal changes related to prior exposure to radiation; normal displaced central zone; pseudolesion at the midline of peripheral zone; and granulomatous prostatitis. Recognition of the MR features of prostate carcinoma and its mimics at Mp-MRI, along with findings that help to differentiate these mimics from prostate carcinoma, is important in establishing a correct diagnosis and in guiding clinical management.
PROSTATE CANCER IN PATIENTS WITHOUT PRIOR TREATMENT
The MRI features of prostate cancer might vary significantly based on location, prior treatment, and volume and grade of cancer (Table 1).3 Generally speaking, high-grade cancers have more typical MR features than low-grade cancers.3–5 In 2012, in order to provide guidelines for Mp-MRI, a prostate imaging reporting and data system (PI-RADS) scoring system for structured reporting was introduced by the European Society of Urogenital Radiology.5 The system is beneficial in that it indicates the likelihood of a suspicious lesion on Mp-MRI being prostate cancer and thereby enhances the clinical relevance of Mp-MRI.
Table 1.
Typical MR features of prostate cancer
| Prostate cancer | Typical MR features |
|---|---|
| Peripheral zone PCa | A low T2 signal intensity mass; diffusion restriction (most important), often correlating with Gleason score; early contrast wash-in and wash-out, and elevated choline peaks |
| Transitional zone PCa | At T2 weighted imaging (most important), an area with homogeneous low signal intensity, ill-defined margins, lenticular shape, absence of a capsule and invasion of the anterior fibromuscular stroma; diffusion restriction with ill-defined margins; asymmetric rapid contrast wash-in and wash-out, and elevated choline peaks |
| Recurrent PCa post radiation | A mass-like nodule or a crescentic subcapsular focus of low T2 signal intensity; diffusion restriction; early enhancement with rapid wash-out (very important), and elevated choline levels and absence of citrate peaks |
| Recurrent PCa post prostatectomy | A slightly higher signal intensity mass than that of adjacent musculature at T2 weighted imaging; probably lack of diffusion restriction; rapid contrast wash-in and wash-out of the mass (most important) |
PCa, prostate cancer.
Peripheral zone cancer
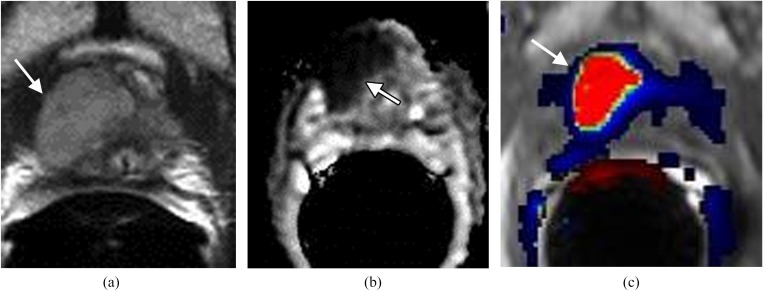
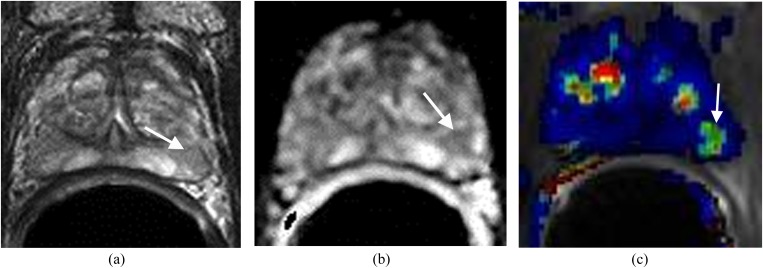
Typical prostate carcinoma in the peripheral zone manifests at Mp-MRI as a low signal intensity focus at T2 weighted imaging (T2WI) and apparent diffusion coefficient (ADC) map, elevated choline peaks at MR spectroscopy (MRSI), and focal enhancement with early contrast wash-in and wash-out at dynamic contrast-enhanced imaging (DCE).1,2 If the lesion has each of these MR features (Figure 1), the diagnosis of prostate cancer is almost certain. At T2WI, prostate carcinoma tends to have a low T2 signal intensity with mass effect on the adjacent prostate capsule and normal prostate tissue.5 The ADC value correlates with prostate cancer Gleason score such that lower ADC values correlate with higher Gleason scores (Figure 1b).1 If the ADC map is normal in an untreated prostate, prostate carcinoma is unlikely even if T2WI with DCE or MRSI is suggestive of carcinoma. Typically, an early and avidly enhancing lesion with rapid wash-out at the peripheral zone is highly suggestive of prostate carcinoma (Figure 1c).2,5 If the enhancing lesion exhibits >20% wash-out of contrast during the 4-min time interval after the administration of intravenous contrast, the lesion will be red on most available DCE images after software processing. If there are at least two adjacent voxels with elevated choline peaks, suspicion for prostate cancer should also be high.5
Figure 1.
Large lesion in the right side of the apex in a patient with prostrate-specific antigen of 27 ng ml−1. (a) Axial T2 weighted imaging shows a large well-defined mass in the right side of the apex (arrow). (b) Apparent diffusion coefficient (ADC) map demonstrates the mass with low ADC value (arrow). (c) Dynamic contrast-enhanced imaging shows the mass (arrow) with rapid contrast wash-in and wash-out (red). Surgery confirmed carcinoma Gleason score 8.
Transitional zone cancer
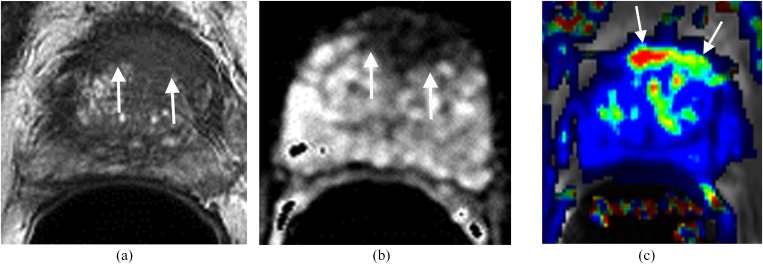
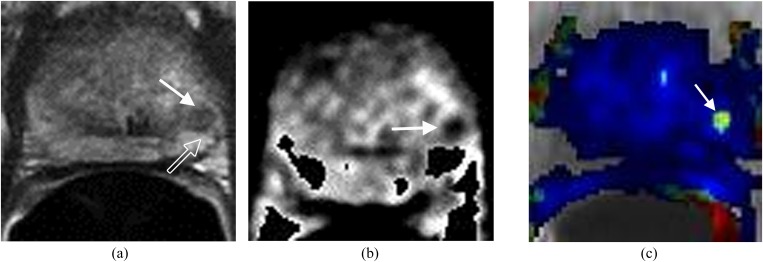
Prostate cancer at the transitional zone (TZ) is more challenging to detect and diagnose because the MR signal intensity characteristics of a normal TZ and carcinoma often overlap.4–6 Previously, MRI was considered inadequate in the evaluation of TZ carcinomas. However, with recent advances of prostate Mp-MRI, the accuracy in diagnosing TZ cancer has improved significantly (Figure 2). The imaging features of TZ carcinoma at T2WI include an area with homogeneous low signal intensity, ill-defined margins, lenticular shape, absence of a capsule and invasion of the anterior fibromuscular stroma (Figure 2a).4–6 Asymmetric rapid contrast wash-in and wash-out, low ADC values (Figure 2b,c) and elevated choline peaks are also features suggestive of TZ carcinoma, although none is pathogonomonic.5,6
Figure 2.
Lesion in the anterior transitional zone (TZ). The patient had four prior negative transrectal ultrasound prostate biopsies and prostate-specific antigen of 17 ng ml−1. (a) Axial T2 weighted imaging shows a homogeneous low signal mass with indistinct margins (erased charcoal sign) (arrows) in the anterior aspect of the TZ. (b) Apparent diffusion coefficient shows the mass with low signal intensity (arrows). (c) Dynamic contrast-enhanced imaging demonstrates the lesion with rapid contrast wash-in and wash-out (arrows). MRI-guided biopsy confirmed prostate carcinoma Gleason score 9.
RECURRENT PROSTATE CANCER IN PATIENTS FOLLOWING RADIATION THERAPY
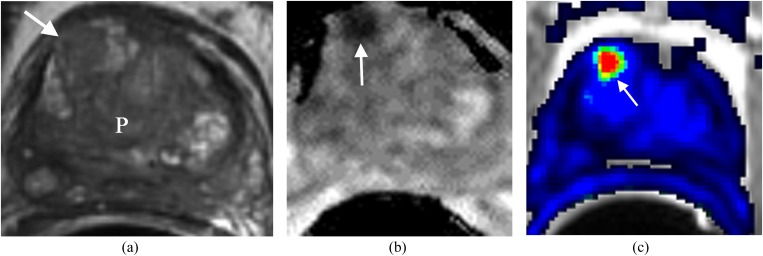
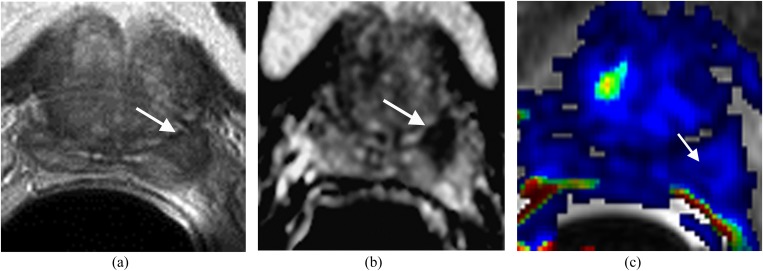
Early diagnosis of recurrent prostate carcinoma after radiation therapy is important because it might affect patient outcome.7 Standard T2WI of the irradiated prostate may be limited by the post-treatment loss of zonal anatomy and diffuse low T2 signal, which hinder tumour detection (Figure 3).7 Mp-MRI improves the detection of recurrent carcinoma in this setting.7,8 At T2WI, a mass-like nodule or a crescentic subcapsular focus of low T2 signal intensity may be seen in the peripheral zone. Recurrent carcinoma demonstrates low signal intensity on the ADC map and early enhancement with rapid wash-out at DCE (Figure 3b,c).7,8 MRSI might add valuable information supportive of recurrent carcinoma as evidenced by elevated choline levels and absence of citrate.7 In the setting of prior internal radiation seed placement, DCE may be the single most important sequence in diagnosing recurrence since T2WI, ADC map and MRSI are usually degraded.
Figure 3.
Recurrent prostate (P) cancer in the anterior aspect of right side of the central gland. The patient status is post external radiation treatment with a recent elevation of prostate-specific antigen to 3.1 ng ml−1 and negative transrectal ultrasound biopsy. (a) Axial T2 weighted imaging demonstrates a focal low signal area in the anterior aspect of right side of the central gland (arrow), not significantly different from the rest of P in terms of low T2 signal intensity. (b) Apparent diffusion coefficient (ADC) map demonstrates the area with very low ADC value (arrow). (c) Dynamic contrast-enhanced imaging demonstrates the area in the anterior aspect of the right side of the central gland with rapid contrast wash-in and wash-out (arrow). This is concerning for prostate cancer. MRI-guided biopsy confirmed recurrent prostate cancer Gleason score 7.
RECURRENT CANCER IN PATIENTS FOLLOWING PROSTATECTOMY
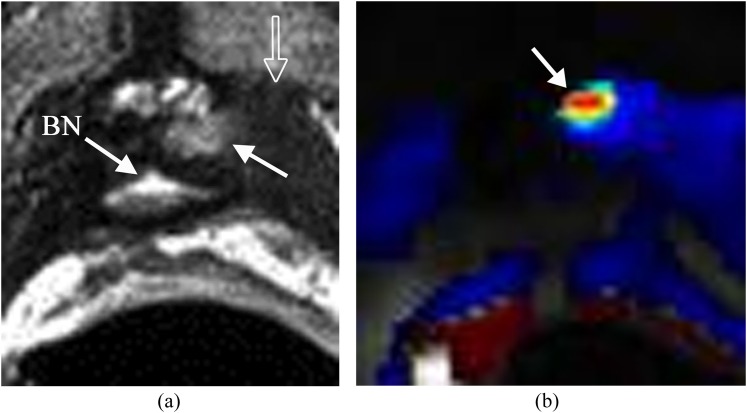
Recurrent prostate cancer in the surgical bed following radical prostatectomy is common. Early detection of focal recurrence is crucial as the recurrence can be effectively treated with external radiation. Recurrent carcinoma demonstrates slightly higher signal intensity than that of adjacent musculature on T2WI (Figure 4).6 DCE is the most important parameter in the setting of recurrence as the majority of recurrences will show rapid contrast wash-in and wash-out (Figure 4b).8 If the abnormal enhancing focus with wash-out is seen in the surgical bed with a corresponding high T2 soft tissue density, the diagnosis of focal recurrence can be made with confidence.
Figure 4.
Small recurrence in the left side of the prostate surgical bed. The patient's status is post radical prostatectomy with a recent elevation of prostate-specific antigen to 0.21 ng ml−1. (a) Axial T2 weighted imaging shows a small mass with slightly high T2 signal (solid arrow) relative to the adjacent muscle (open arrow) in the left side of the prostate surgical bed. Bladder neck (BN) is noted. (b) Dynamic contrast-enhanced imaging shows the lesion with rapid contrast wash-in and wash-out (arrow) consistent with focal recurrence.
CHRONIC PROSTATITIS
Chronic prostatitis might mimic prostate cancer at Mp-MRI with low T2 signal intensity at T2WI, mild diffusion restriction on the ADC map, decreased citrate peaks and elevated choline peaks, and significant contrast wash-in and wash-out at DCE (Figure 5).9,10 However, in most instances, chronic prostatitis can be differentiated from prostate cancer: first, the low T2 signal intensity area in chronic prostatitis usually does not produce a contour deformity or mass effect on the adjacent normal prostate tissue or capsule (Figure 5a);10 second, the degree of low T2 signal intensity and diffusion restriction is often less than that seen in prostate carcinoma (Figure 5a,b); finally, at DCE, the area involved by chronic prostatitis might demonstrate symmetric and less rapid contrast wash-in and wash-out (Table 2) (Figure 5c).
Figure 5.
Focal chronic prostatitis in the left side of the peripheral zone. The patient had negative transrectal ultrasound (TRUS) prostate biopsy with an elevation of prostate-specific antigen to 8.1 ng ml−1. (a) Axial T2 weighted imaging shows a mildly low T2 signal focus (arrow) in the left side of the peripheral zone. (b) Apparent diffusion coefficient (ADC) map shows the focus with mildly a decreased ADC value (arrow). (c) Dynamic contrast-enhanced imaging shows bilateral symmetric enhancement (arrow). MRI-guided prostate biopsy confirmed chronic prostatitis.
Table 2.
Key MR features that will help in differentiating the mimics of prostate cancer
| Mimics of prostate cancer | Helpful features in differentiation |
|---|---|
| Chronic prostatitis | No contour deformity or mass effect on the adjacent normal prostate tissue or capsule; the degree of low T2 signal intensity and diffusion restriction is often less than that seen in prostate carcinoma; mild contrast wash-in and wash-out |
| Hypertrophic nodule in the peripheral zone or central gland | Well-defined margins; rounded or spherical in shape; symmetric rapid contrast wash-in and wash-out in both lobes |
| Focal changes related to the prior radiation | Lack of significant diffusion restriction; no rapid contrast wash-in and wash-out; no elevation of choline peaks at MRSI |
| Normal displaced central zone | No or minimal rapid contrast wash-in and wash-out; typical location—base of the prostate; commonly symmetric |
| Pseudolesion at the midline of the peripheral zone | Midline location; concave contour; lack of rapid contrast wash-in and wash-out |
| Granulomatous prostatitis | A large area of the lesion showing no enhancement owing to necrosis |
MRSI, MR spectroscopy.
HYPERTROPHIC NODULE IN THE PERIPHERAL ZONE
A hypertrophic nodule might appear in the peripheral zone as a low T2 signal focus mimicking prostate cancer. Such nodules might also demonstrate diffusion restriction, rapid contrast wash-in and wash-out (Figure 6), and elevated choline peaks resulting in a diagnostic challenge.10 However, the hypertrophic nodule is usually well defined and often does not extend to the capsule at T2WI (Figure 6a). The nodule might have the same imaging features as the adjacent central gland since most of these nodules arise from the central gland. In addition, normal prostate tissue between the nodule and the capsule is often present (Figure 6a).
Figure 6.
Hypertrophic nodule in the left side of the midline of the peripheral zone mimicking prostate carcinoma in a patient with prostate-specific antigen to 9.1 ng ml−1. (a) Axial T2 weighted imaging shows a well-defined low signal lesion in the left side of the midline of the peripheral zone (solid arrow). The open arrow indicates a layer of normal prostate tissue between the lesion and capsule. (b) Apparent diffusion coefficient (ADC) map shows low ADC value of the lesion (arrow). (c) Dynamic contrast-enhanced imaging shows contrast rapid wash-in and wash-out of the lesion (arrow). MRI-guided biopsy confirmed benign prostate tissue.
HYPERTROPHIC NODULE IN THE CENTRAL GLAND
Hypertrophic nodules are very common in the central gland and can mimic central gland carcinoma.6 They are composed of two histologically distinct types of tissue: glandular tissue, which is hyperintense, and stromal tissue, which is hypointense at T2WI.10–12 Generally speaking, a benign hypertrophic nodule might have a heterogeneous T2 signal intensity, a well-defined capsule and a normal ADC value. When a benign nodule has a homogeneous low T2 signal intensity and low ADC value with rapid contrast wash-in and wash-out, the distinction from prostate cancer is very difficult. The clues in making the distinction from prostate cancer include well-defined margins,10 symmetric contours, symmetric rapid contrast wash-in and wash-out (Figure 7), and a normal MRSI.
Figure 7.
Hypertrophic nodule in the right side of the central gland mimicking prostate carcinoma in a patient with prostate-specific antigen to 11.1 ng ml−1. (a) Axial T2 weighted imaging shows a homogeneous low signal area in the right side of the central gland (arrow). (b) Apparent diffusion coefficient (ADC) map shows the area with very low ADC value (arrow). (c) Dynamic contrast-enhanced imaging demonstrates rapid contrast wash-in and wash-out of the area (solid arrow). Open arrow indicates a similar enhancement in the left central gland. MRI-guided biopsy confirmed no cancer.
FOCAL CHANGES RELATED TO PRIOR RADIATION
Radiotherapy-related changes of the prostate include low T2 signal intensity of the gland and an indistinctness of the normal zonal anatomy caused by glandular atrophy and fibrosis.7,13 If these changes are not diffusely and evenly distributed, MR features of these changes might mimic focal recurrence, particularly on T2WI. Furthermore, recurrent prostate cancer might have the same low T2 signal intensity as the rest of the irradiated gland, limiting the utility of T2WI (Figure 3).13 Fortunately, functional prostate MRI (diffusion, DCE and MRSI) often provides valuable diagnostic information. Diffusion restriction, rapid contrast wash-in and wash-out (Figure 3), and elevated choline peaks with invisible citrate peaks7 may be present in recurrent prostate carcinoma. Asymmetric enhancement in the peripheral zone or central gland (Figure 3c) may be the only clue to suggest recurrence in some cases.
NORMAL DISPLACED CENTRAL ZONE
The central zone surrounds the ejaculatory ducts and is located posterior to the TZ and urethra, and proximal to the verumontanum. The most common MRI features of the central zone are symmetrical appearance on either side of the verumontanum on all sequences and homogeneous low signal intensity on T2WI and ADC maps.10 When the TZ is hypertrophic it extends superiorly from the verumontanum and compresses and displaces the central zone superiorly and laterally to the base, just inferior to the seminal vesicles.10 If this process results in asymmetry of the central zone, prostate carcinoma may be suspected since the central zone has low signal intensity at T2WI and ADC maps (Figure 8). MR spectroscopy is unlikely to be helpful in this setting, as metabolite contamination from the adjacent seminal vesicles is known to elevate choline peaks at the bases mimicking prostate cancer. The only clue to differentiate cancer from the central zone may be that the central zone demonstrates no or minimal rapid enhancement at DCE (Figure 8c).
Figure 8.
Displaced central zone in the left side of the base mimicking prostate carcinoma in a patient with elevated prostate-specific antigen to 12 ng ml−1 and three negative transrectal ultrasound–guided prostate biopsies. (a) T2 weighted imaging shows a well-defined low signal area in the left side of the base (arrow). (b) Apparent diffusion coefficient (ADC) map shows the decreased ADC value of the area (arrow). (c) Dynamic contrast-enhanced imaging shows no significant contrast wash-in and wash-out of the area (arrow). MRI-guided biopsy confirmed normal prostate tissue.
PSEUDOLESION AT THE MIDLINE OF THE PERIPHERAL ZONE
At the midline of the peripheral zone of the prostate, a low T2 signal intensity focus may be identified that might show diffusion restriction mimicking prostate cancer (Figure 9). It is believed that fusion of the prostatic capsule and fascia in this region is responsible for the low T2 signal and ADC value.14 Key MRI clues for differentiating this focus from carcinoma include its midline location, concave contour (Figure 9a) and lack of rapid enhancement with wash-out (Figure 9c).
Figure 9.
Pseudolesion at the midline of the peripheral zone. The patient had elevated prostate-specific antigen to 8 ng ml−1 with multiple negative transrectal ultrasound biopsies. (a) Axial T2 shows a low T2 signal intensity region at the midline of the peripheral zone at the level of the mid-gland (arrow). (b) Apparent diffusion coefficient (ADC) map shows low ADC value of the region (arrow). (c) Dynamic contrast-enhanced imaging demonstrates no enhancement with wash-out of the region (arrow). MRI-guided biopsy confirmed no cancer.
GRANULOMATOUS PROSTATITIS
Granulomatous prostatitis is an uncommon inflammatory process in the prostate that manifests as a clinically firm nodule with elevated prostate-specific antigen, mimicking prostate cancer. The entity might appear as a discrete mass with significantly low T2 signal intensity and ADC. However, owing to an extensive area of lesion necrosis, the portion of non-enhancement may be large, which provides a clue for the differentiation from prostate cancer.10
REFERENCES
- 1.Vargas HA, Akin O, Franiel T, Mazaheri Y, Zheng J, Moskowitz C, et al. Diffusion-weighted endorectal MR imaging at 3 T for prostate cancer: tumor detection and assessment of aggressiveness. Radiology 2011; 259: 775–84. doi: 10.1148/radiol.11102066 [DOI] [PMC free article] [PubMed] [Google Scholar]
- 2.Somford DM, Fütterer JJ, Hambrock T, Barentsz JO. Diffusion and perfusion MR imaging of the prostate. Magn Reson Imaging Clin N Am 2008; 16: 685–95. doi: 10.1016/j.mric.2008.07.002 [DOI] [PubMed] [Google Scholar]
- 3.Kirkham APS, Haslam P, Keanie JY, McCafferty I, Padhani AR, Punwani S, et al. Prostate MRI: who, when, and how? Report from a UK consensus meeting. Clin Radiol 2013; 68: 1016–23. doi: 10.1016/j.crad.2013.03.030 [DOI] [PubMed] [Google Scholar]
- 4.Akin O, Sala E, Moskowitz CS, Kuroiwa K, Ishill NM, Pucar D, et al. Transition zone prostate cancers: features, detection, localization, and staging at endorectal MR imaging. Radiology 2006; 239: 784–92. doi: 10.1148/radiol.2392050949 [DOI] [PubMed] [Google Scholar]
- 5.Barentsz JO, Richenberg J, Clements R, Choyke P, Verma S, Villeirs G, et al. ESUR prostate MR guidelines 2012. Eur Radiol 2012; 22: 746–57. doi: 10.1007/s00330-011-2377-y [DOI] [PMC free article] [PubMed] [Google Scholar]
- 6.Chesnais AL, Niaf E, Bratan F, Mége-Lechevallier FM, Roche S, Rabilloud M, et al. Differentiation of transitional zone prostate cancer from benign hyperplasia nodules: evaluation of discriminant criteria at multiparametric MRI. Clin Radiol 2013; 68: 323–30. doi: 10.1016/j.crad.2013.01.018 [DOI] [PubMed] [Google Scholar]
- 7.Westphalen AC, Coakley FV, Roach M, McCulloch CE, Kurhanewicz J. Locally recurrent prostate cancer after external beam radiation therapy: diagnostic performance of 1.5-T endorectal MR imaging and MR spectroscopic imaging for detection. Radiology 2010; 256: 485–92. doi: 10.1148/radiol.10092314 [DOI] [PMC free article] [PubMed] [Google Scholar]
- 8.Vargas HA, Wassberg C, Akin O, Hricak H. MR imaging of treated prostate cancer. Radiology 2012; 262: 26–42. doi: 10.1148/radiol.11101996 [DOI] [PMC free article] [PubMed] [Google Scholar]
- 9.Shukla-Dave A, Hricak H, Eberhardt SC, Olgac S, Muruganandham M, Scardino PT, et al. Chronic prostatitis: MR imaging and 1H MR spectroscopic imaging findings—initial observations. Radiology 2004; 231: 717–24. doi: 10.1148/radiol.2313031391 [DOI] [PubMed] [Google Scholar]
- 10.Rosenkrantz AB, Taneja SS. Radiologist, be aware: ten pitfalls that confound the interpretation of multiparametric prostate MRI. AJR Am J Roentgenol 2014; 202: 109–20. doi: 10.2214/AJR.13.10699 [DOI] [PubMed] [Google Scholar]
- 11.Schiebler ML, Tomaszewski JE, Bezzi M, Pollack HM, Kressel HY, Cohen EK, et al. Prostatic carcinoma and benign prostatic hyperplasia: correlation of high-resolution MR and histopathologic findings. Radiology 1989; 172: 131–7. [DOI] [PubMed] [Google Scholar]
- 12.Sato C, Naganawa S, Nakamura T, Kumada H, Miura S, Takizawa O, et al. Differentiation of noncancerous tissue and cancer lesions by apparent diffusion coefficient values in transition and peripheral zones of the prostate. J Magn Reson Imaging 2005; 21: 258–62. doi: 10.1002/jmri.20251 [DOI] [PubMed] [Google Scholar]
- 13.Akin O, Gultekin DH, Vargas HA, Zheng J, Moskowitz C, Pei X, et al. Incremental value of diffusion weighted and dynamic contrast enhanced MRI in the detection of locally recurrent prostate cancer after radiation treatment: preliminary results. Eur Radiol 2011; 21: 1970–8. [DOI] [PMC free article] [PubMed] [Google Scholar]
- 14.Kiyoshima k, Yokomizo A, Yoshida T, Tomita K, Yonemasu H, Nakamura M, et al. Anatomical features of periprostatic tissue and its surroundings: a histological analysis of 79 radical retropubic prostatectomy specimens. J Clin Oncol 2004; 34: 463–8. [DOI] [PubMed] [Google Scholar]


