Abstract
Dynamic estimates of mean systemic pressure based on a Guytonian analog model (Pmsa) appear accurate under baseline conditions but may not remain so during septic shock because blood volume distribution and resistances between arterial and venous beds may change. Thus, we examined the effect of acute endotoxemia on the ability of Pmsa, estimated from steady-state cardiac output, right atrial pressure, and mean arterial pressure, to reflect our previously validated instantaneous venous return measure of mean systemic pressure (Pmsi), derived from beat-to-beat measures of right ventricular stroke volume and right atrial pressure during positive pressure ventilation. We studied 6 splenectomized pentobarbital-anesthetized close chested dogs. Right ventricular stroke volume was measured by a pulmonary arterial electromagnetic flow probe. Instantaneous venous return measure of mean systemic pressure and Pmsa were calculated during volume loading and removal (±100-mL bolus increments ×5) both before (control) and 30 minutes after endotoxin infusion (endo). Cardiac output increased (2628 ± 905 vs 3560 ± 539 mL/min; P < .05) and mean arterial pressure decreased (107 ± 16 vs 56 ± 12 mm Hg; P < .01) during endo. Changes in Pmsi and Pmsa correlated during both control and endo (r2 = 0.7) with minimal bias by Bland-Altman analysis (mean difference ± 95% confidence interval, 0.47 ± 5.04 mm Hg). We conclude that changes in Pmsa accurately tracts Pmsi under both control and endo.
Keywords: Hemodynamic monitoring, Effective circulating blood volume, Canine model, Heart-lung interactions, Endotoxemia mechanical ventilation
1. Introduction
The accurate assessment of cardiovascular state in the critically ill is difficult because easily measured hemodynamic variables, such as blood pressure and cardiac output (CO), can coexist with different levels of ventricular pump function, vasomotor tone, and effective circulating blood volume. Although fluid resuscitation therapy is important in the management of unstable patients, excessive fluid resuscitation can be harmful in acute lung injury [1], head injury [2], and postoperative patients [3]. Thus, a measure of effective volume status and its change in response to therapy is useful to avoid volume overload because even volume-overloaded patients may remain volume responsive.
Mean systemic pressure (Pms) is a direct measure of the effective circulating blood volume, being dependent on absolute blood volume, systemic vascular compliance, and unstressed vascular volume, all of which may change rapidly in the critically ill patient. Operationally, Pms is the pressure anywhere in the circulation during circulatory arrest and is the upstream pressure driving venous return [4]. We have previously shown that Pms can be measured in ventilator-dependent animals during positive pressure breathing plotting right ventricular stroke volume (SVRV) to right atrial pressure (Pra) extrapolating to zero SVRV [5] and in patients using inspiratory hold maneuvers defining Pra/CO data pairs extrapolating to zero CO [6]. This calculated Pms parameter accurately follows changes in intravascular volume in dogs under baseline and endotoxic conditions [5,7] and in postoperative cardiac surgery patients [6]. Unfortunately, beat-to-beat measures of SVRV require accurate measures of instantaneous pulmonary blood flow, and inspiratory hold technique maneuvers require several minutes to complete the multiple steps in a sedated and ventilated patient. Thus, these techniques are not readily applicable to frequent sequential measures in critically ill patients.
Other more simple methods have been proposed to estimate Pms at the bedside. Anderson [8] hypothesized that the circulation of the arm behaves similar to total systemic circulation during steady-state conditions with venous flow behaving as if its upstream pressure is Pms. Accordingly, transient stop-flow forearm arterial and venous equilibrium pressure was referred to as arm equilibrium pressure (Parm). This technique has the advantage of being simpler than the inspiratory hold technique but still can be measured only intermittently. Similarly, Parkin and Leaning [9] proposed to estimate effective circulatory volume based on an electrical analog simplification of Guytonian circulatory physiology estimating mean circulatory pressure (Pmsa) from directly measured Pra, mean arterial pressure (MAP), and CO. We recently compared the measures of Pms using inspiratory hold, Parm and Pmsa, to each other in 16 postoperative surgical patients [10]. We saw that inspiratory hold–derived Pms and Parm were similar but that Pmsa displayed a systematic bias, which could be corrected for. Importantly, Pmsa changes faithfully tracked Pms changes in response to fluid challenges independent of this bias. Because Pmsa can be calculated continuously if CO, MAP, and Pra are continuously monitored, it offers the potential to have a continuous online assessment of effective circulatory blood volume, cardiac performance, and vasomotor tone, the 3 primary determinants of cardiovascular state.
We hypothesized that Pmsa would accurately track instantaneous venous return measure of mean systemic pressure (Pmsi) under baseline conditions but may become imprecise following the induction of endotoxic shock because of the recently documented changes in peripheral vascular compliance during the induction of acute endotoxic shock [11]. Thus, we compared the ability of Pmsa to track Pmsi using our previously acquired and validated data from an intact canine model during fluid volume and removal before and after the endotoxin of acute endotoxemia.
2. Methods
We performed a retrospective analysis of the high-quality hemodynamic data from a subset of 6 mongrel dogs used in a previous publication from our group [7]. Those data sets allowed the calculation of Pmsi and Pmsa during each volume loading/removal step and before and during acute endotoxemia. The details of the surgical procedure and data collection have been previously described and validated by us [5,7]. Briefly, after approval by our Institutional Animal Care and Use Committee, 6 mongrel dogs were anesthetized with intravenous pentobarbital sodium (30 mL/kg) and intubated with a 9.0-mm ID cuffed endotracheal tube equipped with a distal port to measure airway pressure. Intermittent positive pressure ventilation was accomplished by a constant volume (10 mL/kg) ventilator (Harvard Apparatus, Cambridge, MA) with enriched inspired O2. Following a midline sternotomy, a calibrated electromagnetic flow probe (Carolina Medical, East Bend, NC) was placed around the main pulmonary artery to measure SVRV. Fluid-filled arterial, left atrial, and pulmonary artery catheters and a pleural air-filled balloon catheter were inserted allowing continuous measures of all vascular pressures both absolute and relative to pleural pressure (transmural pressure). The pericardium and chest were then closed in multiple layers. Following a 30-minute recovery period during which time there were no episodes of cardiovascular instability, arrhythmias, or excessive blood loss through the bilateral chest tubes (ie, <50 mL/h), the protocol was started.
2.1. Protocol
The protocol consisted of noting the effects of intermittent positive pressure ventilation (tidal volume, 10 mL/kg) on dynamic changes in SVRV and Pra values across conditions as well as end-expiratory steady-state MAP, CO, and Pra values 5 minutes after each volume challenge or removal. Intravascular volume (0.9 N NaCl) was loaded in 100-mL increments up to a total administration of 500 mL and then removed as whole blood in 100-mL decrements. This maneuver was performed during the hemodynamically stable postoperative state (control) and after induction of a stable endotoxic state (endo). Acute endotoxemia was induced by an infusion of Escherichia coli lipopolysaccharide (endotoxin) (1 mg/kg) (single lot, 055:B5; Sigma Laboratories, St. Louis, MO) over a 5-minute period through the left atrial catheter. Fluid resuscitation with dextran (6% wt/vol) in 50-mL boluses was performed as necessary if end-expiratory SVRV decreased to less than 50% control or MAP decreased to less than 50 mm Hg. Postendotoxin fluid requirements during this acute resuscitation interval varied widely across animals. All animals were stable following this resuscitation before starting the endo volume challenges.
2.2. Data analysis
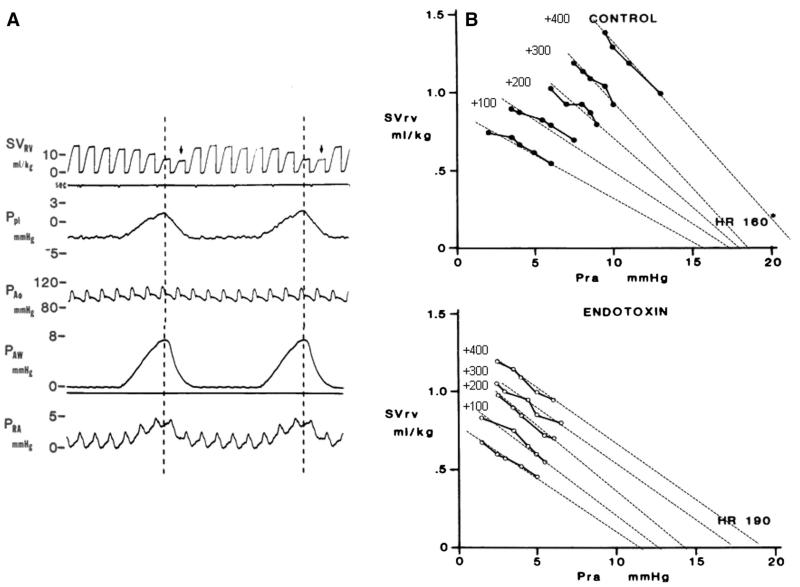
Airway pressure, pleural pressure, and all vascular pressures and SVRV were simultaneously recorded (Gould, Cleveland, OH). Right ventricular stroke volume was displayed as the integrated flow signal zeroed with each QRS allowing display of beat-to-beat SVRV. For construction of the instantaneous venous return curves, multiple SVRV and Pra data pairs were collected over 3 breaths for data associated with changing SVRV from apneic baseline. Instantaneous venous return measure of Pms was estimated as the Pra value of the SVRV to Pra relation, as previously described and validated by us in this model as the zero SVRV Pra intercept from a linear regression of the SVRV to Pra relation. In this study, we found the 95% confidence interval for the x-axis intercept to be less than 1 mm Hg for all volumetric conditions except the maximal fluid load where it increased to 2 mm Hg. An example of the raw data and the calculation of Pmsi for 1 animal during volume loading for control and endo is illustrated in Fig. 1. The Pmsa estimate [9] uses a mathematical model of the systemic circulation comprising compliant arterial and venous compartments and resistances to blood flow. The model parameters are adjusted to match those of the patient’s current measured variables, such that Pmsa = a × Pcv + b × Pa + c × CO, where a and b are dimensionless constants (a + b = 1, typically a = 0.96, b = 0.04) and c has the dimensions of resistance and is function of subject’s height, weight, and age.
Fig. 1.
A, A section of a strip chart recording of the SVRV, pleural pressure, aortic pressure, airway pressure, and Pra for 1 animal during 2 sequential positive pressure breaths. The vertical dotted lines and arrows illustrate the phase lag used to match Pra to SVRV with the dotted line being the Pra point and the subsequent SVRV its corresponding value. B, The summary SVRV and Pra data pars for a series of volume loading steps and their extrapolated linear regression lines to zero SVRV for 1 animal during control and acute endotoxin infusion states. Note that during endo, the HR is higher and the venous return slopes less steep (increased resistance) than control. Ppl indicates pleural pressure; PAo, aortic pressure; PAW, airway pressure.
We assumed the animal’s age to be equal to 15 human years and height to 250 cm. Weight was measured immediately before surgery. These arbitrary age and height values were taken from the initial studies of Parkin and Leaning [9] in similar canine models.
Continuous variables are reported as mean ± SD. Comparisons were made between Pmsi and Pmsa across subjects; volume loading and control to endo by a repeated-measures analysis of variance and stepwise changes in Pms estimates with volume loading and removal were compared by analysis of covariance. Agreement between Pmsi and Pmsa for both control and endo was also analyzed by Bland-Altman analyses.
3. Results
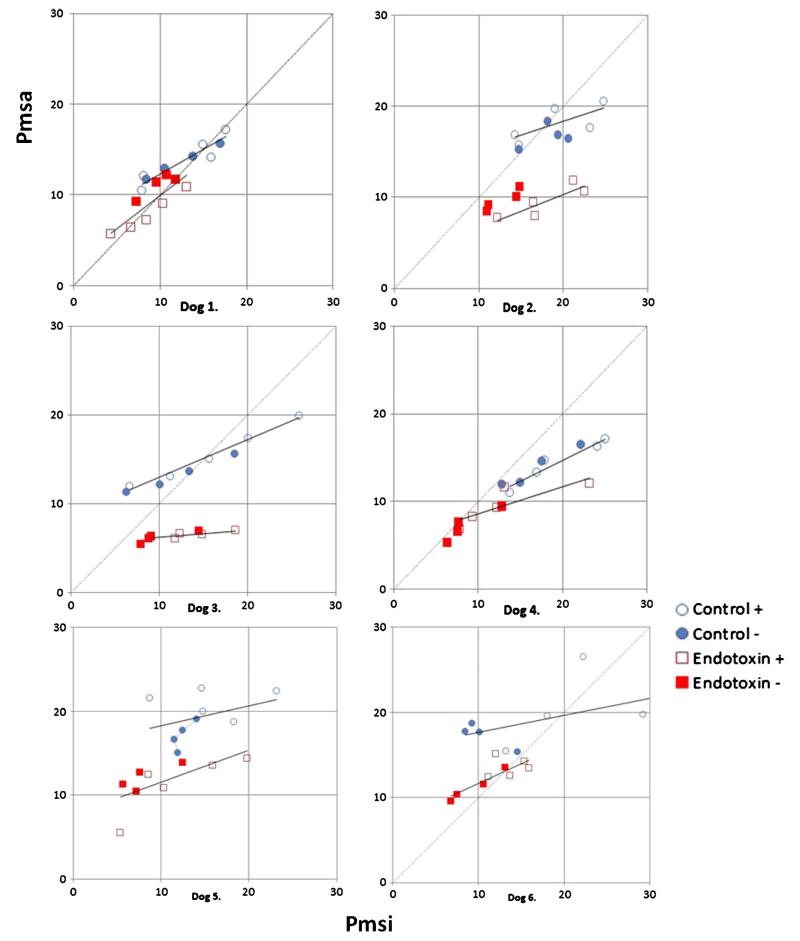
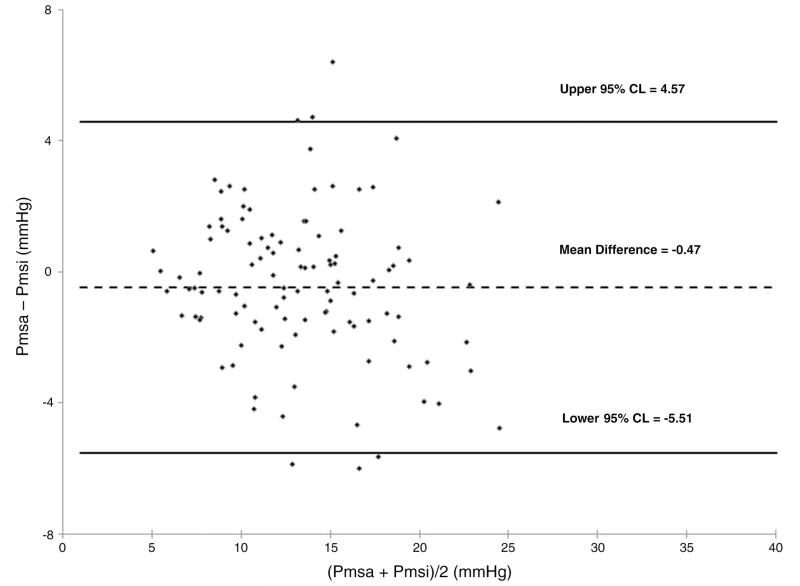
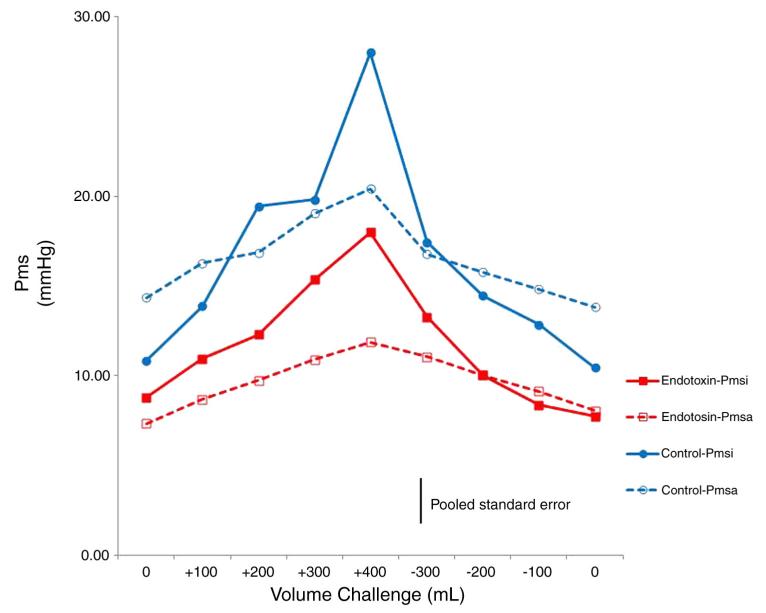
All 6 animal studies had complete data sets allowing calculation of both Pmsi and Pmsa with volume loading before (control) and after (endo) endotoxin infusion. Table 1 summarizes the individual animal data at baseline before volume infusion for both control and endo conditions. Right ventricular stroke volume is the ratio of CO to heart rate (HR). As expected, endo induced a lower MAP and higher CO than control (P < .05). Volume loading increased both Pmsi and Pmsa above baseline values (P < .01); however, the absolute values and their increases were similar. Endo resulted in lower overall Pmsi and Pmsa values than control (P < .01). Individual Pmsi to Pmsa relations during volume loading and removal were tightly correlated across animals (Fig. 2) (r2 = 0.7; P < .01). Although, by Bland-Altman analysis, no systematic bias was observed (Pmsi-Pmsa, mean ± 95%, 0.47 ± 5.04 mm Hg) (Fig. 3), pooled data demonstrated that Pmsa slightly underestimated Pmsi during volume challenges (P < .05, pooled SE, 3.5 mm Hg) (Fig. 4).
Table 1.
Hemodynamic data
| Dog | CO, mL/min |
HR, per min |
MAP, mm Hg |
Platm, mm Hg |
Ppatm, mm Hg |
Pratm, mm Hg |
||||||
|---|---|---|---|---|---|---|---|---|---|---|---|---|
| Control | Endo | Control | Endo | Control | Endo | Control | Endo | Control | Endo | Control | Endo | |
| 1 | 1640 | 3070 | 150 | 160 | 114 | 78 | 8.0 | 7.2 | 12.5 | 16.0 | 6.8 | 7.5 |
| 2 | 3170 | 4120 | 185 | 228 | 135 | 48 | 12.0 | 5.2 | 21.0 | 16.0 | 7.5 | 5.4 |
| 3 | 2800 | 3220 | 250 | 216 | 92 | 47 | 8.0 | 3.6 | 11.5 | 8.4 | 7.1 | 4.6 |
| 4 | 3960 | 4170 | 241 | 200 | 102 | 52 | 10.4 | 2.4 | 12.3 | 6.5 | 5.7 | 2.0 |
| 5 | 2580 | 3810 | 213 | 189 | 94 | 52 | 9.2 | 4.8 | 12.5 | 8.5 | 9.9 | 6.9 |
| 6 | 1620 | 2970 | 219 | 189 | 105 | 60 | 11.4 | 6.8 | 20.5 | 16.0 | 8.7 | 5.8 |
| Mean | 2628 | 3560 | 210 | 197 | 107 | 56 | 9.8 | 5.0 | 15.1 | 11.9 | 7.6 | 5.4 |
| ± SD | 905 | 539 | 37 | 24 | 16 | 12 | 1.7 | 1.8 | 4.4 | 4.5 | 1.5 | 2.0 |
| P < .05 | NS | P < .01 | P < .01 | NS | P < .05 | |||||||
Platm indicates transmural left atrial pressure; Ppatm, mean transmural pulmonary arterial pressure; Pratm, transmural right atrial pressure; NS, nonsignificant.
Fig. 2.
Individual subject plots of Pmsi/Pmsa data pairs during volume loading (open symbols) and removal (closed symbols) for control (blue circles) and endotoxin (red squares) with least squared linear regression lines for pooled loading and removal data points.
Fig. 3.
Bland-Altman analysis of Pmsi and Pmsa data pairs for both control and endotoxin data pairs for all subjects for all volume states.
Fig. 4.
Mean Pmsi and Pmsa data for all 6 subjects during volume loading and removal.
4. Discussion
This study demonstrates that estimates of Pms derived from direct extrapolations of the Guytonian model (Pmsa) reflect Pms estimates made using the instantaneous venous return curve (Pmsi) approach under both baseline and endotoxic shock conditions. These findings support the previous study by Maas et al [10] in postoperative cardiac surgery patients. That study demonstrated similar differences in absolute Pmsa values and tight correlation in changes in Pmsa values with changes in Pms estimated by varying venous return by a series of end-inspiratory hold maneuvers. The present study extends those observations to include validation during acute endotoxemia and over a much larger range of fluid loading states. Importantly, the variances in paired measures of Pms were similar in both the study of Maas et al [10] and this one. These data suggest that Pmsa can be used as a continuously monitored measure of changes in Pms as intravascular status is altered by volume infusion and removal and during systemic disease states such as sepsis.
The study has several limitations. First, neither Pmsi nor Pmsa was compared with true Pms measured by stop-flow vascular equilibrium pressure in this study. However, previously, we showed that Pmsi and stop-flow Pms were the same over a wide range of Pms values in this same canine model under control conditions [5]. Thus, we suspect that both these measures are tracking Pms faithfully. Second, Pmsi is estimated as the zero SVRV Pra intercept by least squares linear regression. Such extrapolations have their own SE of estimate, which may render the Pmsi values less accurate. This may explain why at the highest intravascular volume states (+400 mL) under control conditions, Pmsi raises much more than Pmsa. As illustrated in Fig. 1 (panel B) during the +400 state, both SVRV and Pra values are higher than the other states and the zero flow intercept point a longer extrapolation distance. Thus, it is not clear if Pmsi, Pmsa, or both are inaccurate at this volume level. To a large extent, these measurement errors may contribute to the relatively large absolute variance (±3.5 mm Hg) between paired Pmsi and Pmsa measures. Third, this study was done in a splenectomized canine model, which assumed a similar distribution of compliance and volume between arterial and venous systems as in humans. This may not be the case and might explain the slight underestimation of Pmsi by Pmsa. Fourth, the calibration coefficient needed to calculate Pmsa from CO, arterial pressure, and Pra was arbitrarily taken to reflect a 15-year-old, 250-cm-tall male. This was the calibration suggested by Parkin and Leaning [9] to result in the most reliable estimates of Pms using their model in canine in their initial validation studies. If slightly off as a calibration factor, it would cause us to report systematic difference in Pmsa from Pmsi, although this difference would be small and the changes in Pms in response to volume loading would be unaffected. Finally, acute endotoxemia is not an accurate model of human septic shock. For example, myocardial depression is not seen in acute canine endotoxemia [12]. Thus, repeat studies in septic patients need to be done to confirm the prior clinical study performed in postoperative cardiac surgery patients. However, considering the tightness of fit of the endotoxic Pmsi to Pmsa data, it seems unlikely that major discrepancies in the relation between Pms and Pmsa will be found in septic patients.
Given these findings and the above limitations, it appears that continuous measures of Pmsa can be used to track changes in Pms over time as volume status changes and during both control and acute endotoxic states. Importantly, both Persichini et al [13] and Maas et al [14] recently used the end-inspiratory hold maneuver to estimate Pms in critically ill patients noting the effect of reducing or adding norepinephrine in an effort to alter MAP. Both clinical studies showed that norepinephrine infusions proportionally change Pms and the resistance to venous return. Similarly, Geerts et al [15] showed that the vasodilation effects of dobutamine are offset by its ability to reduce the resistance to venous return. These data explain many of the observed hemodynamic effects of norepinephrine and dobutamine in these clinical settings. Potentially, by continually estimating Pmsa and coupling it with other functional hemodynamic parameters [16], the bedside clinician can not only track but also predict the hemodynamic response to fluid and cardiovascular pharmacologic therapies.
Footnotes
Conflicts of interest: Michael R. Pinsky, MD, was previously a consultant for Applied Physiology, Ltd.
This study was supported in part by NIH award HL067181.
References
- [1].Wiedemann HP, Wheeler AP, Bernard GR, Thompson BT, Hayden D, deBoisblanc B, et al. Comparison of two fluid-management strategies in acute lung injury. N Engl J Med. 2006;354:2564–75. doi: 10.1056/NEJMoa062200. [DOI] [PubMed] [Google Scholar]
- [2].Huang SJ, Hong WC, Han YY, Chen YS, Wen CS, Tsai YS, et al. Clinical outcome of severe head injury using three different ICP and CPP protocol-driven therapies. J Clin Neurosci. 2006;13:818–22. doi: 10.1016/j.jocn.2005.11.034. [DOI] [PubMed] [Google Scholar]
- [3].Brandstrup B, Tonnesen H, Beier-Holgersen R, Hjortso E, Ording H, Lindorff-Larsen K, et al. Effects of intravenous fluid restriction on postoperative complications: comparison of two perioperative fluid regimens: a randomized assessor-blinded multicenter trial. Ann Surg. 2003;238:641–8. doi: 10.1097/01.sla.0000094387.50865.23. [DOI] [PMC free article] [PubMed] [Google Scholar]
- [4].Guyton AC, Polizo D, Armstrong GG. Mean circulatory filling pressure measured immediately after cessation of heart pumping. Am J Physiol. 1954;179:261–7. doi: 10.1152/ajplegacy.1954.179.2.261. [DOI] [PubMed] [Google Scholar]
- [5].Pinsky MR. Instantaneous venous return curves in an intact canine preparation. J Appl Physiol. 1984;56:765–71. doi: 10.1152/jappl.1984.56.3.765. [DOI] [PubMed] [Google Scholar]
- [6].Maas JJ, Geerts BF, van den Berg PC, Pinsky MR, Jansen JR. Assessment of venous return curve and mean systemic filling pressure in postoperative cardiac surgery patients. Crit Care Med. 2009;37:912–8. doi: 10.1097/CCM.0b013e3181961481. [DOI] [PubMed] [Google Scholar]
- [7].Pinsky MR, Matuschak GM. Cardiovascular determinants of the hemodynamic response to acute endotoxemia in the dog. J Crit Care. 1986;1:18–31. [Google Scholar]
- [8].Anderson RM. The gross physiology of the cardiovascular system. 2nd ed. Tucson; Arizona: 2003. pp. 35–37. [Google Scholar]
- [9].Parkin WG, Leaning MS. Therapeutic control of the circulation. J Clin Monit Comput. 1993;22:391–400. doi: 10.1007/s10877-008-9147-7. [DOI] [PubMed] [Google Scholar]
- [10].Maas JJ, Pinsky MR, Geerts BF, de Wilde RB, Jansen JR. Estimating mean systemic filling pressure in postoperative cardiac surgery patients with three methods. Intensive Care Med. 2012;38:1452–60. doi: 10.1007/s00134-012-2586-0. [DOI] [PMC free article] [PubMed] [Google Scholar]
- [11].Hatib F, Jansen JRC, Pinsky MR. Peripheral vascular decoupling in porcine endotoxic shock. J Appl Physiol. 2011;111:853–60. doi: 10.1152/japplphysiol.00066.2011. [DOI] [PMC free article] [PubMed] [Google Scholar]
- [12].Pinsky MR. The cardiovascular response in canine endotoxic shock: effect of ibuprofen pretreatment. Circ Shock. 1992;37(4):323–32. [PubMed] [Google Scholar]
- [13].Persichini R, Silvia S, Teboul JL, Jozwiak M, Chemla D, Richard C, et al. Effects of norepinephrine on mean systemic pressure and venous return in human septic shock. Crit Care Med. 2012;40:3146–53. doi: 10.1097/CCM.0b013e318260c6c3. [DOI] [PubMed] [Google Scholar]
- [14].Maas JJ, Pinsky MR, de Wilde RB, de Jonge E, Jansen JR. Cardiac output response to norepinephrine in postoperative cardiac surgery patients: interpretation with venous return and cardiac function curves. Crit Care Med. 2013;39:143–50. doi: 10.1097/CCM.0b013e318265ea64. [DOI] [PubMed] [Google Scholar]
- [15].Geerts BF, Maas JJ, Lagrand WK, Aarts LP, Pinsky MR, Jansen JRC. Partitioning the resistances along the vascular tree: effects of dobutamine and hypovolemia in piglets with an intact circulation. J Clin Monit Comp. 2010;24:377–84. doi: 10.1007/s10877-010-9258-9. [DOI] [PubMed] [Google Scholar]
- [16].Pinsky MR, Payen D. Functional hemodynamic monitoring. Crit Care. 2005;9:566–72. doi: 10.1186/cc3927. [DOI] [PMC free article] [PubMed] [Google Scholar]


