

Abstract
Men who develop metastatic castration-resistant prostate cancer (CRPC) invariably succumb to the disease. The development and progression to CRPC following androgen ablation therapy is predominantly driven by unregulated androgen receptor (AR) signaling1-3. Despite the success of recently approved therapies targeting AR signaling such as abiraterone4-6 and second generation anti-androgens MDV3100 (enzalutamide)7,8, durable responses are limited, presumably due to acquired resistance. Recently JQ1 and I-BET, two selective small molecule inhibitors that target the amino-terminal bromodomains of BRD4, have been shown to exhibit anti-proliferative effects in a range of malignancies9-12. Here we show that AR signaling-competent CRPC cell lines are preferentially sensitive to BET bromodomain inhibition. BRD4 physically interacts with the N-terminal domain of AR and can be disrupted by JQ111,13. Like the direct AR antagonist, MDV3100, JQ1 disrupted AR recruitment to target gene loci. In contrast to MDV3100, JQ1 functions downstream of AR, and more potently abrogated BRD4 localization to AR target loci and AR-mediated gene transcription including induction of TMPRSS2-ERG and its oncogenic activity. In vivo, BET bromodomain inhibition was more efficacious than direct AR antagonism in CRPC xenograft models. Taken together, these studies provide a novel epigenetic approach for the concerted blockade of oncogenic drivers in advanced prostate cancer.
The identification and therapeutic targeting of co-activators or mediators of AR transcriptional signaling should be considered as alternate strategies to treat CRPC14. BRD4 is a conserved member of the bromodomain and extraterminal (BET) family of chromatin readers that include BRD2/3 and BRDT. BRD4 plays a critical role in transcription by RNA PolII by facilitating recruitment of the positive transcription elongation factor P-TEFb15,16. Similar to other BET-family proteins, BRD4 contains two conserved bromodomains, BD1 and BD2. Competitive binding of JQ1 or I-BET to the bromodomain pocket results in the displacement of BRD4 from active chromatin and subsequent removal of RNA PolII from target genes10-13,17. Although most cancer cells express BET-family proteins it is not clear why only a subset of cell lines from diverse cancers respond to BET-inhibitors9,18. Recently, BRD4 was shown to interact with sequence-specific DNA-binding transcription factors in a gene-specific manner 19. As the genetic and epigenetic landscape differs between tumor types, it is possible that distinct transcriptional regulators that associate with BRD4 might influence the action of BET-inhibitors.
In order to discover new treatment options for CRPc, we treated a panel of 5 prostate cancer and 1 benign prostate cell line with JQ1 and found three of the AR-signaling positive cells to be sensitive to JQ1 though all six cell lines express high levels of its target proteins (Fig. 1a and Extended Data Fig. 1a, b). Next, knock-down of BRD2/3/4 (Extended Data Fig. 1c) showed significant inhibition of cell proliferation/invasion, phenocopying JQ1-treatment (Extended Data Fig. 1d, e). Further, JQ1 treatment induced G0-G1 arrest, apoptosis and associated transcriptional downregulation of the anti-apoptotic BCL-xl in AR-positive cells (Fig. 1b and Extended Data Fig. 1f-1h)13,18. Similar to BCL2 down-regulation by the BET-inhibitor I-BET151 in leukemia10, reduction in BCL-xl by JQ1 could be explained in part by the observed loss of BRD2/3/4 recruitment to its promoter region (Extended Data Fig. 1j). Even at 100nM, long term colony-formation of AR-positive cells were severely inhibited by JQ1 (Extended Data Fig. 1k) with no apparent effect on JQ1 target proteins (Extended Data Fig. 1l, m). As AR-positive cells were preferentially sensitive to JQ1, we examined whether JQ1 has an effect on AR target genes. VCaP cells that harbor TMPRSS2-ERG gene fusion and AR amplification20 displayed a dose-dependent decrease in PSA and ERG at the mRNA and protein levels upon JQ1 treatment (Fig. 1d, e). Similar effects were observed in LNCaP and 22RV1 cells (Extended Data Fig. 2a, b). Furthermore, bortezomib did not reverse the JQ1-mediated PSA and ERG protein loss, indicating that these genes are regulated at the transcriptional level (Extended Data Fig. 2c). We performed microarray analysis to examine changes in global gene expression upon JQ1 treatment. Gene Set Enrichment Analysis (GSEA) using the AR-gene signature revealed significant repression of these genes in AR-positive cells (Fig. 1f) suggesting the role of BET-proteins in AR-mediated transcription. Additionally, we observed a loss of the MYC-associated gene signature in AR-positive cell lines upon JQ1-treatment (Extended Data Fig. 2d). MYC is a known transcriptional target of BET-inhibition in hematological cancers11,18. Interestingly, MYC levels were attenuated by JQ1 in cells that are AR-positive and sensitive to JQ1 inhibition, but not in AR-negative cells (Extended Data Fig. 2e). Thus, high expression of MYC per se (Extended Data Fig. 1b) does not confer sensitivity to JQ1 in prostate cancer cells. Time-course experiments with JQ1 demonstrated loss of MYC (Extended Data Fig. 2f, g) and cyclohexamide had no additional effect on MYC protein levels (Extended Data Fig. 2h, i), ruling out a post-translational mode of JQ1 action. Phenotypically, knockdown of MYC did not affect cell invasion (Extended Data Fig. 2j), while JQ1-treatment inhibited invasion (Extended Data Fig. 1e). Additionally, exogenous expression of MYC did not result in a rescue of JQ1-mediated inhibition of cell growth (Extended Data Fig. 2k, l). Thus, while MYC levels may be repressed by JQ1 in AR-positive cell, and may have a role in proliferation, MYC does not appear to be the primary target for the anti-neoplastic effects of JQ1.
Figure 1. Prostate cancer cell lines with intact androgen signaling are sensitive to BET bromodomain inhibition.
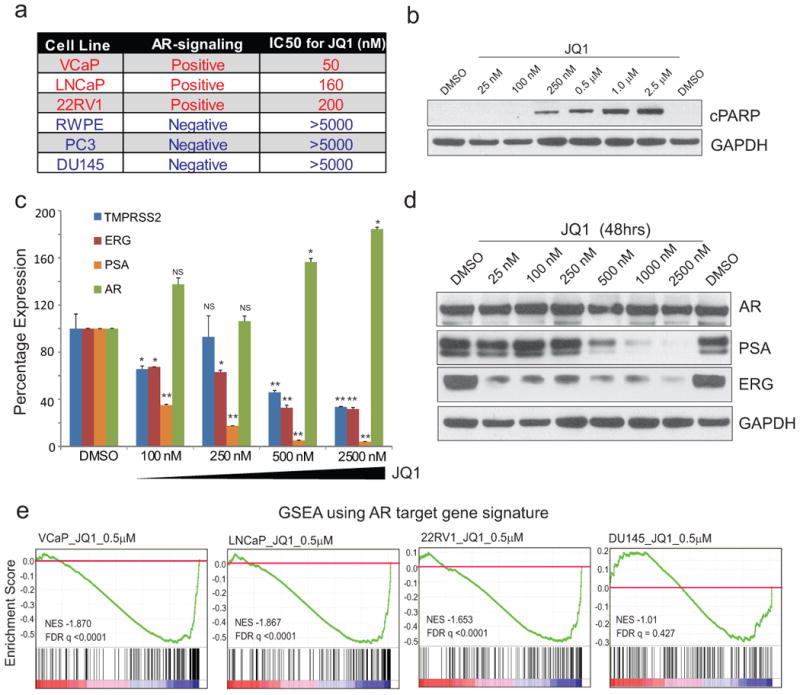
a, IC50 for JQ1 in each cell line is listed. b, Induction of apoptosis in VCaP prostate cancer cells by JQ1. Cleaved PARP (cPARP) immunoblot analysis. GAPDH served as a loading control. c, QRT-PCR analysis of indicated genes in VCaP treated with varying concentrations of JQ1 for 24hrs. Data represent mean ±S.E. (n=3) from one of the three independent experiments. d, Immunoblot analyses of AR, PSA and ERG levels in VCaP treated with JQ1. e, GSEA of the AR target gene signature in VCaP, LNCaP, 22RV1, and DU145 cells. NS, not-significant, *P ≤ 0.05, **P ≤ 0.005 by two-tailed Student's t-test.
Extended Data Figure 1. BET bromodomain inhibitor JQ1 blocks cell growth, induces apoptosis and transcriptionally suppresses anti-apoptotic factor BCL-xl without affecting BRD2/3/4 proteins.
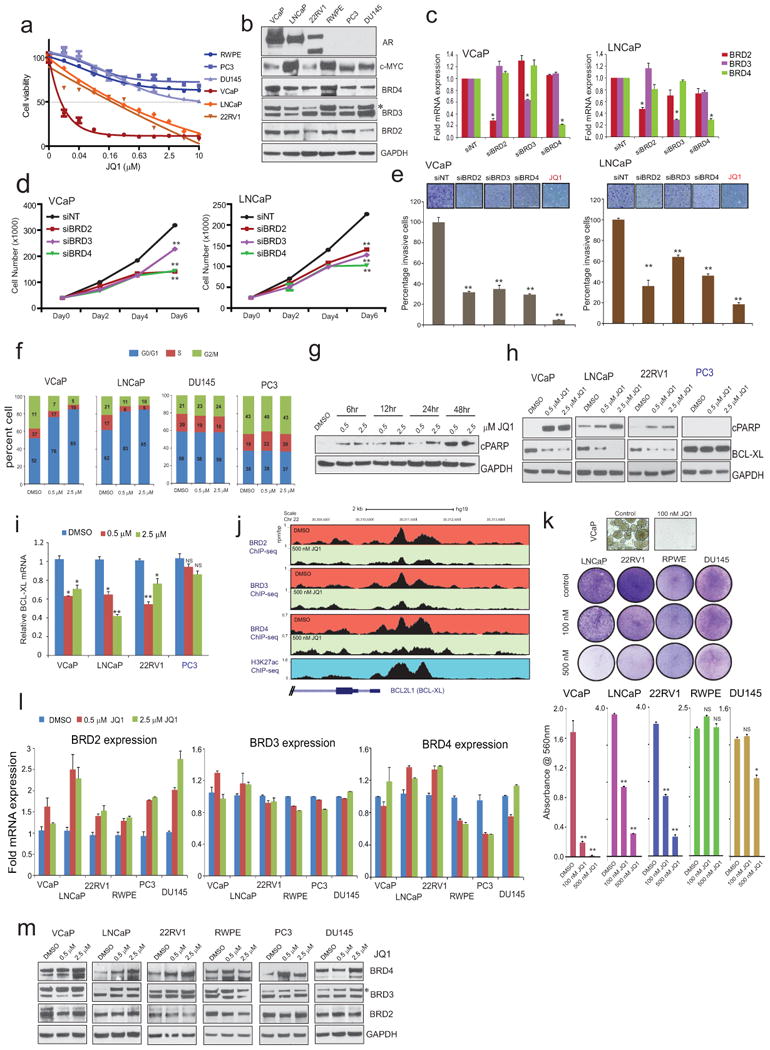
a, Cell viability curves for the 6 prostate lines treated with JQ1. N=6 wells of a 96 well plate per condition. b, BET-bromodomain proteins are ubiquitously expressed in prostate cell lines. AR and MYC protein levels are also shown. GAPDH serves as a loading control. c, Knockdown of BET-bromodomain proteins attenuates cell proliferation and invasion. Q-RT-PCR analyses of BRD2, BRD3 or BRD4 in VCaP cells transfected with siRNA against their respective transcript or NT (non-targeting) siRNA. Data show mean ± S.E. (n=3) from one of the three independent experiments. d, VCaP and LNCaP cell proliferation after indicated gene knockdown. 20,000 cells were seeded in 24-well plates following 24hrs post-transfection with siRNAs and counted on Day 0, 2, 4 and 6 (n=3) by coulter counter. Data show mean ± S.E. e, VCaP and LNCaP cell invasion (n=6) after indicated gene knockdown. JQ1 was used at 500nM. f, Cell cycle analysis of JQ1-treated prostate cell lines (after 48hr treatment with JQ1). Data represent 3 independent experiments. g, Induction of apoptosis as determined by appearance of cleaved PARP (cPARP) in VCaP prostate cancer cells by JQ1. GAPDH served as a loading control. h, Immunoblot demonstrating an increase in cPARP and decrease in BCL-xl in all three AR-positive cell lines compared to AR negative PC3 cells upon JQ1 treatment. i, Relative BCL-xl mRNA levels as determined by TaqMan qPCR in JQ1-treated cells. Data show mean ± S.E. (n=3) from one of three independent experiments. j, ChIP-seq data depicting loss of BRD2/3/4 recruitment to the BCL-xl promoter upon JQ1-treatment in VCaP cells. The Genome browser representation of BRD2/3/4 binding events on the BCL-xl promoter region. The y-axis denotes reads per million per base pair (rpm/bp), the x-axis denotes the genomic position. The bottom panel depicts H3K27ac mark on the same promoter region in VCaP cells. k, Colony formation assays of prostate cell lines. Cells were cultured in the presence or absence of 100 and 500nM of JQ1 for 12days followed by staining (upper panel) and quantification (lower panel, mean ± S.E. n=6). Representative photographs of crystal violet stained colonies (except for VCaP) used for quantification is shown. l, BET bromodomain inhibitor JQ1 does not affect its target proteins. QRT-PCR analyses of BRD2, BRD3 and BRD4 in prostate cancer cell line panel treated with two different concentrations of JQ1 for 24hrs. Data show mean ± S.E. (n=3) from one of the three independent experiments. m, Immunoblot analysis of BRD proteins in prostate cell line panel treated with JQ1 for 48hrs. GAPDH serves as a loading control. Asterisks on (a) and (m) indicates non-specific band. Representative blots shown are from triplicate biological experiment. NS, not significant; *P ≤ 0.01; **P ≤ 0.001 by two-tailed Student's t-test.
Extended Data Figure 2. Effect of JQ1 on AR target genes and on MYC transcription.
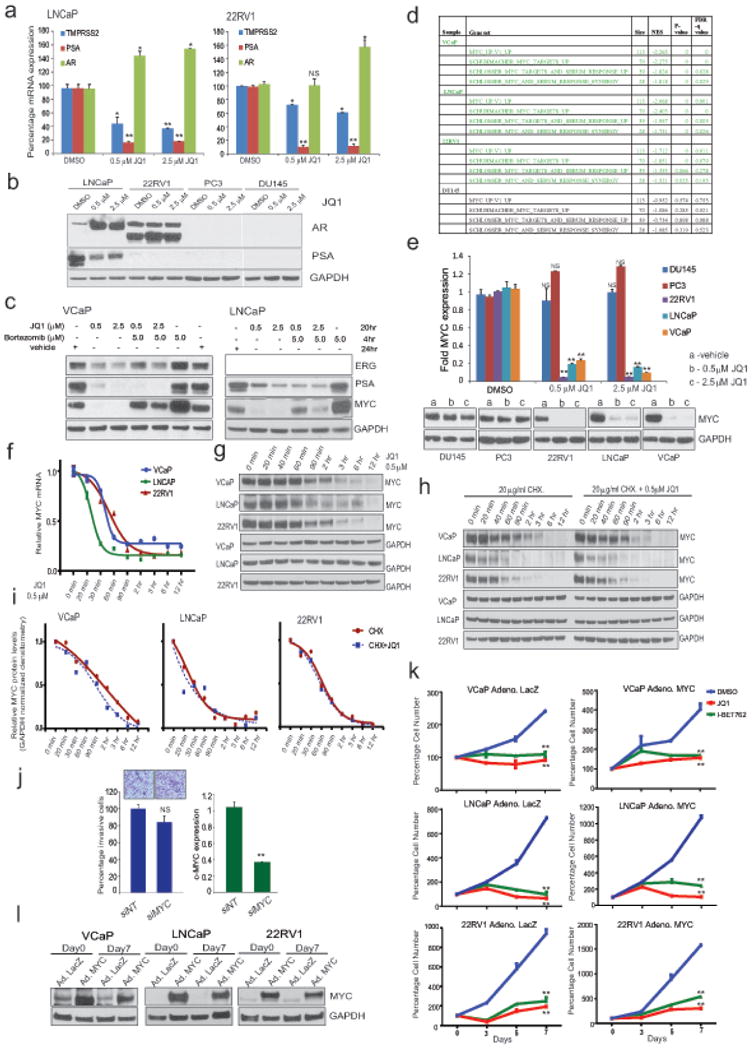
a, QRT-PCR analysis of indicated genes in LNCaP and 22RV1 cells treated with varying concentrations of JQ1 for 24hrs. Data show mean ± S.E. (n=3) from one of the two independent experiments. b, Immunoblot analysis of AR and PSA in a panel of prostate cancer cells after treatment with two different doses of JQ1. GAPDH serves as a loading control. c, ERG and PSA are transcriptional targets of JQ1. Proteasome inhibitor bortezomib does not rescue ERG and PSA levels in JQ1-treated VCaP cells. Immunoblot analyses of ERG and PSA in VCaP and PSA in LNCaP cells treated with JQ1 followed by incubation with bortezomib as indicated. MYC, known to be degraded by proteasome, was used as a positive control for bortezomib treatment. GAPDH serves as a loading control. d, GSEA showing loss of MYC signature (4 gene set) in AR-positive VCaP, LNCaP and 22RV1 cells but not AR-negative DU145 cells after JQ1 treatment; size- number of genes in each set; NES- normalized enrichment score; p- and FDRq, test of statistical significance. e, QRT-PCR and immunoblot analysis of MYC in JQ1-treated prostate cancer cells. Data show mean ± S.E. (n=3) from one of the two independent experiments. f, and g, time-course QRT-PCR and immunoblot analysis of MYC in AR-positive VCaP, LNCaP, and 22RV1 cells after JQ1-treatment. h, Cyclohexamide (translation inhibitor) treatment does not enhance JQ1-mediated loss of MYC protein ruling out post-translational degradation of MYC by JQ1. Time-course immunoblot analysis of MYC in VCaP, LNCaP, and 22RV1 cells treated with cyclohexamide or cyclohexamide+JQ1 as indicated. Representative blots from two independent experiments are shown. i, GAPDH-normalized MYC protein levels are shown. Band intensities from d were determined by ImageJ and the plots were generated using GraphPad Prism. j, MYC knockdown does not affect cell invasion. Box plot shows invasion of VCaP cells transfected with siNT or siMYC. Inset shows the image of invaded VCaP cells (n=6). Right, Q-RT-PCR of MYC upon siRNA transfection. Data show mean ± S.E. from one of the three independent experiments. k, Exogenous MYC introduction does not rescue JQ1-mediated cell growth inhibition. Cells were infected with control adeno-LacZ or adeno-MYC virus. Equal numbers of cells were plated 24hrs post infection and treated with 500nM JQ1 or I-BET762. Cells were counted (n=3 wells) and plotted; Day 0 of drug treatment was set at 100%. Data show mean ± S.E. from one of the four independent experiments. l, Immunblot analysis depicts overexpression of MYC in adeno-MYC infected cells on Day 0 and Day 7 of the experiment. GAPDH serves as a loading control. *P ≤ 0.05; **P ≤ 0.005 by two-tailed Student's t-test.
Since BRD4 is known to engage sequence-specific DNA binding proteins19, we hypothesized that AR may interact directly with BRD4. We performed gel-filtration-chromatography and found that AR and BRD4 predominantly co-eluted in a high-molecular weight complex (Fig. 2a and Extended Data Fig. 3a). Moreover, RNA PolII, a reported target for phosphorylation by BRD421, also co-eluted in the same complex, suggestive of a large multi-protein complex composed of AR, BRD4 and RNA PolII. Immunoprecipitation experiments further confirmed an endogenous association between AR and BRD4 (Fig. 2b). Additionally, we observed an interaction between AR and BRD2/3 (Fig. 2b), implicating a common region in BRD2/3/4 proteins responsible for AR interaction. To map the region mediating this interaction, we tested the ability of different deletion variants of BRD4 to pull-down AR in 293T cells (Fig. 2c). BRD4 variant containing BD1-BD2 domains maintained the ability to pull-down AR even at high salt concentrations (Fig. 2d, e). To determine whether the BD1-BD2 domains directly interact with AR, we carried out quantitative assessment of the binding affinity using the Octet-RED system. We applied varying concentrations of BD1-BD2 protein to biosensors with immobilized AR and found that BRD4 interacts with AR in a concentration-dependent fashion, with an estimated Kd of 70nM, supporting a high affinity interaction (Fig. 2f and Extended Data Fig. 3b, c). To fine-map this interaction we created a series of Halo-AR and GST-BRD4 constructs for in vitro pull-down studies and demonstrated that the BD1, and to a lesser extent the BD2, bind directly to NTD-domain of AR, which was further mapped to a 38 amino acid region NTD1b of AR (Fig. 2g and Extended Data Fig. 3d-f). Subsequently, we observed the disruption of BD1-AR and BD1-NTD1b interactions by JQ1 (Fig. 2h) as well as loss of endogenous BRD4-AR interaction (Extended Data Fig. 3g). Together, these data suggest that BET protein inhibition leads to disruption of the AR-BRD4 interaction and likely explains the preferential activity of JQ1 in AR-positive prostate cancer cells.
Figure 2. Physical association of the N-terminal domain of AR with BRD4 and its disruption by BET bromodomain inhibition.
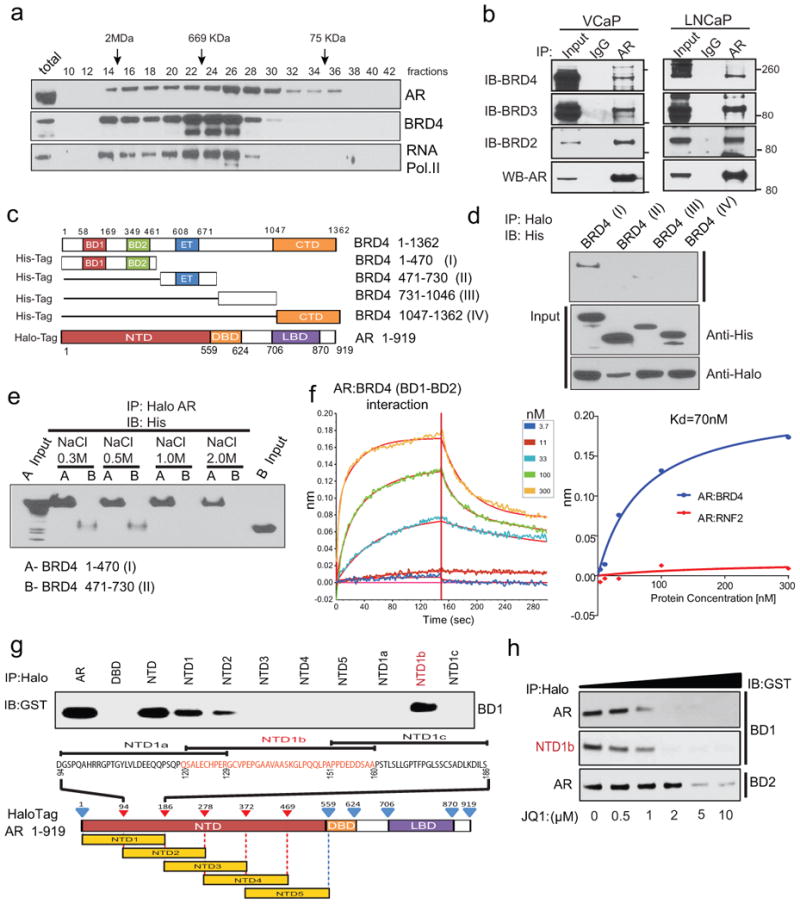
a, VCaP nuclear extracts were fractionated on a Superose-6 column and AR, BRD4 and RNA PolII were analyzed by immunoblotting. b, Endogenous association of AR and BRD2/3/4. VCaP and LNCaP nuclear extracts were subjected to immunoprecipitation using an anti-AR antibody. Immunoprecipitates were analyzed for the presence of BRD2/3/4 by immunoblotting (upper panel). The immunoblot was stripped and reprobed for AR (lower panel). 5% total lysate was used as input control. c, Schematic of BRD4 and AR constructs used for co-immunoprecipitation experiments. BD1/2, bromodomain 1/2; ET, Extraterminal domain; CTd, C-terminal domain; NTd, N-terminal domain; DBd, DNA-binding domain; LBd, ligand-binding domain. d, N-terminal domain of BRD4 interacts with AR. Proteins from 293T cells co-transfected with various His-tag-BRD4 deletion and Halo-tag-AR constructs were subjected to immunoprecipitation with Halo-beads followed by immunoblotting with His-tag antibody. Inputs are shown in the bottom panel. e, as in d but with the indicated salt concentrations. f, Representative sensorgrams from 3 independent experiments for AR:BRD4 (BD1-BD2) by an OctetRED biolayer interferometry showing direct interaction. Real-time binding was measured by immobilizing biotinylated AR protein on the super streptavidin biosensor and subsequent interaction with varying concentrations of BRD4 (BD1-BD2) protein. The plots show the response versus protein concentration curves derived from the raw binding data. Right, Dissociation constant (Kd) represents the BRD4 (BD1-BD2) concentration yielding half-maximal binding to AR. Protein RNF2 was used as negative control. g, NTD domain of AR interacts with BD1 of BRD4. Equal amounts of in vitro translated proteins were combined and immunoprecipitated using Halo beads followed by immunoblot analysis with anti-GST antibody. h, JQ1 disrupts AR-BD1 interactions. Varying concentrations of JQ1 were incubated with AR-BD1, NTD1b-BD1, AR-BD2 complex prior to immunoprecipitation followed by immunoblot analysis.
Extended Data Figure 3. Physical association of AR with BRD4 and its disruption by BET bromodomain inhibitor.
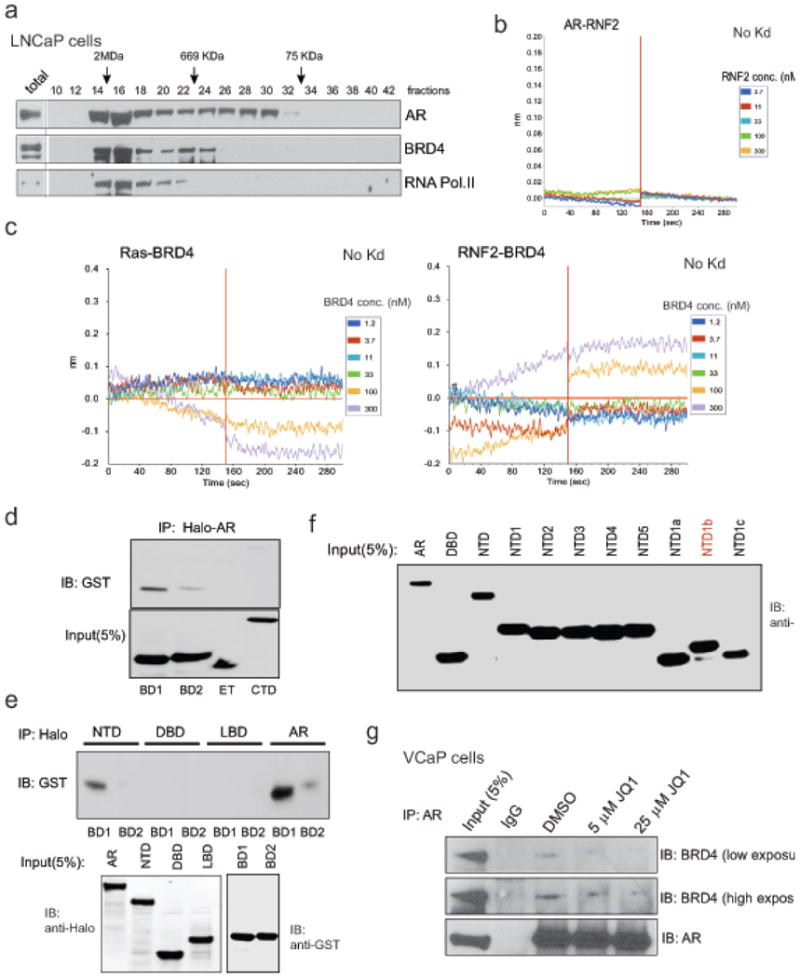
a, LNCaP nuclear extract was fractionated on a Superose-6 column and AR, BRD4 and RNA Pol II were analyzed by immunoblot analysis. b, and c, Representative sensorgrams for AR:RNF2, Ras:BRD4 (BD1-BD2) and RNF2:BRD4 (BD1-BD2) interactions by an OctetRED biolayer interferometry. Real time binding was measured by immobilizing biotinylated AR, Ras or RNF2 proteins separately on a streptavidin biosensor and subsequent interaction with varying concentrations of analyte proteins (RNF2 or BRD4 (BD1-BD2)) individually. Immobilized Ras or RNF2 biosensors did not display binding with BRD4 indicating that the AR-BRD4 interaction is specific. Representative sensorgrams from 4-6 independent experiment are shown. d and e, In vitro binding analysis of AR and indicated domains of BRD4. Equal amounts of in vitro translated full-length Halo-tag-AR protein and GST-tag-BRD4 domains were combined and immunoprecipitated using Halo beads followed by immunoblot analysis with anti-GST antibody. f, JQ1 disrupts the endogenous AR-BRD4 interaction. VCaP cells were treated with JQ1 for 6hrs followed by immunoprecipitation and immunoblot analysis as in Figure 2b.
Ubiquitously expressed BRD2/3/4 proteins are suggested to have overlapping functions10,13,22 and consistent with this notion, we observed AR interaction with BRD2/3/4. Since BET-inhibitors such as JQ1 and I-BET762 have high affinity for BD1/BD2 domain of BRD2/3/4 proteins10,11,13, we hypothesized that BET-inhibitors may affect genome-wide recruitment of all the three BET-proteins. We performed ChIP-seq with antibodies against BRD2/3/4 in VCaP cells treated with JQ1 or I-BET762 (Extended Data Fig. 4a) and observed a high genome-wide overlap between BRD2/3/4 (62-86% peak overlap) (Extended Data Fig. 4b, c). JQ1 or I-BET762 treatment led to a reduction in the recruitment of all three proteins to chromatin (Extended Data Fig. 4d). Moreover, the reduced BRD2/3/4 recruitment was equally distributed for regions with or without AR (Extended Data Fig. 4e).
Extended Data Figure 4. Changes in genome-wide enrichment profiles of BRD proteins in response to bromodomain inhibitors.
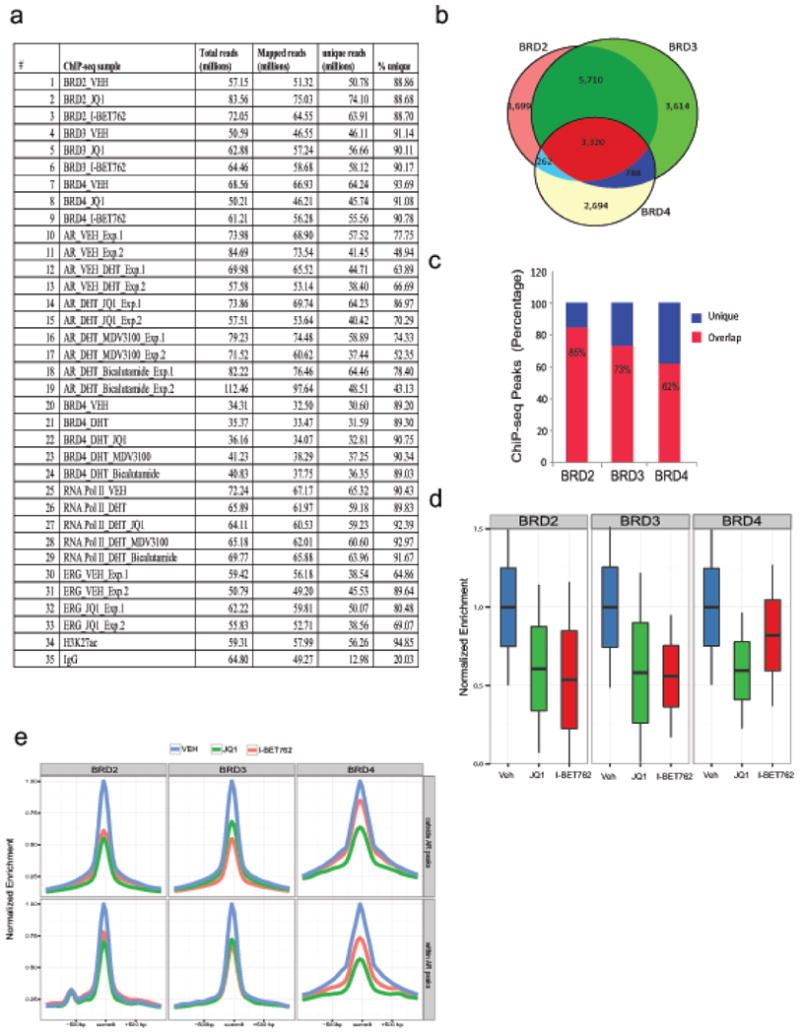
a, Table showing high-throughput sequencing read information for ChIP libraries of BRD2, BRD3, BRD4, AR, RNA Pol.II, ERG, H3K27ac and IgG performed for this study. b, Chromatin immunoprecipitation coupled to high-throughput sequencing (ChIP-seq) was performed using BRD2, BRD3, and BRD4 antibodies in VCaP cells treated with DMSO, JQ1 or I-BET762 for 12hrs. Genome-wide distribution of BRD2, BRD3, and BRD4 enriched sites. Highly significant peaks (see Methods) show relatively high overlap. A large majority of sites is occupied by at least two BRD proteins. BRD2 and BRD3 have the most similar localization pattern. c, BRD proteins show varying degrees of overlap. Shown is the ratio of sites occupied by either protein alone (unique) or co-occupied with another BRD-family protein (overlap). BRD4 shows the largest number of unique peaks. d, BET-inhibitors JQ1 and I-BET762 attenuate recruitment of BRD proteins from chromatin. Enrichment levels for each protein were normalized to the median enrichment in vehicle treated cells. BRD2 and BRD3 proteins show similar response to both inhibitors, whereas BRD4 is more potently evicted by JQ1. e, BET bromodomain inhibitors deplete target proteins from genomic regions with or without AR. Mean enrichment levels within each sub-panel were normalized to the maximum mean enrichment in vehicle treated cells.
Binding of androgen (DHT) to AR leads to its translocation from the cytoplasm to the nucleus where it binds to regions of DNA harboring AREs and results in subsequent recruitment of proteins involved in transcriptional activation or suppression in a gene-specific manner. BRD4 interacts with acetylated histones as well as DNA-binding transcription factors, leading to context-dependent transcriptional activation or inhibition of target genes15,19,22. Since the AR-BRD4 interaction is disrupted by JQ1 (Fig. 2), we next explored whether AR localization is affected in a genome-wide context. We performed ChIP-seq with antibodies against AR, BRD4, and RNA PolII in cells that were either starved, treated with DHT or DHT+JQ1 (Extended Data Fig. 4a). Two anti-androgens, bicalutamide and MDV3100 were included for comparison. As expected, the average ChIP-seq signal for AR was highly enriched in DHT-treated cells (Fig. 3a and Extended Data Fig. 5a, b). Recruitment of AR to target loci was markedly attenuated by MDV3100 and less so by bicalutamide. Interestingly, JQ1 blocked AR recruitment almost as effectively as MDV3100 (Fig. 3a and Extended Data Fig. 5c-e). Furthermore, we observed a co-recruitment of AR and BRD4 at 2,031 sites. The strongest association was observed within promoters of AR-regulated genes (502 promoters, p=4e-49), and for the highest AR peaks (1,112 sites, p=1e-38) (Fig. 3b). Limiting our evaluation to AR and BRD4 coincident peaks, we observed that DHT-mediated AR recruitment to these loci was inhibited by MDV3100 and to a lesser extent by JQ1 (Fig. 3c). In contrast, JQ1 almost completely abrogated DHT-induced BRD4 recruitment to the AR-BRD4 shared loci (Fig. 3d). Examples of gene tracks for AR- and BRD4-associated genomic regions such as enhancers and super-enhancers17 and the effects of different treatments on their levels are shown in Fig. 3e, and Extended Data Fig. 5f. In corroboration with the ChIP-seq data, gene expression analysis in VCaP and LNCaP cells displayed more efficient repression of DHT-induced AR-target genes by JQ1 than by MDV3100 or bicalutamide (Extended Data Fig. 5g, h).
Figure 3. BET bromodomain inhibition disrupts AR and BRD4 binding to target loci.

a, AR ChIP-seq was performed in VCaP cells treated for 12hr with vehicle, DHT (10nM), DHT+JQ1 (500nM), DHT+MDV3100 (10μM) or DHT+Bicalutamide (25μM). Summary plot of AR enrichment (average coverage) across ARBs (AR Binding sites) in different treatment groups is shown. Data represent one of the two biological replicates. b, Venn diagram illustrating the overlap of AR and BRD4 enriched peaks in DHT treated sample. c, and d, Summary plot for AR and BRD4 enrichment for the AR-BRD4 overlapping (2,031) regions. e, Genome browser representation of AR, BRD4 and RNA PolII binding events on a putative “super-enhancer” of the AR-regulated BMPR1B gene. The y-axis denotes reads per million per base pair (rpm/bp). The x-axis denotes the genomic position with a scale bar on top right. The putative super-enhancer region enriched for AR, BRD4 and RNA PolII is depicted with a black bar on the top left.
Extended Data Figure 5. Influence of JQ1 and anti-androgens on genome-wide recruitment of AR and their effect on DHT induced AR target gene expression.
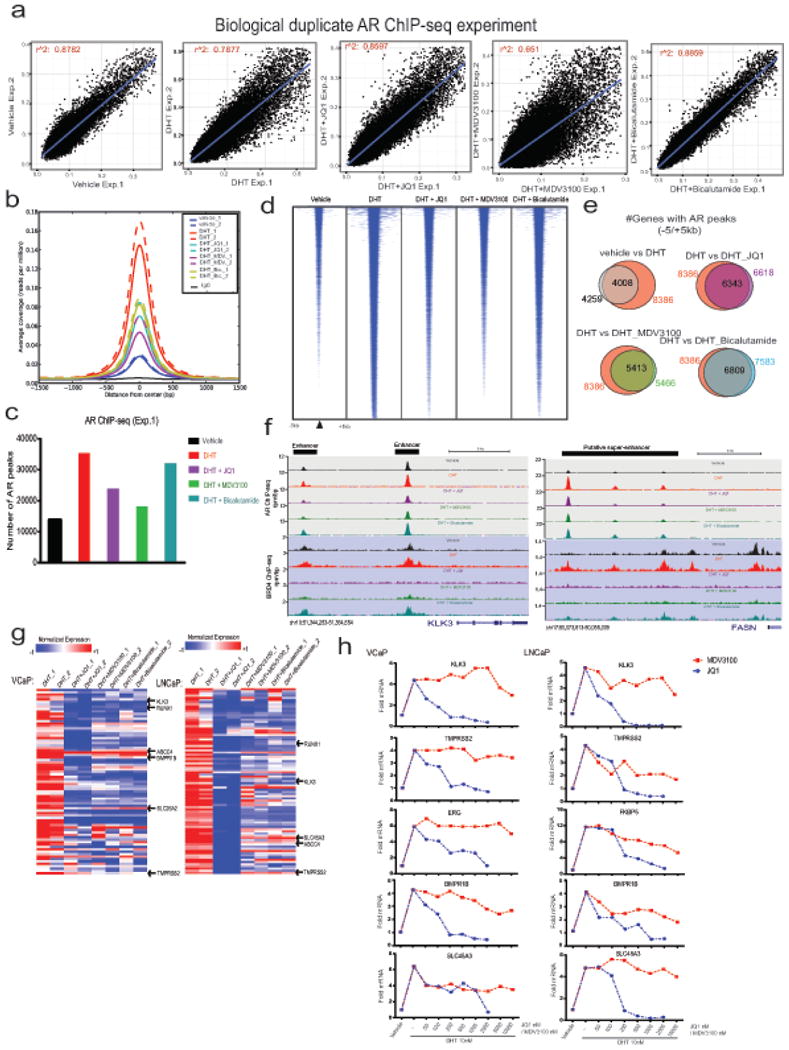
a, Two independent biological replicates of AR ChIP-seq experiments in VCaP cells show high correlation of normalized enrichment levels (see Methods) in the majority of treatment conditions. R-square values for each biological duplicate are shown. b, Mean enrichment (coverage) profiles are similar between biological replicates and different between treatment conditions, indicating that no adverse changes in enrichment levels are observed between the replicates. c, Bar graph showing total number of AR peaks for VCaP treated cells. The genome-wide individual peaks for AR yielded the highest number of peaks for DHT (35,390) whereas vehicle control cells displayed only 13,874 peaks However, the number of peaks for AR was 23,961, 18,264 and 32,212 in the presence of JQ1, MDV3100 and bicalutamide, respectively. d, Heatmap representation of AR binding peaks in different treatment groups. Genomic target regions are rank-ordered based on the level of AR enrichment at each AREs (Androgen Response Elements) within -1kb and +1kb flanking genomic region. e, Venn diagram illustrating the overlap of AR-bound genes between different treatment groups. f, AR-BRD4 binding on KLK3 and FASN upstream regions. Genome browser representation of AR and BRD4 binding events on a putative “enhancer” and “super-enhancer” of AR-regulated KLK3 and FASN gene respectively. The y-axis denotes reads per million per base pair (rpm/bp), the x-axis denotes the genomic position with a scale bar on top right. g, Expression of AR target genes in the presence of JQ1, MDV3100 or bicalutamide. Heat maps for VCaP and LNCaP cells treated with DHT (10nM), DHT+JQ1 (0.5μM), DHT+MDV3100 (10μM) and DHT+bicalutamide (25μM). Red arrows indicate well-characterized AR target genes. h, QRT-PCR analysis of AR-regulated genes in the VCaP and LNCaP treated cells. In order to directly compare JQ1 and MDV3100 in blocking AR signaling, cells were treated with varying concentrations of JQ1 or MDV3100 followed by DHT-treatment and analyzed for AR targets. The reduction in DHT-induced gene expression was observed for JQ1 even at 100-250nM whereas MDV3100 displayed a marginal reduction at 10μM, demonstrating the higher efficacy of JQ1 in blocking AR target gene expression. Data show mean ± S.E. (n =3) from one of the two independent experiments.
JQ1-treatment had a marked effect on ERG expression in VCaP cells (Fig. 1d, e and Extended Data Fig. 5h) and we found that the attenuation of DHT-induced ERG expression by JQ1 was due to de-recruitment of RNA PolII from ERG gene body and reduced binding of AR and BRD4 on the TMPRSS2 promoter/enhancer (Extended Data Fig. 6a, b). The efficient ERG downregulation by JQ1 has significant implication as TMPRSS2-ERG gene fusion product is the oncogenic driver in 50% of prostate cancers20,23. To investigate the effect of JQ1 on ERG-mediated transcription we performed ERG ChIP-seq in cells treated with JQ1 for 12hrs; a time window where ERG protein levels are still unaffected by JQ1 (Extended Data Fig. 6c), and observed a significant loss in the top 4% of ERG enriched peaks (Extended Data Fig. 6d). We next determined the functional consequence of JQ1 treatment by measuring the expression levels of select ERG target genes (Extended Data Fig. 6e, f). As expected, the ERG-activated genes were down-regulated and ERG-repressed genes were de-repressed by JQ1 (Extended Data Fig. 6g, h). To evaluate BET inhibitor repression of ERG-mediated oncogenic function in an isogenic setting, we overexpressed ERG in RWPE and PC3 cells (Extended Data Fig. 7a, b). Treatment of JQ1 or I-BET762 led to an attenuation of ERG-mediated invasion (Extended Data Fig. 7c) and GSEA demonstrated a significant negative enrichment for ERG target genes upon BET inhibitor treatment (Extended Data Fig. 7d). Further, we found that ERG was highly enriched on the known distal-enhancer of MYC that was reduced upon JQ1-treatment (Extended Data Fig. 8a, b). Likewise, ETV1 occupies the same distal-enhancer region in ETV1 fusion-positive LNCaP23. Knockdown of ERG or ETV1 along with AR led to MYC down-regulation, implicating MYC regulation by ETS proteins in fusion-positive prostate cancer cells (Extended Data Fig. 8c-e). Notably, ChIP-seq analysis of AR and RNA PolII enrichment at the MYC locus presented an interesting pattern where DHT treatment led to increased AR and reduced RNA PolII binding on the MYC distal-enhancer and gene body respectively, that was reinstated in the presence of MDV3100 or bicalutamide but not JQ1 (Extended Data Fig. 8f). This observation is consistent with the concomitant reduction in MYC expression upon DHT treatment that was de-repressed in the presence of MDV3100 but not JQ1 (Extended Data Fig. 8g-i). Lack of de-repression of MYC by JQ1 in this setting could be explained by the fact that both AR and ERG are absent from the MYC distal-enhancer leading to net loss of MYC expression. This data also suggests a mechanism by which CRPC patients become resistant to anti-androgen therapy by maintaining expression of the MYC oncogene.
Extended Data Figure 6. Effect of JQ1 on the TMPRSS2-ERG loci and ERG-mediated transcription in VCaP cells.
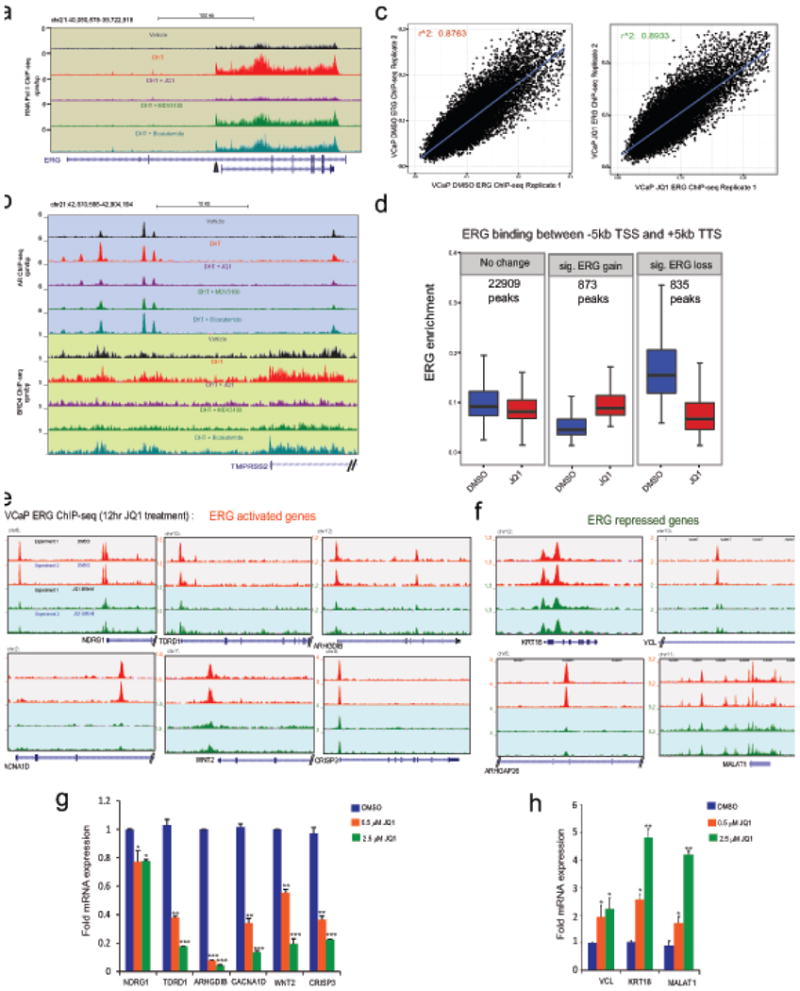
a, Genome browser representation of RNA PolII binding events within the ERG gene body. The y-axis denotes reads per million mapped reads per base pair (rpm/bp), the x-axis denotes the genomic position and the black arrow indicates the region involved in TMPRSS2-ERG fusion. b, as in a, AR and BRD4 binding on promoter of ERG 5′-fusion partner TMPRSS2 in VCaP cells. Note the reduced RNA PolII and AR/BRD4 recruitment levels in DHT+JQ1 tracks for ERG gene body and TMPRSS2 promoter respectively. c, High reproducibility of ERG ChIP-seq experiments. Biological replicates of ERG ChIP-seq experiments show very high correlation of normalized enrichment levels (see Methods) in the JQ1- and DMSO-treated conditions. d, Significant changes in ERG levels upon JQ1 treatment at ERG-binding sites in the proximity of gene loci. Changes in ERG enrichment levels were assessed using DESeq2. Statistically significant differences were observed for ERG-gain and ERG-loss. Significant ERG-gains are associated with quantitatively modest changes in enrichment level. On the other hand significant ERG-losses are associated with greater changes in enrichment levels. Individual number of peaks for each panel is shown. e, Genome browser representation of ERG binding events on bona fide ERG-activating target genes. The y-axis denotes reads per million per base pair (rpm/bp), the x-axis denotes the genomic position. f, Genome browser representation of ERG binding events on ERG-repressed target genes. g, TaqMan QRT-PCR analysis of ERG-activated genes in VCaP cells after JQ1 treatment. h, TaqMan QRT-PCR analysis of ERG-repressed genes in VCaP cells after JQ1 treatment. Data represents mean ±S.D. (n= 3) from one of the two independent experiments.*P ≤ 0.05; **P ≤ 0.005,***P ≤ 0.0005 by two-tailed Student's t-test.
Extended Data Figure 7. BET bromodomain inhibitors reverse ERG-mediated functions in an isogenic cell line system.
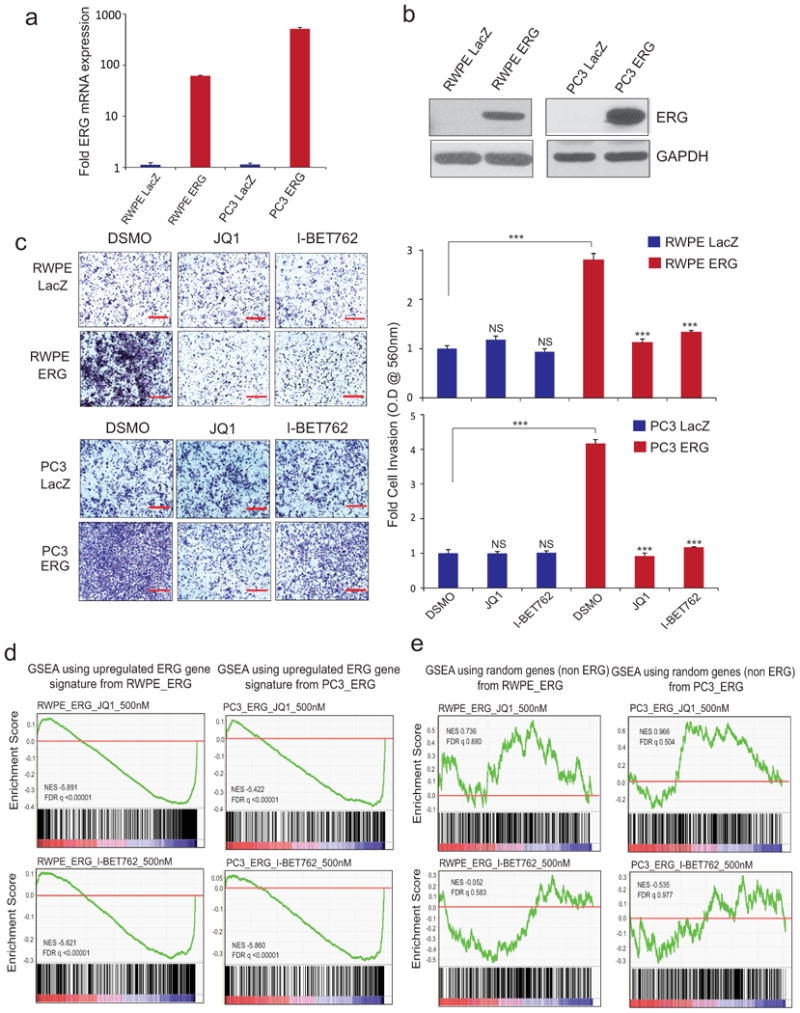
a, and b, QRT-PCR and immunoblot showing overexpression of ERG in RWPE and PC3 prostate cell lines. Data represent mean ±S.E. (n= 3). c, BET-inhibitors block ERG-induced RWPE and PC3 cell invasion. RWPE and PC3 cells stably expressing either LacZ or ERG were treated with DMSO (n=4), 500nM JQ1 (n=4) or I-BET762 (n=4) for 24hrs prior to plating in Matrigel-coated Boyden chambers. After 48hrs cell invasion was quantified. Left, Representative photomicrographs of invaded cells are shown (lower Boyden chamber stained with crystal violet). Right, bar graph shows fold cell invasion with DMSO-treated LacZ expressing cells set to 1. Data represent mean ± S.E. from one of the three independent experiments. d, BET-inhibitors reverse ERG-induced gene transcription. Gene Set Enrichment Analysis (GSEA) of the ERG target gene signature (see method) in RWPE-ERG and PC3-ERG cells treated with JQ1 or I-BET762 (500nM) for 24hrs. ERG-induced genes are repressed by JQ1 or I-BET762 treatment. e, GSEA using a random gene set shows no significant positive or negative enrichment by JQ1 or I-BET762 treatment in RWPE-ERG and PC3-ERG cells. NS, not significant; ***P ≤ 0.0001 by two-tailed student's t-test.
Extended Data Figure 8. JQ1 inhibits ETS (ERG/ETV1) factors that regulate MYC expression in VCaP and LNCaP cells.
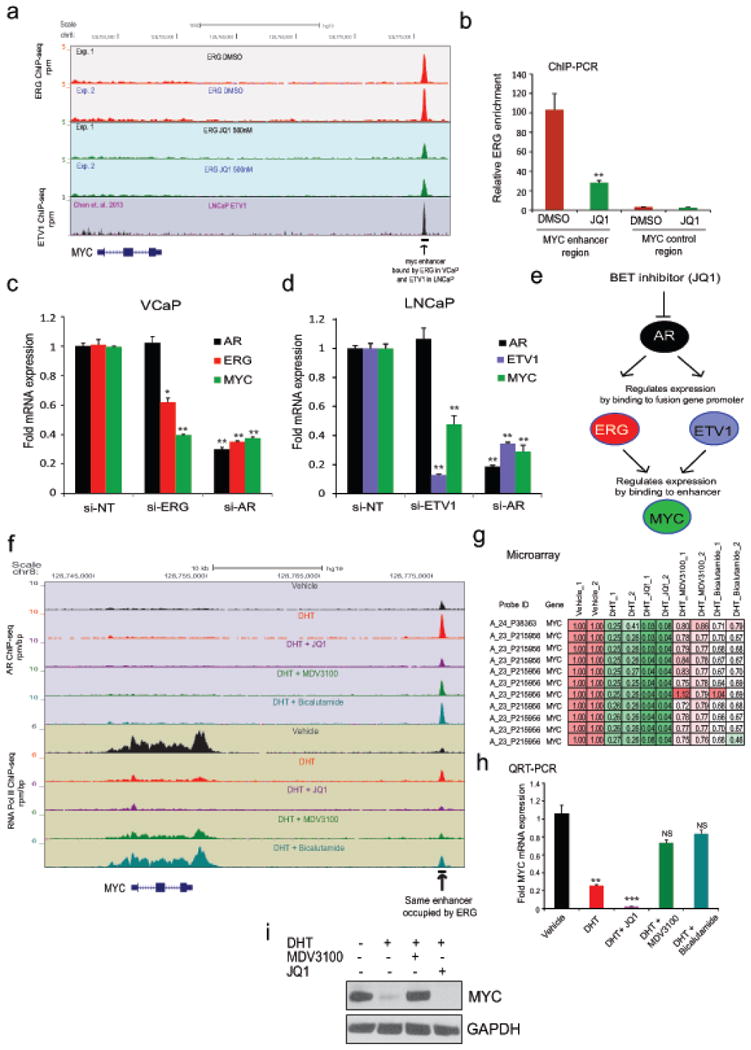
a, Genome browser representation of ERG and ETV1 binding events on the MYC distal enhancer42. JQ1-treatment in VCaP cells reduces ERG enrichment as shown in two independent ERG ChIP-seq experiments. The y-axis denotes reads per million per base pair (rpm/bp), the x-axis denotes the genomic position. LNCaP ETV1 ChIP-seq data is from Chen et. al. 2013, displaying ETV1 recruitment to the MYC distal enhancer. b, ChIP-PCR validation of loss of ERG recruitment after JQ1-treatment in VCaP cells. Data show mean ± S.D. (n =3) from one of the two independent experiments. c, and d, Knock-down of AR or ETS factor reduces MYC gene expression in VCaP and LNCaP cells. QRT-PCR for AR, ETS and MYC expression in siNT, siAR or siETS transfected cells. Data show mean ± S.D. (n =3) from one of the two independent experiments. e, A cartoon illustrating the mechanism of MYC loss by JQ1 in AR positive VCaP and LNCaP cells. f, Anti-androgens but not JQ1 de-repress MYC expression in prostate cancer cells. Genome browser representation of AR and RNA PolII binding events within the MYC gene locus. The y-axis denotes reads per million per base pair (rpm/bp), the x-axis denotes the genomic position. Note the AR recruitment to the same distal enhancer which is occupied by ERG (see Extended Data Fig. 8a), implicating a competition between AR and ETS factor to bind to this enhancer region to regulate MYC gene expression. g, Heat map showing the MYC expression values from VCaP microarray gene expression data. h, Anti-androgen restores DHT-repressed MYC expression in VCaP cells. QRT-PCR of MYC in VCaP cells treated with vehicle, DHT (10nM), DHT+JQ1 (500nM), DHT+MDV3100 (10μM) or DHT+Bicalutamide (25μM). Inability of JQ1 to de-repress MYC in this setting could be explained by the fact that both AR and ERG is de-recruited from MYC distal enhancer leading to net loss of MYC expression. i, MDV3100 and not JQ1 restores DHT-repressed MYC protein levels in VCaP cells. Immunoblot of MYC protein in VCaP cells pre-treated with vehicle, MDV3100 (10μM) or JQ1 (500nM) for 4hrs followed by DHT (10nM) for 20hrs. Data show mean ± S.D.(n =3) from one of the two independent experiments. NS, not significant; *P ≤ 0.01; **P ≤ 0.001; **P ≤ 0.0001 by two-tailed Student's t-test.
Next, we sought to compare the efficacy of JQ1 and MDV3100, a direct AR antagonist used clinically to treat advanced CRPC8. Before embarking on the in vivo experiment we tested them on VCaP cells in vitro for 8 days and observed marginal cell death by MDV3100 versus suppression of cell growth at sub-micromolar concentrations by JQ1 (Extended Data Fig. 9a). To rule out the possibility of JQ1 being a generic anti-androgen, we confirmed that JQ1 had no effect on physiologic androgen-regulated processes; however, JQ1 reduced testes size in mice as reported earlier24 (Extended Data Fig. 9b-f). Treatment of VCaP tumor-bearing mice with JQ1 led to significant reduction in tumor volume/weight (Fig. 4a, band Extended Data Fig. 10a); however, MDV3100 had a less pronounced effect. Recently, several studies described the pro-metastatic effects of MDV3100 in pre-clinical models25. To test whether MDV3100 treatment leads to spontaneous metastasis in our VCaP xenograft model, we isolated femur, liver and spleen from MDV3100-treated mice and found evidence of metastases in femur and liver (Extended Data Fig. 10b, c). By contrast, JQ1-treated mice displayed no evidence of metastasis (Extended Data Fig. 10c). Taken together, these pre-clinical studies suggest that the use of MDV3100 in clinically localized prostate cancer may potentiate the formation of micro-metastases unlike BET-inhibitors. Consistent with previous reports, JQ1 and MDV3100 were both well tolerated by mice (Extended Data Fig. 10d). Although VCaP cells were originally derived from a patient with CRPc, VCaP tumor xenografts respond to castration in mouse models. We found that JQ1 still had a growth inhibitory effect in castration-resistant VCaP tumor xenografts and observed a 50% reduction in castration-resistant tumors by JQ1-treatment (Fig. 4c and Extended Data Fig. 10e).
Extended Data Figure 9. JQ1 does not affect normal prostate growth and testosterone levels but reduces testis size in mice.
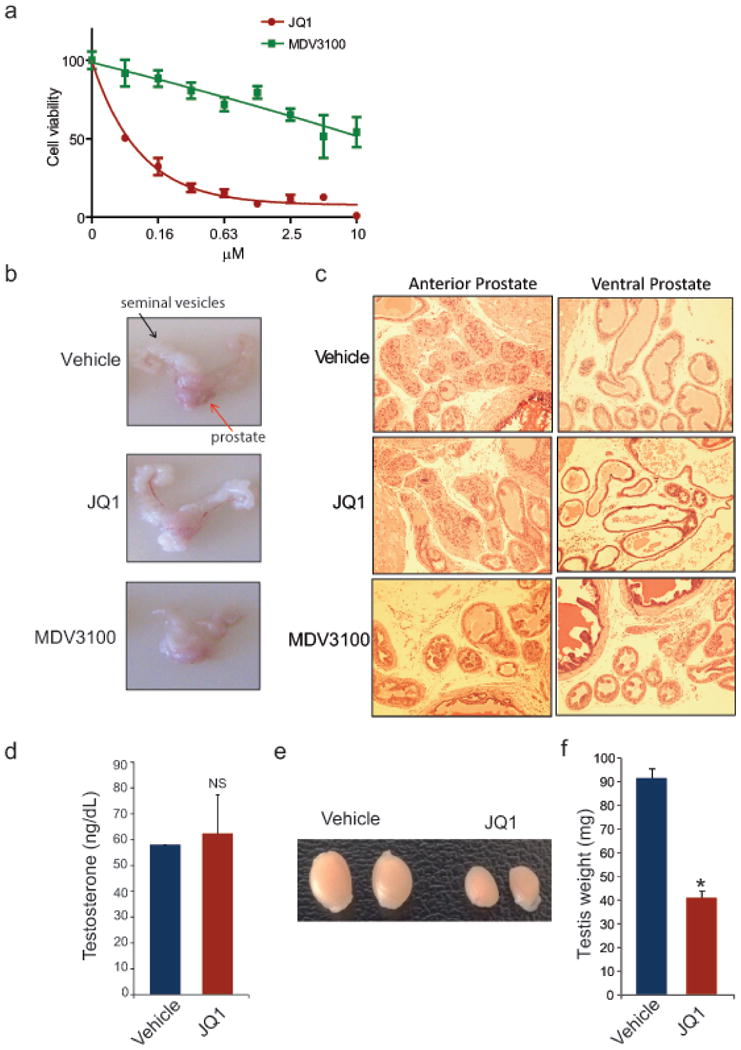
a, Comparison of JQ1 and MDV3100 treatment on VCaP cell viability in vitro. N=8 wells of a 96 well plate per condition. VCaP cells were treated with MDV3100 or JQ1 for 8 days and assayed for viability with Cell-titerGLO. b, Gross images showing highly hormone-responsive seminal vesicles (s.v.) attached to prostate gland (red and black arrows respectively) from male mice treated for 30 days with vehicle, JQ1 (50mg/kg) or MDV3100 (10mg/kg). Vehicle or JQ1-treated mice show no change in the appearance of seminal vesicles. By contrast, MDV3100-treated animals display remarkable shrinkage of seminal vesicles. c, Mice treated with JQ1 do not show any adverse changes to anterior or ventral prostate morphology. The H&E images show normal morphology of anterior and ventral prostate from vehicle or JQ1-treated mice. MDV3100-treated mice display attenuated remnant glands of anterior or ventral prostate. d, Male mice (n =3 per group) treated with vehicle or JQ1 for 30 days exhibit similar serum testosterone levels. Data represents the mean ± S.E. e, Gross analysis of testis from mice treated with vehicle or JQ1 for 30 days. f, Testis weight from vehicle control or JQ1-treated mice. Data represents the mean ± S.E. from n=7 mice per group. NS, not significant; *P ≤ 0.0001 by two-tailed Student's t-test.
Figure 4. BET bromodomain inhibition blocks CRPC in vivo.

a, VCaPcells were implanted subcutaneously in mice and grown until tumors reached the size of approximately 100mm3. Xenografted mice were randomized and then received (n=6 per group) vehicle, 50mg/kg JQ1 or 10mg/kg MDV3100 as indicated 5days/week. Caliper measurements were taken bi-weekly. Mean tumor volume ±S.E. is shown. b, Individual tumor weight from different treatment groups with p-values is shown. c, Top panel, schematic illustrating the VCaP CRPC mouse xenograft experimental design. Bottom panel, castrated mice bearing VCaP CRPC xenograft received vehicle (n=6) or 50mg/kg JQ1 (n=7) as indicated 5days/week. Mean tumor volume ±S.E. is shown. Statistical significance by two-tailed Student's t-test. d, Schematic depicting varying mechanisms to block AR-signaling in CRPC. 1. Abiraterone inhibits androgen biosynthesis by blocking the enzyme CYP17A1. 2. MDV3100 competitively antagonizes androgen binding to AR preventing nuclear translocation and recruitment to target gene loci. 3. JQ1 (or BET-inhibitors) blocks AR and BRD2/3/4 interaction and co-recruitment to target gene loci as well as the functional activity and/or expression of ETS and MYC.
Extended Data Figure 10. In vivo effects of BET bromodomain inhibition in VCaP xenograft model.
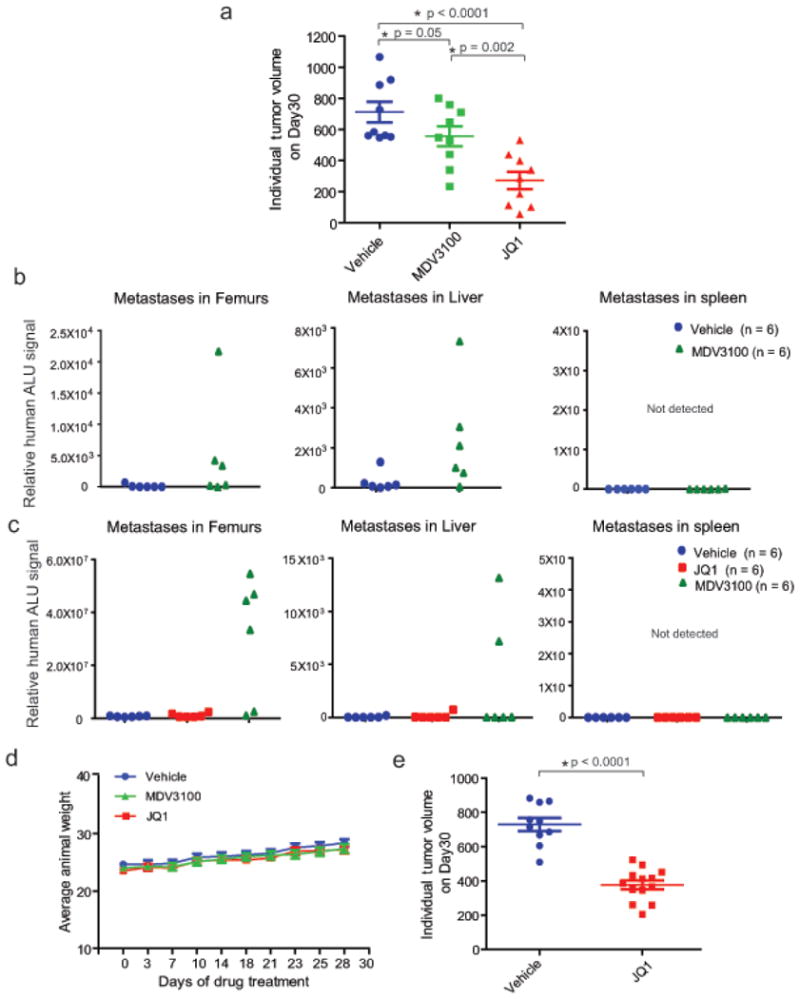
a, VCaP cells were implanted subcutaneously in mice and grown until tumors reached the size of approximately 100mm3. Xenografted mice were randomized and then received vehicle, 50mg/kg JQ1 or 10mg/kg MDV3100 5 days/week as indicated. Caliper measurements were taken bi-weekly. Individual tumor volume from different treatment groups at the end of the experiments with p-values is shown. b, MDV3100 treatment leads to spontaneous metastasis. Mice bearing VCaP xenografts (subcutaneously engrafted) treated with vehicle (n=6) or MDV3100 (n=6) were assessed for spontaneous metastasis to the femur (bone marrow) and soft tissues such as liver and spleen. Genomic DNA isolated from these sites was analyzed for metastasized cells by measuring human ALU sequence (by Alu-QPCR). MDV3100-treated mice displayed spontaneous metastasis to femur and liver. Spleen did not show presence of human ALU sequences. c as in a, for mice bearing VCaP xenografts treated with vehicle (n = 6), JQ1 (n = 6) or MDV3100 (n = 6). MDV3100-treated but not JQ1-treated mice displayed metastasis to femur and liver. d, JQ1 or MDV3100 treatment does not affect animal weight. Mice from VCaP cell xenograft experiments treated with vehicle, 10mg/kg MDV3100 or 50mg/kg JQ1 were weighed at the time of caliper measurements. e, Individual tumor volume for vehicle or JQ1-treated VCaP mouse xenograft (for data shown in Figure 4c). Mean ± S.E. is plotted. Statistical significance by two-tailed Student's t-test.
Maintenance of AR signaling is the most common resistance mechanism that patients with advanced prostate cancer develop after conventional hormonal treatments26. AR amplification, mutation, and alternative splicing have all been suggested as potential resistance mechanisms to anti-androgen treatments2,27,28. Over half of CRPC patients have at least one of these aberrations in the AR pathway29. As BET-inhibitors function “downstream” of AR (Fig. 4d), our data suggests that these compounds may be effective in the context of AR-mediated resistance including compensatory mechanisms involving related steroid hormone receptors that are also likely to require BET bromodomain function. By functioning downstream of AR, BET-inhibition is less likely to be affected by acquired resistance associated with AR antagonists, including the recently identified F876L mutation of AR30. While both MDV3100 and JQ1 block AR recruitment to target loci on a genome-wide scale (the “AR cistrome”), we found that JQ1 likely has an enhanced inhibitory effect by further abrogating co-recruitment of BRD4, which is required for mobilization of the transcriptional machinery15,16. A recent study demonstrated that BET-inhibition leads to preferential loss of BRD4 at “super-enhancers” and consequent transcriptional elongation defects17. These super-enhancers were often associated with key oncogenic drivers in a variety of cancers. Tumor cells are thought to become addicted to select oncogenes and hence unusually reliant on their high expression, which may explain the preferential sensitivity of BET-inhibition in cancer versus normal tissues. While MYC and its association with multiple myeloma was highlighted as a super-enhancer dependent cancer17, this framework likely applies to key transcription factors involved in the development of CRPC including AR, ETS, and MYC (Fig. 4d). Taken together, these data strongly suggest that clinical evaluation of BET-inhibitors is warranted in CRPc, either as monotherapy or in combination with second generation anti-androgens.
Methods
Cell Culture
VCaP prostate cancer cells were grown in DMEM with Glutamax (Gibco); LNCaP, 22RV1, DU145 and PC3 prostate cancer cell lines were grown in RPMI 1640; all were supplemented with 10% FBS (Invitrogen) in 5% CO2 cell culture incubator. The immortalized benign prostate cell line RWPE-1 was grown in keratinocyte media with supplements (Lonza). All cell lines were tested and found to be free of mycoplasma contamination.
Cell Viability Assay
Cells were seeded in 96-well plates at 2000-10,000 cells/well (optimum density for growth) in a total volume of 100μl media containing 10% FBS. Serially diluted compounds in 100μl media were added to the cells 12hr later. Following 96 hr. incubation, cell viability was assessed by Cell-Titer GLO (Promega). The values were normalized and IC50 was calculated using GraphPad Prism software. For long-term colony formation assay, 10,000-50,000 cells/well were seeded in six-well plates and treated with either 100nM or 500nM of JQ1 or DMSO. After 12 days cells were fixed with methanol, stained with crystal violet and photographed. For colorimetric assays, the stained wells were treated with 500μl 10% acetic acid and the absorbance was measured at 560nm using a spectrophotometer.
Cell Cycle Analysis
Cells were grown in 6 well plates and treated with varying concentrations of JQ1. For cell cycle analysis, cells were washed 48hr post-treatment with PBS and fixed in 70% ethanol overnight. The cells were washed again with PBS, stained with propidium iodide and analyzed by flow cytometry.
RNA Interference
For knockdown experiments, cells were seeded in six-well plates and transfected with 100nM ON-TARGETplus SMARTpool siRNA (ThemoScientific) targeting BRD2, BRD3, BRD4, MYC or non-targeting control (Non-targeting Pool catalogue # D-001810-10-50 using oligofectamine (Invitrogen) according to the manufacturer's instructions. Following are the cataloque numbers and the siRNA sequence, ON-TARGETplus Human BRD2_SMARTpool_catalogue # L-004935-00-0005_target sequences [CACGAAAGCUACAGGAUGU; GGGCCGAGUUGUGCAUAUA;CCUAAGAAGUCCAAGAAAG;GUCCUUUCCUGCCUACGUA]; ON-TARGETplus Human BRD3_SMARTpool_catalogue # L-004936-00-005_ target sequences [AAUUGAACCUGCCGGAUUA;CGGCUGAUGUUCUCGAAUU;GGAGAGAUAUGUCAAGUCU; GCGAAUGUAUGCAGGACUU] ; ON-TARGETplus_Human BRD4_ SMARTpool_Catalogue # L-004937-00-0005_ target sequences [AAACCGAGAUCAUGAUAGU;CUACACGACUACUGUGACA;AAACACAACUCAAGCAUCG;CAGCGAAGACUCCGAAACA]; and ON-TARGETplus_Human MYC_SMARTpool_Catalogue # L-003282-00-0005]. Cells were trypsinized 24hrs post-transfection and used in cell proliferation and matrigel invasion assays as well as for RNA extractions to determine the knockdown efficiency.
For AR knockdown ON-TARGETplus Human AR _ SMART pool_ Catalogue no. L-003400-00-0005_ target sequences [GAGCGUGGACUUUCCGGAA; UCAAGGAACUCGAUCGUAU; CGAGAGAGCUGCAUCAGUU; CAGAAAUGAUUGCACUAUU] was used at 100nM concentration; for ERG knockdown siRNA from Dharmacon catalogue # D-003886-01-0050; and for ETV1 knockdown -a mix of ETV1 siRNA ID s4854_catalogue # 4392420; ETV1 SiRNA ID s4855_catalogue #4392420; from Life Tech. was used at 100nM concentration for transfection using Oligofectamine.
Cell Proliferation Assay
For cell proliferation assays post siRNA knockdown, 20,000 cells/well were seeded in 24-well plates (n=3) and cells were harvested and counted at the indicated time points by Coulter counter (Beckman Coulter, Fullerton, CA).
VCaP, LNcaP and 22RV1 cells were transduced with either Ad-c-MYC (Vector Biolabs, cat. No. 1285) or LacZ control Adeno viral particles. 24hrs post infection, equal number of cells were seeded in 24 well plates and treated with vehicle, JQ1 or I-BET762 at 500nM concentration. Cells were counted at the indicated time points by Coulter Counter.
Matrigel Invasion Assays
Twenty-four hours post-infection with siRNA or 500nM JQ1 treatment, 0.2×10⁶ VCaP or 0.1×10⁶ LNCaP cells were seeded in a transwell chamber pre-coated with Matrigel (BD Biosciences). Medium containing 10% FBS in the lower chamber served as chemoattractant. In the case of JQ1, 500nM compound was added to both upper and lower chambers. After 48hr, the non-invading cells and EC matrix were gently removed with a cotton swab and invasive cells located on the lower side of the chamber were stained with crystal violet, air dried, photographed and counted.
PC3 and RWPE cells were treated with JQ1 or I-BET762 at 500nM concentration along with DMSO control for 24hrs prior to seeding 50,000cells/well in a transwell chamber pre-coated with Matrigel along with the corresponding drugs used for treatment. Medium containing 10% FBS in the lower chamber served as chemoattractant. After 48hr, the non-invading cells and EC matrix were gently removed with a cotton swab and invasive cells located on the lower side of the chamber were stained with crystal violet, air dried and photographed. For colorimetric assays, the inserts were treated with 150μl of 10% acetic acid and the absorbance measured at 560nm using a spectrophotometer (GE Healthcare).
RNA Isolation and Quantitative Real-Time PCR
Total RNA was isolated from cells using RNeasy Mini Kit (Qiagen) and cDNA was synthesized from 1,000ng total RNA using SuperScript III First-Strand Synthesis SuperMix (Invitrogen). QPCRs were performed in duplicate or triplicate using Taqman assays (Applied Biosystems) or standard SYBR green reagents and protocols on a StepOnePlus Real-Time PCR system (Applied Biosystems). The target mRNA expression was quantified using ΔΔCt method and normalized to GAPDH expression. All primers were designed using Primer 3 (http://frodo.wi.mit.edu/primer3/) and synthesized by Integrated DNA Technologies (Coralville, IA). The primer sequences for the SYBR green and catalogue numbers for TaqMan assays qPCR used are as follows: brd2_qPCR_fwd_CTACGTAAGAAACCCCGGAAG; brd2_qPCR_rev_ GCTTTTTCTCCAAAGCCAGTT; brd3_qPCR_fwd_CCTCAGGGAGATGCTATCCA; brd3_qPCR_rev_ ATGTCGTGGTAGTCGTGCAG; brd4_qPCR_fwd_AGCAGCAACAGCAATGTGAG; brd4_qPCR_rev_ GCTTGCACTTGTCCTCTTCC; erg_qPCR_fwd_CGCAGAGTTATCGTGCCAGCAGAT; erg_qPCR_rev_CCATATTCTTTCACCGCCCACTCC; psa(klk3)_qPCR_fwd_ACGCTGGACAGGGGGCAAAAG; psa(klk3)_qPCR_rev_ GGGCAGGGCACATGGTTCACT; tmprss2_qPCR_fwd_CAGGAGTGTACGGGAATGTGATGGT; tmprss2_qPCR_rev_GATTAGCCGTCTGCCCTCATTTGT; fkbp5_qPCR_fwd_TCTCATGTCTCCCCAGTTCC; fkbp5_qPCR_rev_ TTCTGGCTTTCACGTCTGTG; slc45a3_qPCR_fwd_TCGTGGGCGAGGGGCTGTA; slc45a3_qPCR_rev_CATCCGAACGCCTTCATCATAGTGT; bmpr1b_qPCR_fwd_ CCACCATTGTCCAGAAGACTC; bmpr1b_qPCR_rev_ GCAACCCAGAGTCATCCTCTT; myc_qPCR_fwd_GCTCGTCTCAGAGAAGCTGG; myc_qPCR_rev_GCTCAGATCCTGCAGGTACAA; ar_qPCR_fwd_CAGTGGATGGGCTGAAAAAT; ar_qPCR_rev_GGAGCTTGGTGAGCTGGTAG; etv1_qPCR_fwd_GCAAGAAGGCTTCCTGGCTCAT; etv1_qPCR_rev_CCTTCCCGATACATTCCTGGCT; gapdh_qPCR_fwd_ TGCACCACCAACTGCTTAGC; gapdh_qPCR_rev_ GGCATGGACTGTGGTCATGAG; myc_dis.enh_ChIPPCR_fwd_TGGCAACTTCTGCCTGTGTA; myc_dis.enh_ChIPPCR_rev_CAGGCAGGGAGGAAGTCAAT; myc_upstream_ChIPPCR_fwd_CCAGGACAAATGACCACACA; myc_upstream_ChIPPCR_rev_CCCTTGGCAAACATCAACTT; TaqMan primer-probes tdrd1 _catalogue # Hs00229805_m1; cacna1d_ catalogue # Hs00167753_m1; arhgdib_catalogue # Hs00171288_m1; ndrg1_ catalogue # Hs00608387_m1; vcl_ catalogue # Hs00419715_m1; krt8_ catalogue # Hs01595539_g1; malat1_catalogue # Hs00273907_s1; bcl-xl_ qPCR_ catalogue # Hs00236329_m1; wnt2_ qPCR_ catalogue # Hs00608224_m1; crisp3_qPCR_catalogue # Hs00195988_m1.
Antibodies and Immunoblot analyses
Antibodies used in the immunoprecipitation (IP) and immunoblotting (IB) assays are AR_ IP, IB (Abcam Cat. #ab74272); RNA Pol II_ IB (Abcam Cat. # ab5408) ; BRD2_IB (Abnova Cat. #PAB3245); BRD3_ IB (SantaCruz Cat.# sc-81202) ; BRD4_IB (Bethyl Cat. #( A301-985A); ERG_IB (Epitomics Cat.# 2805-1);MYC_IB (Sigma Cat. # M5546) ; PSA_IB (Dako Cat. #A0562); GST_IB (GE Life Science Cat. # 27-4577-01); Halo_IP, IB (Promega Cat.# G9281); Poly Histidine_IP, IB (Sigma Cat.# H1029); Bcl-Xl_IB (Cell Signaling Cat. # 2762) ; cPARP_ IB (Cell Signaling Cat. # 9541); GAPDH (14C10)_IB ( Cell Signaling Cat.# 3683s). All antibodies were employed at dilutions suggested by the manufacturers. For Western blot analysis, 200ug total protein extract was boiled in sample buffer and 10-20μg aliquots were separated by SDS-PAGE and transferred onto Polyvinylidene Difluoride membrane (GE Healthcare). The membrane was incubated for one hour in blocking buffer [Tris-buffered saline, 0.1% Tween (TBS-T), 5% nonfat dry milk] followed by incubation overnight at 4°C with the primary antibody. Following a wash with TBS-T, the blot was incubated with horseradish peroxidase-conjugated secondary antibody and signals were visualized by enhanced chemiluminescence system as per manufacturer's protocol (GE Healthcare).
Immunoprecipitations
For endogenous immunoprecipitation experiments, nuclear extracts were obtained from VCaP and LNCaP cells using NE-PER nuclear extraction kit (Thermo Scientific). Nuclear pellet was then lysed in IP buffer (20mM Tris pH7.5, 150mM NaCl, 1% Triton-X 100, Protease Inhibitor) by sonication. Nuclear lysates (0.5-1.0mg) were pre-cleaned by incubation with protein G Dynabeads (Life Technologies) for 1 hr. on a rotator at 4°C. 5μg antibody was added to the pre-cleared lysates and incubated on a rotator at 4°C overnight prior to the addition of protein G Dynabeads for 1hr. Beads were washed thrice in IP buffer and resuspended in 40 μL of 2x loading buffer and boiled at 90°C for 10 minutes for separation of the protein and beads. Samples were then analyzed by SDS-PAGE and western blotting as described above. For endogenous competitive assays, the VCaP cells were incubated with 5 or 25μM JQ1 for 6 hrs. prior to nuclear protein extractions.
For co-immunonoprecipitation experiments in 293T cells, plasmids encoding various deletion mutants of BRD4 in pCDNA4c, (Addgene) and full length AR in pFN21 plasmid (Promega) were transfected using Fugene 6.0 HD (Roche) according to the manufacturer's instruction. Twenty four hrs. post transfection, total proteins were extracted using IP buffer supplemented with protease inhibitor cocktail mix (Sigma) and the expressions of the corresponding proteins were analyzed by immunoblotting. Immunoprecipitation using Halo-beads followed by immunoblotting with anti-His antibody were performed as described above.
Cell free protein-protein interaction studies
In vitro protein expression was carried out by cloning the desired expression cassettes downstream of a Halo- or GST-tag to produce fusion proteins. Briefly, AR and its sub-domains were cloned into the pFN2K vector containing N-terminal GST sequence (Cat.# G1891, Promega); BRD4 and its sub-domains were cloned into the pFN19A vector containing N-terminal Halo sequence (Cat.# C8461, Promega). After cloning, the fusion proteins were expressed using the cell-free transcription and translation system (Cat.# L5030, Promega) following the manufacturer's protocol. For each reaction, protein expression was confirmed by Western blot.
A total of 10μl cell-free reaction containing halo- and GST-tag fusion proteins were incubated in PBST (0.1% tween) at 4°C overnight. Ten microliter HaloLink beads (Cat.#G931, Promega) were blocked in BSA at 4°C for overnight. After washes with PBS, the beads were mixed with AR-BRD4 mixture and incubated at RT for 1hr. Halolink beads were then washed with PBST for 4 times and eluted in SDS loading buffer. Proteins were separated on SDS gel and blotted with anti-GST Ab (GE healthcare). For competitive assay, AR-BD1, NTD1b-BD1 and AR-BD2 mixture was incubated in the presence of varying doses of JQ1 compound.
AR:BRD4 Direct Interaction Assays by OctetRED
The binding affinity between AR and BRD4 was determined by biolayer interferometry technology using the OctetRED system (ForteBio). Recombinant AR protein (Cat.# AR-8486H, Creative Biomart) was biotinylated by EZ-Link NHS-PEG4 Biotinylation Kit (Cat.# 21329, Thermo Scientific) following the manufacturer's protocol and any unincorporated biotin was removed from the reactions with Zeba 2ml desalt columns. Biotinylated proteins (5μg/ml) were then incubated with super-streptavidin biosensors (Cat.#18-5057, ForteBio) in binding buffer (20mM HEPES pH 7.4, 150mM NaCl) and washed three times in binding buffer. BRD4 (BD1- BD2) protein (Cat.# 31047, BPS Biosciences) was serially diluted in binding buffer, and the AR:BRD4 association/dissociation was monitored by OctetRED for 10 min at 25°C. Non-specific binding was controlled by subtracting the signal obtained from AR:RNF2 interactions from that of AR:BRD4 interactions and baseline signal drift was controlled by monitoring immobilized AR without BRD4. OctetRED analysis software was used to analyze the data.
Gene Expression Array Analysis
VCaP, LNCaP, 22RV1 and DU145 cells were treated with 500nM JQ1 for 24 hrs. and total RNA extracted using RNeasy Mini Kit (Qiagen) for gene expression array analysis. For anti-androgen comparative study, VCaP and LNCaP cells were grown in media containing 10% charcoal-striped serum for 48 hrs. followed by pre-treatment with 500nM JQ1, 10μM MDV3100 or 25μM Bicalutamide for 6 hrs. and stimulated with 10nM DHT (androgen) for 18 hrs. Cells treated with only vehicle or 10nM DHT served as controls. For determining the effect of BET inhibitors in isogenic ERG system, RWPE-ERG and PC3-ERG cells were treated with 500nM JQ1 or I-BET762 for 24hrs. Expression profiling was performed using the Agilent Whole Human Genome Oligo Microarray (SantaClara, CA) according to the manufacturer's protocol. All samples were run in technical duplicates or quadruplets against control. Over- and under-expressed gene sets were generated by filtering to include only data points that displayed 2-fold average over- or underexpression (Log ratio with p<0.001) in all hybridizations.
Gene Set Enrichment Analysis (GSEA) was performed using the JAVA program (http://www.broadinstitute.org/gsea) as described31.
The AR target gene signature used in GSEA analysis was generated from common up-regulated genes in VCaP and LNCaP upon DHT treatment and the gene list is as follows, ABCC4, ABHD2, ACSL3, ADARB2, AF349445, AFF4, AI089002, AI207522, AI570240, AK023660, AK025360, AK055915, AK057576, AK074291, AK092594, AK093002, AK098478, AK124281, AK124426, AL533190, AL713762, ALDH1A3, AMAC1L2, ANKRD37, ANXA2, ARSG, ASRGL1, ATP10A, ATP1A1, ATP1A4, ATRNL1, AUTS2, AW029229, AW389914, AZGP1, B3GAT1, BC039021, BC041926, BC041955, BC055421, BC062780, BG462058, BG618474, BI710972, BM469851, BMPR1b, BQ017638, BQ706262, BRP44, BU567141, BU753102, BX099483, C10orf114, C14orf162, C16orf30, C18orf1, C1orf108, C1orf113, C1orf26, C20orf112, C6orf81, CA314451, CA414006, CBLL1, CCDC4, CDC14b, CDC14c, CDYL2, CEBPd, CENPN, ChGn, CHIA, CHKA, CHST2, CLDN12, CLDN14, CLDN8, CTBP1, CUTL2, CXorf9, CYP1A1, CYP2U1, DDR2, DHCR24, DKFZp761P0423, DNAJB9, DOCK11, DOCK8, EAF2, EDG7, ELL2, ELOVL5, ELOVL7, EMP1, ENDOD1, ENST00000358356, ERN1, ERRFI1, F2RL1, FAM13A1OS, FER1L3, FGD4, FKBP5, FLJ31568, FLJ39502, FRK, FZD5, GADD45G, GIPR, GREB1, GSR, HERC3, HLA-DRB3, HOMER2, HPGd, HS3ST4, HSD17B2, IFI6, IGF1, IGF1R, IL20RA, IMPAD1, INPP4b, KCNMA1, KLF15, KLK3, KLK4, KLK5, KRT18, KRT19, KRT72, LAMA1, LDLR, LIFR, LOC205251, LOC401708, LOC641467, LOC646282, LOC730498, LONRF1, LOX, LRCH1, LRIG1, LSS, MAf, MAK, MALT1, MAP1b, MAP7D1, MBOAT2, MFSD2, MICAL1, MLPH, MOGAT2, MPZL1, MTMR9, NANOGP1, NAT1, NCAPD3, NDFIP2, NDRG1, NEBL, NEK10, NFKBIA, NNMT, NR4A1, NY-REN-7, ODC1, OLAH, ORM1, ORM2, OTUD7b, PACS1, PDLIM5, PECI, PER1, PFKFB2, PGc, PHACTR3, PNPLA8, PPP2Cb, RAB27A, RAB4A, RASD1, RHOU, RUNX1, S100A5, SCRG1, SGK, SHROOM3, SLC16A6, SLC26A2, SLC26A3, SLC2A14, SLC2A3, SLC38A4, SLC41A1, SLC45A3, SLITRK6, SMC4, SMOC1, SNAI2, SNTG2, SOCS2, SPDEf, SPDYA, SPINK5L3, SPOCK1, SPTb, ST6GALNAC1, STEAP4, STK17b, TACC1, TBRG1, TBX15, TG, TGFB2, TIPARP, TLOC1, TMCC3, TMPRSS2, TNFAIP3, TPD52, TRIM36, TRIM63, TTN, TUBA3d, WIPI1, WNT7b, WWTR1, X03757, ZBTB1, ZBTB16 and ZBTB24.
The ERG gene signature was generated by extracting 2-fold upregulated genes from RWPE and PC3 cells stably expressing ERG compared to respective LacZ expressing cells. GSEA was performed using this gene set on gene expression data obtained from the JQ1 and I-BET762 treated RWPE and PC3 cells. We also ran GSEA using gene set that was not changed upon expression of ERG to exclude the possibility that treatment with JQ1 and I-BET762 may change gene expression in a non-specific fashion. All of the gene expression array data (total 48) can be found at GEO # GSE55064.
Chromatin immunoprecipitation (ChIP) and ChIP-seq
The ChIP assays for BRD2, BRD3, BRD4, AR, RNA PolII, ERG and H3K27ac were performed using HighCell ChIP kit (Diagenode) according to manufacturer's protocol. The antibodies used for ChIP assay are AR_PG-21 (Millipore Cat. # 06-680) ; RNA Pol II (Abcam Cat. # ab5408); BRD2 (Bethyl Cat. # A302-583A) ; BRD3 (Bethyl Cat. # A302-368A) ; BRD4 (Bethyl Cat. # A301-985A); H3 (acetyl K27) (Abcam Cat. # ab4729) and IgG (Diagenode). For BRD2/3/4 ChIP-seq experiments with BET inhibitors, VCaP cells were treated with 500 nM JQ1 or I-BET762 for 12hrs. For AR signaling ChIP-seq experiments, VCaP cells were grown in charcoal-stripped serum containing media for 48hrs. followed by 6hrs. pre-treatment with vehicle or 500nM JQ1 or 10μM MDV3100 or 25μM Bicalutamide and then stimulated with 10nM DHT for 12hrs. For ERG ChIP-seq studies, VCaP cells were treated with 500nM JQ1 or vehicle for 12hrs. Next, cells were cross-linked for 10 min. with 1% formaldehyde. Cross-linking was terminated by the addition of 1/10 volume 1.25M glycine for 5 min. at room temperature followed by cell lysis and sonication (Bioruptor, Diagenode), resulting in an average chromatin fragment size of 200bp. Chromatin equivalent to 5×10⁶ cells were used for ChIP using various antibodies. ChIP DNA was isolated (IPure Kit, Diagenode) from samples by incubation with the antibody at 4°C overnight followed by wash and reversal of cross-linking. The ChIP-seq sample preparation for sequencing was performed according to the manufacturer's instructions (Illumina). ChIP-enriched DNA samples (1-10 ng) were converted to blunt-ended fragments using T4 DNA polymerase, E. coli DNA polymerase I large fragment (Klenow polymerase) and T4 polynuleotide kinase (New England BioLabs, NEB). A single A-base was added to fragment ends by Klenow fragment (3′ to 5′ exo minus; NEB) followed by ligation of Illumina adaptors (Quick ligase, NEB). The adaptor-modified DNA fragments were enriched by PCR using the Illumina Barcode primers and Phusion DNA polymerase (NEB). PCR products were size selected using 3% NuSieve agarose gels (Lonza) followed by gel extraction using QIAEX II reagents (QIAGEN). Libraries were quantified with the Bioanalyzer 2100 (Agilent) and sequenced on the Illumina HiSeq 2000 Sequencer (100 nucleotide read length).
ChIP-seq Analysis
ChIP-seq enrichment levels
ChIP enrichment levels within a peak (or site) were calculated from the sequencing data as follows: (1) reads were aligned to the HG19 reference genome using Bowtie232 with all default settings. (2) Aligned reads were sorted using NovoSort and exact duplicates were removed using Samtools33. (3) For each peak (site) overlapping reads were counted and this count was divided by the length of the peak or site. (4) To correct for differences in sequencing depth and alignment coverage the values are further normalized by the number of aligned reads per million.
ChIP-seq reproducibility plots
To assess the biological variability of AR and ERG ChIP-seq experiments we have compared enrichment levels of their respective replicates. For each replicate we called peaks using MACS with all default setting against an IgG control. We excluded peaks within genomic regions prone to technical-artifacts34. For each replicate pair we defined a set of concordant peaks as those overlapping in both replicates. For each concordant peak we calculated enrichment levels within the union of the two overlapping peaks. The scatter plots include all peaks with enrichment levels up-to the 99th percentile.
Overlaps of bromodomain proteins
We compared the genome-wide distribution of BRD2, BRD3, and BRD4 peaks in DMSO treated VcaP cells. First, we called peaks for each of the proteins using MACS with all default settings and IgG control. Since we are interested in peaks that are possibly biologically significant we used a moderately stringent significance cut-off (MACS score > 100). Next, we identified all genomic regions that were enriched for at least one of the proteins. Specifically, we “reduced” all stringent peaks using GenomicRanges35. For each of those regions we established which of the bromodomain proteins were enriched to count the number of overlaps.
Drug-induced changes of bromodomain protein enrichment levels
For each protein (BRD2, BRD3, BRD4) we assessed quantitative changes in their respective enrichment levels upon drug treatment (I-BET762, JQ1) relative to the levels in the DMSO control. First, peaks were called for all conditions and proteins as described above. Next, for each protein separately, we identified genomic that were enriched in any (union) of the treatment conditions (DMSO, I-BET762, or JQ1). Within those regions we quantified enrichment levels as described in (ChIP-seq enrichment levels). Since enrichment levels of different proteins are not directly comparable, we normalize all enrichments to the median level of the DMSO control.
Differential AR-BRD4 enrichment and AR-BRD4 overlap
HPeak, a Hidden Markov model (HMM)-based peak-calling software36 designed for the identification of protein-interactive genomic regions, was employed for ChIP-seq peak determination. For enrichment plots shown in Fig. 3a,c and d, identified peaks for each sample are centered by peak summit and average coverage per million was counted within 1500bp relative to the peak center. The overlap of AR- and BRD4- enriched regions were calculated by BEDtools37. The significance of overlap between AR and BRD4 binding was calculated using hypergeometric test based on the derived number of associated genes. The heatmap for AR peak enrichment was generated using python-based script on raw data and visualized using JavaTreeView38.
Differential ERG enrichment
We identified sites with significant differences in ERG levels between DMSO- and JQ1-treated cells. First we focused on concordant peaks (see ChIP-seq reproducibility plots) that were overlapping or in the +/- 5 kbp proximity of annotated gene loci. We defined a gene locus as the union of all of its known transcripts (Ensembl Genes 73). We used DESeq2 to assess the statistical significance of differences in ERG enrichment levels. Although DESeq2 was originally developed for RNA-seq its statistical model is well-suited to count data in general. We used the tools' default multiple hypothesis correction method and report peaks with significant differences in ERG levels (adjusted P-value < 0.1). To assess quantitative differences in ERG levels at significantly “gained” (positive difference in ERG levels upon JQ1 treatment) and “lost” (negative difference in ERG levels upon JQ1 treatment) we followed the same procedure as in (ChIP-seq enrichment levels).
Murine Prostate Tumor Xenograft Model
Four week-old male SCID C.B17 mice were procured from a breeding colony at University of Michigan maintained by our group. Mice were anesthetized using 2% Isoflurane (inhalation) and 2×10⁶ VCaP prostate cancer cells suspended in 100μl of PBS with 50% Matrigel (BD Biosciences) were implanted subcutaneously into the dorsal flank on both sides of the mice. Once the tumors reached a palpable stage (100mm3), the animals were randomized and treated with either 10mg/kg body weight MDV3100 or 50mg/kg body weight (doses previously used in mouse prostate cancer and multiple myeloma models11,39) by oral gavage or intraperitonially respectively for five days a week. Growth in tumor volume was recorded using digital calipers and tumor volumes were estimated using the formula (π/6) (L × W2), where L = length of tumor and W = width. Loss of body weight during the course of the study was also monitored. At the end of the studies mice were sacrificed and tumors extracted and weighed. Additionally, femur bone marrow, liver and spleen were harvested to determine spontaneous metastasis by measuring human-Alu sequence. Briefly, genomic DNA from femur bone marrow, liver and spleen were prepared using Puregene DNA purification system (Qiagen), followed by quantification of human ALU sequence by human Alu specific Fluorogenic TaqMan qPCR probes as described40,41. For CRPC experiment, VCaP tumor bearing mice were castrated when the tumors were approximately 200mm3 in size and once the tumor grew back to the pre-castration size were randomized and treated with JQ1 or vehicle (D5W) control. All procedures involving mice were approved by the University Committee on Use and Care of Animals (UCUCA) at the University of Michigan and conform to all regulatory standards.
Prostate Histology and hormone measurement
Four to five weeks old male SCID C.B17 mice were administered vehicle, 10mg/kg MDV3100 or 50mg/kg JQ1, by oral gavage or intraperitonially, respectively for five days a week. Highly hormone responsive seminal vesicles attached to prostate were harvested from mice after four weeks of injection. Prostate were fixed in formalin solution and processed for sectioning. Standard H&E staining was performed on the formalin fixed sections and were used to image the different lobes of the gland. To determine the testosterone levels, blood samples were collected by cardiac puncture from mice anesthetized with isoflurane. The serum was separated from the blood and stored at −80°C until assayed. Serum testosterone levels were measured by the Ligand Assay at University of Michigan-ULAM Pathology Cores for Animal Research.
Acknowledgments
We thank A. Paliakov, T. Barrette, Y. Qiao, P. Vats, R. Stender, X. Jiang, M. Pranithi and S. Han for technical assistance; C. Kumar-Sinha, M. Dhanasekaran, N. Palanisamy and P. Kunju for helpful discussions; J. Athanikar and K. Giles for critically reading the manuscript and submission of documents. This work was supported by Challenge Grant from the Prostate Cancer Foundation (PCF) and in part by the Early Detection Research Network (UO1 CA111275) and the NCI Prostate SPORE (P50CA69568) to A.M.C. A.M.C. is also supported by the Doris Duke Charitable Foundation, American Cancer Society, and A. Alfred-Taubman Institute. I.A.A. is supported by a PCF Young Investigator Award.
Footnotes
Potential conflict of interest: A.M.C. serves as an advisor to Hologic, Life Technologies, and Ventana/Roche and has formally served as an advisor to GSK and Constellation Pharmaceuticals. A.M.C. and S.W. are co-founders of Oncofusion Therapeutics which is developing novel BET bromodomain inhibitors.
Contributions: I.A.A. and A.M.C. conceived the study and the experiments. I.A.A. performed the experiments with assistance from V.L.D., R.M., S.D., C.E. and X.J.; X.W. carried out in vitro interaction studies; M.C., R.M. and I.A.A. analyzed microarray data; J.E., K.W. and F.Y.F performed mouse xenograft studies; Y.-M.W. generated ChIP-Seq libraries and X.C. performed the sequencing; M.C., R.Y., M.K. and Z.S.Q. performed ChIP-Seq analysis with input from I.A.A; S.W. provided compounds. I.A.A. and A.M.C. wrote the manuscript. All authors discussed the results and commented on the manuscript.
Accession Numbers: Gene expression and ChIP-seq coordinates have been deposited in the GEO database under accession number GSE55064.
References
- 1.Taylor BS, et al. Integrative genomic profiling of human prostate cancer. Cancer Cell. 2010;18:11–22. doi: 10.1016/j.ccr.2010.05.026. [DOI] [PMC free article] [PubMed] [Google Scholar]
- 2.Chen CD, et al. Molecular determinants of resistance to antiandrogen therapy. Nat Med. 2004;10:33–39. doi: 10.1038/nm972. [DOI] [PubMed] [Google Scholar]
- 3.Visakorpi T, et al. In vivo amplification of the androgen receptor gene and progression of human prostate cancer. Nat Genet. 1995;9:401–406. doi: 10.1038/ng0495-401. [DOI] [PubMed] [Google Scholar]
- 4.Stein MN, Goodin S, Dipaola RS. Abiraterone in prostate cancer: a new angle to an old problem. Clin Cancer Res. 2012;18:1848–1854. doi: 10.1158/1078-0432.CCR-11-1805. [DOI] [PMC free article] [PubMed] [Google Scholar]
- 5.Reid AH, et al. Significant and sustained antitumor activity in post-docetaxel, castration-resistant prostate cancer with the CYP17 inhibitor abiraterone acetate. J Clin Oncol. 2010;28:1489–1495. doi: 10.1200/JCO.2009.24.6819. [DOI] [PMC free article] [PubMed] [Google Scholar]
- 6.de Bono JS, et al. Abiraterone and increased survival in metastatic prostate cancer. N Engl J Med. 2011;364:1995–2005. doi: 10.1056/NEJMoa1014618. [DOI] [PMC free article] [PubMed] [Google Scholar]
- 7.Mukherji D, Pezaro CJ, De-Bono JS. MDV3100 for the treatment of prostate cancer. Expert Opin Investig Drugs. 2012;21:227–233. doi: 10.1517/13543784.2012.651125. [DOI] [PubMed] [Google Scholar]
- 8.Scher HI, et al. Increased survival with enzalutamide in prostate cancer after chemotherapy. N Engl J Med. 2012;367:1187–1197. doi: 10.1056/NEJMoa1207506. [DOI] [PubMed] [Google Scholar]
- 9.Lockwood WW, Zejnullahu K, Bradner JE, Varmus H. Sensitivity of human lung adenocarcinoma cell lines to targeted inhibition of BET epigenetic signaling proteins. Proc Natl Acad Sci U S A. 2012;109:19408–19413. doi: 10.1073/pnas.1216363109. [DOI] [PMC free article] [PubMed] [Google Scholar]
- 10.Dawson MA, et al. Inhibition of BET recruitment to chromatin as an effective treatment for MLL-fusion leukaemia. Nature. 2011;478:529–533. doi: 10.1038/nature10509. [DOI] [PMC free article] [PubMed] [Google Scholar]
- 11.Delmore JE, et al. BET bromodomain inhibition as a therapeutic strategy to target c-Myc. Cell. 2011;146:904–917. doi: 10.1016/j.cell.2011.08.017. [DOI] [PMC free article] [PubMed] [Google Scholar]
- 12.Puissant A, et al. Targeting MYCN in Neuroblastoma by BET Bromodomain Inhibition. Cancer Discov. 2013;3:308–323. doi: 10.1158/2159-8290.CD-12-0418. [DOI] [PMC free article] [PubMed] [Google Scholar]
- 13.Filippakopoulos P, et al. Selective inhibition of BET bromodomains. Nature. 2010;468:1067–1073. doi: 10.1038/nature09504. [DOI] [PMC free article] [PubMed] [Google Scholar]
- 14.Attard G, Richards J, de Bono JS. New strategies in metastatic prostate cancer: targeting the androgen receptor signaling pathway. Clin Cancer Res. 2011;17:1649–1657. doi: 10.1158/1078-0432.CCR-10-0567. [DOI] [PMC free article] [PubMed] [Google Scholar]
- 15.Jang MK, et al. The bromodomain protein Brd4 is a positive regulatory component of P-TEFb and stimulates RNA polymerase II-dependent transcription. Mol Cell. 2005;19:523–534. doi: 10.1016/j.molcel.2005.06.027. [DOI] [PubMed] [Google Scholar]
- 16.Yang Z, et al. Recruitment of P-TEFb for stimulation of transcriptional elongation by the bromodomain protein Brd4. Mol Cell. 2005;19:535–545. doi: 10.1016/j.molcel.2005.06.029. [DOI] [PubMed] [Google Scholar]
- 17.Loven J, et al. Selective inhibition of tumor oncogenes by disruption of super-enhancers. Cell. 2013;153:320–334. doi: 10.1016/j.cell.2013.03.036. [DOI] [PMC free article] [PubMed] [Google Scholar]
- 18.Mertz JA, et al. Targeting MYC dependence in cancer by inhibiting BET bromodomains. Proc Natl Acad Sci U S A. 2011;108:16669–16674. doi: 10.1073/pnas.1108190108. [DOI] [PMC free article] [PubMed] [Google Scholar]
- 19.Wu SY, Lee AY, Lai HT, Zhang H, Chiang CM. Phospho switch triggers brd4 chromatin binding and activator recruitment for gene-specific targeting. Mol Cell. 2013;49:843–857. doi: 10.1016/j.molcel.2012.12.006. [DOI] [PMC free article] [PubMed] [Google Scholar]
- 20.Tomlins SA, et al. Recurrent fusion of TMPRSS2 and ETS transcription factor genes in prostate cancer. Science. 2005;310:644–648. doi: 10.1126/science.1117679. [DOI] [PubMed] [Google Scholar]
- 21.Devaiah BN, et al. BRD4 is an atypical kinase that phosphorylates serine2 of the RNA polymerase II carboxy-terminal domain. Proc Natl Acad Sci U S A. 2012;109:6927–6932. doi: 10.1073/pnas.1120422109. [DOI] [PMC free article] [PubMed] [Google Scholar]
- 22.Belkina AC, Denis GV. BET domain co-regulators in obesity, inflammation and cancer. Nat Rev Cancer. 2012;12:465–477. doi: 10.1038/nrc3256. [DOI] [PMC free article] [PubMed] [Google Scholar]
- 23.Chen Y, et al. ETS factors reprogram the androgen receptor cistrome and prime prostate tumorigenesis in response to PTEN loss. Nat Med. 2013;19:1023–1029. doi: 10.1038/nm.3216. [DOI] [PMC free article] [PubMed] [Google Scholar]
- 24.Matzuk MM, et al. Small-molecule inhibition of BRDT for male contraception. Cell. 2012;150:673–684. doi: 10.1016/j.cell.2012.06.045. [DOI] [PMC free article] [PubMed] [Google Scholar]
- 25.Lin TH, et al. Anti-androgen receptor ASC-J9 versus anti-androgens MDV3100 (Enzalutamide) or Casodex (Bicalutamide) leads to opposite effects on prostate cancer metastasis via differential modulation of macrophage infiltration and STAT3-CCL2 signaling. Cell Death Dis. 2013;4:e764. doi: 10.1038/cddis.2013.270. [DOI] [PMC free article] [PubMed] [Google Scholar]
- 26.Harris WP, Mostaghel EA, Nelson PS, Montgomery B. Androgen deprivation therapy: progress in understanding mechanisms of resistance and optimizing androgen depletion. Nat Clin Pract Urol. 2009;6:76–85. doi: 10.1038/ncpuro1296. [DOI] [PMC free article] [PubMed] [Google Scholar]
- 27.Taplin ME, et al. Selection for androgen receptor mutations in prostate cancers treated with androgen antagonist. Cancer Res. 1999;59:2511–2515. [PubMed] [Google Scholar]
- 28.Sun S, et al. Castration resistance in human prostate cancer is conferred by a frequently occurring androgen receptor splice variant. J Clin Invest. 2010;120:2715–2730. doi: 10.1172/JCI41824. [DOI] [PMC free article] [PubMed] [Google Scholar]
- 29.Grasso CS, et al. The mutational landscape of lethal castration-resistant prostate cancer. Nature. 2012;487:239–243. doi: 10.1038/nature11125. [DOI] [PMC free article] [PubMed] [Google Scholar]
- 30.Balbas MD, et al. Overcoming mutation-based resistance to antiandrogens with rational drug design. Elife. 2013;2:e00499. doi: 10.7554/eLife.00499. [DOI] [PMC free article] [PubMed] [Google Scholar]
- 31.Subramanian A, et al. Gene set enrichment analysis: a knowledge-based approach for interpreting genome-wide expression profiles. Proc Natl Acad Sci U S A. 2005;102:15545–15550. doi: 10.1073/pnas.0506580102. [DOI] [PMC free article] [PubMed] [Google Scholar]
- 32.Langmead B, Salzberg SL. Fast gapped-read alignment with Bowtie 2. Nat Methods. 2012;9:357–359. doi: 10.1038/nmeth.1923. [DOI] [PMC free article] [PubMed] [Google Scholar]
- 33.Li H, et al. The Sequence Alignment/Map format and SAMtools. Bioinformatics. 2009;25:2078–2079. doi: 10.1093/bioinformatics/btp352. [DOI] [PMC free article] [PubMed] [Google Scholar]
- 34.Pickrell JK, Gaffney DJ, Gilad Y, Pritchard JK. False positive peaks in ChIP-seq and other sequencing-based functional assays caused by unannotated high copy number regions. Bioinformatics. 2011;27:2144–2146. doi: 10.1093/bioinformatics/btr354. [DOI] [PMC free article] [PubMed] [Google Scholar]
- 35.Lawrence M, et al. Software for computing and annotating genomic ranges. PLoS Comput Biol. 2013;9:e1003118. doi: 10.1371/journal.pcbi.1003118. [DOI] [PMC free article] [PubMed] [Google Scholar]
- 36.Qin ZS, et al. HPeak: an HMM-based algorithm for defining read-enriched regions in ChIP-Seq data. BMC Bioinformatics. 2010;11:369. doi: 10.1186/1471-2105-11-369. [DOI] [PMC free article] [PubMed] [Google Scholar]
- 37.Quinlan AR, Hall IM. BEDTools: a flexible suite of utilities for comparing genomic features. Bioinformatics. 2010;26:841–842. doi: 10.1093/bioinformatics/btq033. [DOI] [PMC free article] [PubMed] [Google Scholar]
- 38.Saldanha AJ. Java Treeview--extensible visualization of microarray data. Bioinformatics. 2004;20:3246–3248. doi: 10.1093/bioinformatics/bth349. [DOI] [PubMed] [Google Scholar]
- 39.Tran C, et al. Development of a second-generation antiandrogen for treatment of advanced prostate cancer. Science. 2009;324:787–790. doi: 10.1126/science.1168175. [DOI] [PMC free article] [PubMed] [Google Scholar]
- 40.Asangani IA, et al. Characterization of the EZH2-MMSET histone methyltransferase regulatory axis in cancer. Mol Cell. 2013;49:80–93. doi: 10.1016/j.molcel.2012.10.008. [DOI] [PMC free article] [PubMed] [Google Scholar]
- 41.van der Horst EH, Leupold JH, Schubbert R, Ullrich A, Allgayer H. TaqMan-based quantification of invasive cells in the chick embryo metastasis assay. Biotechniques. 2004;37:940–942. 944, 946. doi: 10.2144/04376ST02. [DOI] [PubMed] [Google Scholar]
- 42.Gao L, et al. Androgen receptor promotes ligand-independent prostate cancer progression through c-Myc upregulation. PLoS One. 2013;8:e63563. doi: 10.1371/journal.pone.0063563. [DOI] [PMC free article] [PubMed] [Google Scholar]