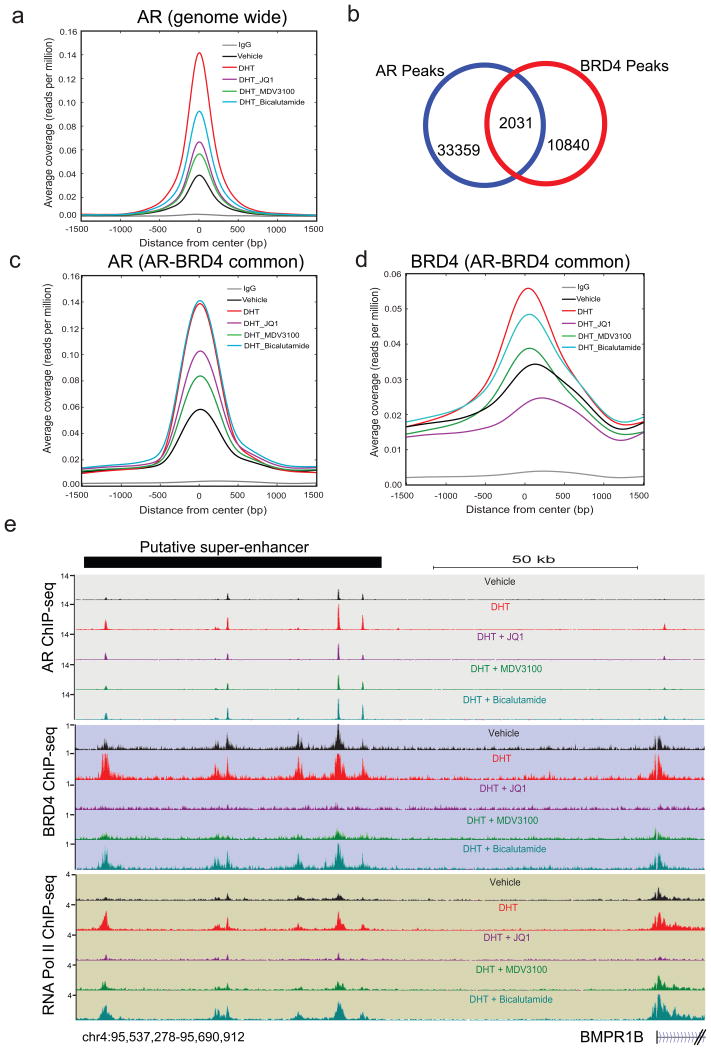
Figure 3. BET bromodomain inhibition disrupts AR and BRD4 binding to target loci.
a, AR ChIP-seq was performed in VCaP cells treated for 12hr with vehicle, DHT (10nM), DHT+JQ1 (500nM), DHT+MDV3100 (10μM) or DHT+Bicalutamide (25μM). Summary plot of AR enrichment (average coverage) across ARBs (AR Binding sites) in different treatment groups is shown. Data represent one of the two biological replicates. b, Venn diagram illustrating the overlap of AR and BRD4 enriched peaks in DHT treated sample. c, and d, Summary plot for AR and BRD4 enrichment for the AR-BRD4 overlapping (2,031) regions. e, Genome browser representation of AR, BRD4 and RNA PolII binding events on a putative “super-enhancer” of the AR-regulated BMPR1B gene. The y-axis denotes reads per million per base pair (rpm/bp). The x-axis denotes the genomic position with a scale bar on top right. The putative super-enhancer region enriched for AR, BRD4 and RNA PolII is depicted with a black bar on the top left.

