

Abstract
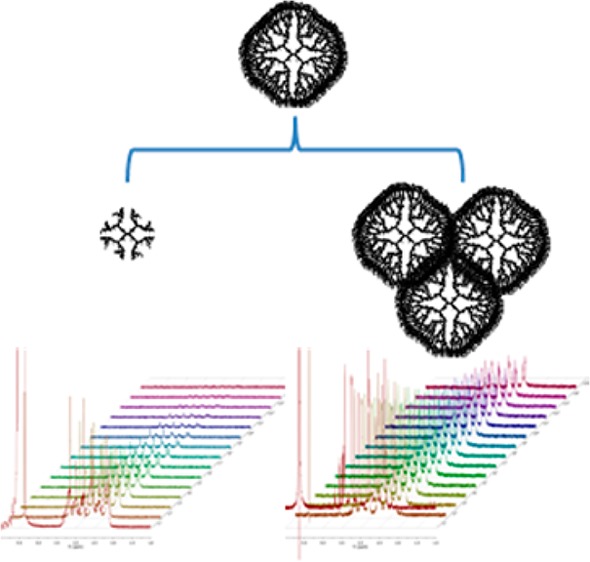
Commercial generation-five poly(amidoamine) dendrimer material (G5c) was fractionated into its major structural components. Monomeric G5 (G5m; 21–30 kDa) was isolated to compare its functional properties to the G5c material. Diffusion-ordered nuclear magnetic resonance spectroscopy was employed to measure the self-diffusion coefficients and corresponding hydrodynamic radii of G5m and other G5c components as a function of dendrimer size (i.e., molecular weight) and tertiary structure (i.e., generational or oligomeric nature). It was found that the hydrodynamic radius (RH) scales with approximate numbers of atoms in the trailing generations, G5m, and oligomeric material at a rate of RH ∝ N0.35, in good agreement with previous reports of RH scaling for PAMAM dendrimer with generation. G5c materials can be thought of as a heterogeneous mixture of dendrimers ranging in size from trailing generation two to tetramers of G5, approximately the same in size as a G7 dendrimer, with G5m comprising ∼65% of the material. The radius of hydration for G5m was measured to be 3.1 ± 0.1 nm at pH 7.4. The 10% swelling in response to a drop in pH observed for the G5c material was not observed for isolated G5m; however, the isolated G5–G5 dimers had an increase of 44% in RH, indicating that the G5c pH response results from the increase in RH of the oligomeric fraction upon protonation. Finally, the data allow for an experimental test of the “slip” and “stick” boundary models of the Stokes–Einstein equation for PAMAM dendrimer in water.
Introduction
Poly(amidoamine) (PAMAM) dendrimers have attracted significant interest since they were first synthesized by Tomalia et al. in 1985.1 The dendritic architecture has many properties that are interesting from both materials and biological standpoints, including the scaling of size and number of functional groups with generation. The dynamics of the branches of PAMAM dendrimers have also been shown to vary as a function of generation, with lower generations (G0–G5) being highly flexible and having the ability to fold branches into the core region. For higher generations (≥G6), the branches are tightly packed and the dendrimer shape becomes more like a sphere, although backfolding of terminal groups is still observed.2,3 The primary and secondary amines of PAMAM dendrimer are protonated at different pH levels, allowing for swelling and conformational changes as a function of pH.4−8 G5 PAMAM is particularly interesting for biological applications because of its size, which is large enough to solubilize multiple hydrophobic entities yet small enough to diffuse through tissue, making it an excellent scaffold for a variety drug and gene delivery applications.9−12
Physical properties of PAMAM dendrimer such as size and diffusion rate impact important biological properties including pharmacodynamics and biodistribution. Several studies have shown that molecular weight, radius, diffusion rates, and the density profiles of PAMAM all scale with generation.2,13−16 For considering biological applications, radius of hydration (RH) is a parameter of particular interest because detailed knowledge of this value is needed for understanding both diffusion through and localization in biological tissue. The pH response is important as well, particularly from the range of 7.4 to 3, which is the range of tissue and cytosol to that of lysosomes. For G5 PAMAM, reported values for RH range from 2.217 to 3.47 for pH 7.4 with values as high as 4.87 nm reported under acidic conditions. This gives a reported range of hydrodynamic volume from 45 to 165 nm3 at pH 7.4 and a potential increase in volume up to 463 nm3 upon protonation in acidic media. This is a wide range of possible values at physiological pH with large consequences for expected biological properties. The dramatic volume change upon acidification has significant implications for the behavior of these materials in endosomes and lysosomes, where they are known to accumulate.18 Given the importance of these values for understanding key issues in drug and gene delivery, it is important to understand how the various molecular weight (MW) fractions making up commercial G5 PAMAM dendrimer contribute to the measured volumes and volume changes as a function of pH. In addition, the hydrodynamic radii and volume values for a narrow MW fraction G5 PAMAM dendrimer free of trailing generations and oligomers are desired to provide data related to the biodistribution of this fraction and for better comparison with theoretical calculations that employ ideal dendrimer structures. Most previous studies have employed unpurified commercial grade materials, and this may contribute to the substantial range of values present in the literature.
Recent work by van Dongen et al. indicates that as-received biomedical grade G5 PAMAM dendrimer contains ∼35% trailing and oligomeric material fractions by mass.19 The resolution of these components, which is improved as compared with many previous reports,7,20,21 was made possible by increased resolution of mass fractions using reverse-phase ultrahigh performance liquid chromatography (rp-UPLC) and a C18 column. Using these methods, the amounts of trailing generations and high oligomers were quantified. In particular, it was possible to resolve the significant amounts of trailing generation four and dimer from the G5 monomer (G5m) PAMAM peak. The presence of trailing generations one to four (T1–T4) and dimers, trimers, and tetramers of G5 is anticipated to have a significant impact on previous RH measurements of commercial material, including pH response. Previous measurements of G0–G3 PAMAM have indicated little size response as a function of pH, whereas materials similar in size to the oligomers, such as G6 and G7 PAMAM, are reported to have a substantially larger pH response than G5 PAMAM.
In the present work, semipreparative scale reverse-phase high-performance liquid chromatography (rp-HPLC) was employed to separate commercial G5 PAMAM (G5c) material into its constituent fractions including trailing generations T1–T3, G5m (21–30 kDaA fraction, 93 −NH2 terminated arms, PDI = 1.019), and dimer, trimer, and tetramer of G5. The G5m fraction, which represents ∼65% of the as-received G5c material, contains the entire distribution of branching type defects (i.e., missing arms and intramolecular loops) with structurally perfect G5 present as <0.01% of the mixture. Although these branching defects are so numerous as to make it impossible to isolate structurally perfect G5 for study by these methods, this technique does allow isolation of G5m free of T1–T4 and G5-derived oligomers. Diffusion-order spectroscopy (DOSY) NMR was employed to study the scaling of diffusion, radius, and pH response for all isolated fractions. It was found that the self-diffusion of the isolated dendrimer structures scaled at a rate of R ∝ N0.35, in good agreement with previous studies of scaling by generation. In addition, G5m shows little pH response with RH of 3.1(±0.1) versus 3.2 nm for pH 7 and 3, respectively; however, a substantial response is observed for the dimer fraction with RH of 4.4 versus 5.9 nm for pH 7 and 3, respectively. In other words, G5m undergoes a hydrodynamic volume change of just 10%, whereas the dimer undergoes a hydrodynamic volume change of 140%. This study indicates that important physical properties relevant to biomedical application ascribed to G5 PAMAM dendrimer arise from components present as part of the mixture that makes up commercial grade G5 PAMAM material.
Experimental Section
Biomedical-grade G5 PAMAM dendrimer was purchased from Dendritech in Midland, MI, and G3 PAMAM dendrimer from Sigma-Aldrich. Dendrimer samples labeled “G5c” (commercial G5) or “G3c” (commercial G3) were used as received. Trailing generation and oligomer structures were isolated from G5c using semipreparative rp-HPLC according to previously published protocols.19 All other chemicals were purchased from Sigma-Aldrich or Fisher Scientific and used as received.
Preparation of Deuterated NMR Buffer Solutions
A pH 3 buffer was prepared from 51.4 mg potassium hydrogen phthalate, 58 μL of 2 M deuterium chloride, and 2442 uL of deuterium oxide, and then a 1:2 dilution was performed. A pH 5 buffer was prepared using 53.2 mg of potassium hydrogen phthalate, 57 μL of 2 M sodium deuteroxide, and 944 μL of deuterium oxide, and then a 1:5 dilution was performed. A pH 7 buffer was prepared using 32.2 mg potassium dihydrogen phosphate, 73 μL of 2 M sodium deuteroxide, and 427 μL of deuterium oxide, and then a 1:10 dilution was performed. A pH 9 buffer was prepared using 73.7 mg disodium hydrogen phosphate, 11.8 μL of 2 M deuterium chloride, and 2488 μL of deuterium oxide, and then a 1:2 dilution was performed. A pH 11 buffer was prepared using 137.1 mg of disodium hydrogen phosphate, 347 μL of 0.1 M sodium deuteroxide, and 653 μL of deuterium oxide. The dendrimer solutions were prepared at ∼0.032 M (with respect to protonatable primary amines), whereas the buffering capacities ranged from 0.05 to 0.1 M.
Chromatographic Methods
The semiprep rp-HPLC, rp-UPLC, and GPC protocols employed here have been previously reported.19,22
DOSY NMR Spectroscopy
NMR samples were prepared in deuterium oxide or a deuterated buffer at a concentration of 10 mg/mL (within the infinite dilution range for these samples at 0.1–2.1 mM).23 Spectra were obtained on a Varian VNMRS 700 apparatus employing DOSY_for_VnmrJ_3.x software. The temperature was set to 30 °C, and samples were allowed to equilibrate for no fewer than 15 min. 1H NMR spectra were obtained prior to diffusion experiments. The DOSY gradient-compensated stimulated echo with spin lock and convection compensation (DgcsteSL_cc) pulse sequence was employed with a diffusion gradient length of 4.0 ms and a diffusion delay of 200 ms. A 10 s relaxation delay was employed with a total of 16 scans. For analysis, the entire spectral region from 3.7 to 2.3 ppm was used and arbitrarily set to an integral value of 100 for the gradient field strength (G) of 0 G/cm for each sample.
Results and Discussion
Dendrimer components were isolated by semipreparative rp-HPLC. Six samples were obtained from the commercial material: trailing generation 2 (T2), trailing generation 3 (T3), G5m, (G5)2 dimer, (G5)3 trimer, and (G5)4 tetramer (Figure 1). Sufficient resolution was not achieved to obtain an independent fraction of T4, which elutes as a left shoulder on the G5m peak. Also, T4–T4 dimers are expected to coelute with G5m because they have the same expected molecular weight. The G5 dimer peak has ∼14% of the area of the G5m peak; therefore, a T4 dimer would be expected to have ≤14% area than the T4 peak. This translates to <1.5% of the G5m peak so that convolution of T4 dimer behavior with G5m behavior is expected to be small. The structural assignments were confirmed by GPC (Table 1). All possible defects apart from oligomerization (i.e., incomplete Michael’s addition and intramolecular loop formation) lead to lower-than-theoretical molecular weights. As such, all observed molecular weights are lower than theoretically predicted. The rate of structural defect formation was estimated to be 7–15%.19 In other words, ∼1 out of every 10 branching reactions result in a defective arm, reducing the number of primary amines and molecular weight available each generation. The effect is small in previous generations, with only about three defects expected for a G3. However, during the synthesis of G5c, on average 10 new defects form per dendrimer. This causes a significant reduction in molecular weight of the material. This effect is greater in the oligomer structures due to the compounding of skeletal defects, as is observed by the further deviation from the theoretical molecular weight.
Figure 1.
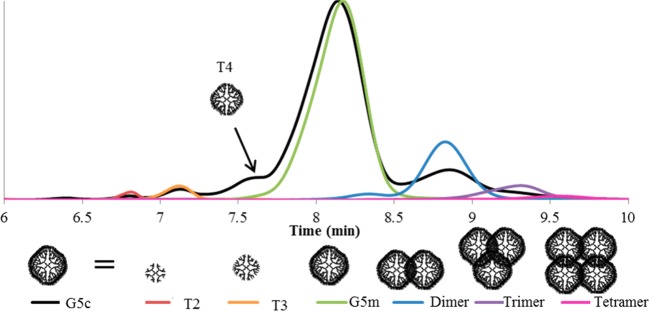
UPLC chromatograms of commercial (black trace) and isolated fractions (overlaid colored traces). T4 appears as a left-hand shoulder to the G5m peak but cannot be isolated without substantial G5m also present.
Table 1. Summary of GPC Results Compared with Theoretical Values for Isolated Samples.
| sample | theoretical MW | Mn | Mw | PDI |
|---|---|---|---|---|
| G5c | 28 826 | 28 270 | 30 820 | 1.09 |
| T2 | 3256 | 4755 | 7415 | 1.56 |
| T3 | 6909 | 6260 | 6890 | 1.05 |
| G5m | 28 826 | 25 130 | 27 140 | 1.08 |
| dimer | 57 652 | 45 140 | 46 020 | 1.02 |
| trimer | 86 478 | 61 330 | 63 910 | 1.04 |
| tetramer | 115 304 | 72 400 | 75 950 | 1.05 |
Each isolated fraction was then examined using diffusion NMR to measure self-diffusion coefficients (D) and hydrodynamic radii (RH). Larger structures diffuse more slowly, which can be observed by the spin–echo signal changes due to the distribution of special displacements of the resonant nuclei in a magnetic field with gradient and nuclear magnetic relaxation processes.24 Experimentally, a change in the rate of signal decay in a pulse field gradient NMR experiment is observed (Figure 2). The theoretical development of this analysis has been thoroughly described elsewhere.24−26 The self-diffusion coefficient can be determined from the slope of the Stejskal–Tanner plot, which relates it to signal intensity by the following equation
where G is the gradient field strength (in Gauss/cm), I is the integral of the peak area at a given value G, I0 is the integral of the peak area at G = 0, γ is the magnetogyric constant of the nucleus (2.675 × 10⁸ T–1 s–1 for 1H), δ is the diffusion gradient length parameter (4.0 ms), Δ is the diffusion delay (100.0 ms), and D is the self-consistent diffusion coefficient. The Stejskal–Tanner plots of G5c, G5m, and all other isolated fractions are shown in Figure 3.
Figure 2.

Examples of Arrayed DOSY spectra of (a) G5c, (b) G5m, (c) T2, and (d) G5 tetramer in D2O.
Figure 3.
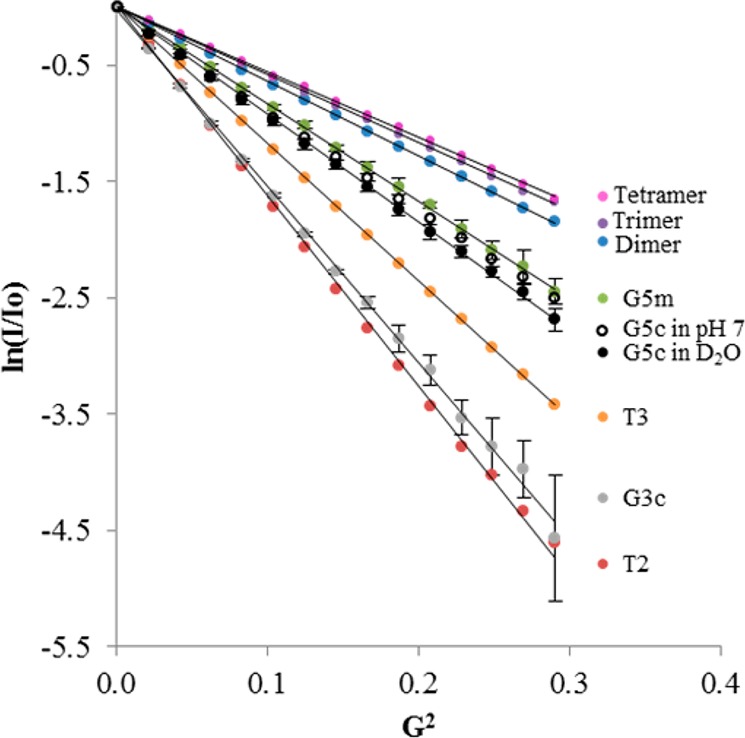
Stejskal–Tanner plots of commercial and isolated samples dissolved in D2O. G5m, G5c, and G3c represent an average of five runs with standard error.
The diffusion coefficient is related to the hydrodynamic radius by the Stokes–Einstein equation (with stick boundary conditions)
where kB is the Boltzmann constant, T is the temperature (in K), and η is the viscosity of the solution (∼9.7 cP for D2O at 30 °C).27 The diffusion coefficients and hydrodynamic radii obtained for the isolated dendrimer structures are summarized in Table 2.
Table 2. Summary of Diffusion Coefficients and Hydrodynamic Radii Data for Commercial G5c, G5m, and All Other Isolated Fractions When Dissolved in D2O.
| T2 | T3 | G5m | dimer | trimer | tetramer | G3c | G5c | |
|---|---|---|---|---|---|---|---|---|
| D (m/S2) × 10–11 | 14.4 | 10.4 | 7.49 ± 0.12 | 5.681 | 5.19 | 4.99 | 13.6 ± 0.06 | 8.21 ± 0.25 |
| RH (nm) | 1.6 | 2.2 | 3.1 ± 0.1 | 4.0 | 4.4 | 4.6 | 1.7 ± >0.01 | 2.8 ± 0.1 |
Dendrimer radius increases with generation (along with molecular weight), and it is expected that D should also be a function of dendrimer generation. Prosa et al. employed small-angle X-ray scattering (SAXS) to show that the radius of gyration (RG) of PAMAM (synthesized at Michigan Molecular Institute) scaled as a function of generation (R ∝ N1/3 for ≥ G3, RG of G5c = 2.41 nm). The results indicate that the surface density increases with generation until at higher generations (G6) the density becomes generation-independent and the dendrimers are best modeled as densely packed.15,16 Urban et al. used molecular modeling in addition to SAXS to study G0–G8. RG for a structurally perfect G5 monomer was calculated to be 3.6 nm but was only 2.3 nm for G5c material, as measured by SAXS. The authors concluded that RG is generationally dependent, with a change from flexible to compact structures at higher generations and also concluded that R ∝ N1/3 for ≥ G3.13 Maiti and Goddard et al. employed full atomistic MD studies to show that radius scaled as R ∝ N1/3 for structurally perfect G0–G11 PAMAM, where N is the number of atoms or repeat units in the dendrimer. The authors also report that up until at least G6 the idealized dendrimer structures are highly flexible under the conditions studied (gas phase).14 Canetta and Maino employed molecular dynamics on structurally perfect PAMAM to show that a dynamic transition occurs from G5 to G6 and that diffusion constants vary nonlinearly with generation. Their simulations also showed that the radius of gyration scales as R ∝ N1/3.2
For G5c and all of the dendrimer fractions isolated from this mixture, diffusion constants and hydrodynamic radii scale with molecular weight. The sample with the smallest molecular weight (T2 at 4755 Da or ∼16% of the expected value for structurally perfect G5 monomer) diffused the fastest (1.44 × 10⁻¹⁰ m/s2) at almost twice the rate of the G5c. This corresponds to the smallest observed hydrodynamic radius (1.6 nm), just over 60% of the average value for G5c. By way of comparison, G5 tetramer (74 400 Da or 250% of the theoretical value for perfect G5) diffused at only half the rate and has a radius nearly 150% larger than that observed for G5c. Overall, this leads to the conclusion that the G5c material, with an average hydrodynamic volume of ∼91 nm3, consists of particles ranging from 17 to 408 nm3. These are substantially different values that will result in different pharmacodynamics and biodistribution.28,29
The observed D and RH values of the material fractionated from G5c scale with molecular weight. A similar trend was observed by Jiménez et al. where diffusion coefficients of low commercial generation dendrimer materials were shown to scale exponentially with the number of atoms in the dendrimer
where N is the number of atoms and α is a solvent-dependent scaling constant.23 In this relationship, a “good solvent”, in which solvent–dendrimer interaction is favored over self-interaction of the branches, α has a theoretical value of −0.5.30,31 Jiménez et al. found that for low-generation commercial PAMAM (G0–G3), scaling was pH-dependent with α = −0.50 at pH 7 (a “good” solvent) and α = −0.39 at pH 12 (a “poor” solvent with significant backfolding of the dendrimer arms). For the isolated structures studied in this work, an exact atomistic count is not available or reasonable, given that branching defects are more prevalent at higher generations. However, for a given material fraction it is a good approximation to assume that the number of atoms is proportional to molecular weight. Therefore, each sample fraction was assigned a number of atoms based on the percentage of atoms in a perfect G5 dendrimer. For example, a perfect G5 dendrimer would contain 4676 atoms. The G5m in this study had a molecular weight that is 87% of this value; it was therefore hypothesized to have 4076 atoms. Figure 4 gives the log–log representation of the D to N relationship. From the slope of this relationship, the scaling factor α = −0.35. This is significantly lower than that observed for neutral low-generation dendrimers (−0.5 in neutral pH) and indicates a change in material distribution related to increased backfolding of dendrimer arms.23 However, the isolated samples were washed with a pH 7.4 buffer, giving solutions of a lower pH (∼7 based on the observed pH-dependent chemical shifts19) than solutions of commercial material dissolved directly into water (typically pH ∼12). This value of α is much closer to that reported for low-generation dendrimers at high pH, where significant backfolding is expected to occur. This suggests that even at neutral pH the primary amines spend a significant fraction of time folded into the dendrimer core. The commercial materials were excluded from this analysis because the molecular weight does not accurately represent the large mass distribution (and therefore atomistic distribution) of species in the sample. However, both G3c and G5c had self-diffusion coefficients ∼16% faster than predicted by this relationship. These commercial materials are mixtures of many generations and oligomers of dendrimer. In NMR, signal intensity is a function of concentration; therefore, the skewing toward fast diffusion (i.e., smaller entities) may be the result of relatively higher molar concentrations of trailing generations present in the fractions. To test this idea, an estimated value of D for G5c was computed by taking the population weighted average (percentages from peak fitting of chromatogram of G5c in Figure 1) of the experimental values of D measured for the individually measured T2 (0.8%), T3 (2.3%), G5m (74.9%), dimer (11.7%), trimer (2.3%), and tetramer (<0.5%) species and taking computed values for D for T1 (<0.5%) and T4 (7.6%) from the best-fit line in Figure 4. The resulting value of 7.50 × 10⁻¹¹ m/s2 is within 10% of the measured value of 8.21 × 10⁻¹¹ m/s2 for G5c.
Figure 4.
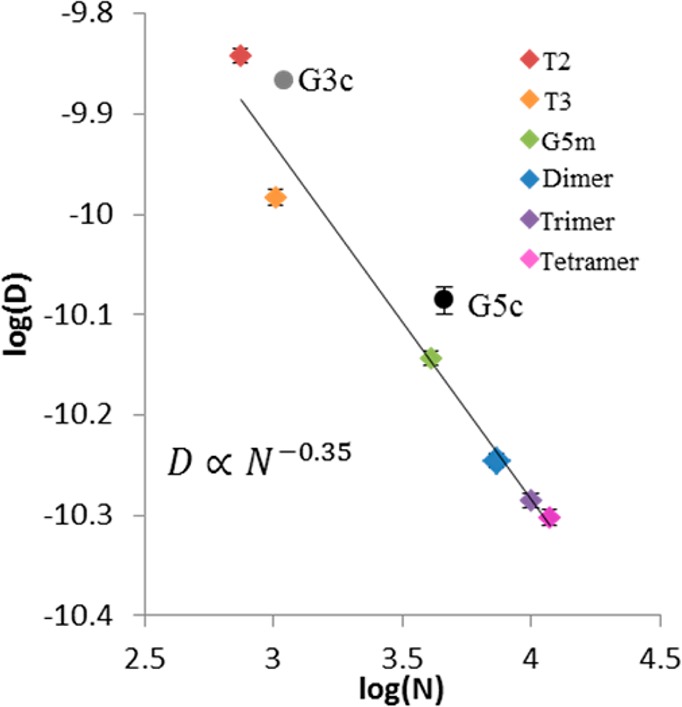
log–log representation of the scaling of diffusion coefficients versus the approximate number of atoms for each dendrimer species. The commercial G5c and G3c mixtures are shown but not included in the best-fit line calculation. Values of D are taken from the slopes of the Stejskal–Tanner plots in Figure 3 of dendrimer samples dissolved into D2O. Error bars for G3c, G5c, and G5m were experimentally determined, whereas error for remaining samples was estimated by averaging the three experimental errors.
An analogous analysis was performed to describe the scaling of RH for the isolated samples as a function of numbers of atoms. It was determined that RH ∝ N0.35, which is very close to the previously reported relationship of R ∝ N1/3 for dendrimers by generation.2,14 This indicates that the trailing and oligomer material fractions isolated from G5c behave nearly identically to lower and higher generation dendrimers. As a result, the G5c dendrimer may be viewed as a mixture of G2–G5 dendrimers with the dimer, trimer, and tetramer behaving similarly in terms of scaling to monomers with the same number of atoms (i.e., G5 tetramer is similar to G7).
Another interesting result of the Stejskal–Tanner analysis is that G5m appears to have a slightly larger RH than the G5c mixture. Interestingly, doubling the reported hydrodynamic radius for the commercial material (2.8 ± 0.1 nm) gives a close match to the diameter reported by the manufacturer, Dendritech, of 5.4 nm. By way of contrast, the isolated G5m fraction has an RH value of 3.1 ± 0.1 nm, which is in agreement with the value reported by Bányai et al. for a purified commercial G5 sample in deuterium oxide (reported to contain 90% G5m, 8% dimer, and 2% T4).32 The apparent larger size arises from the fact that dissolving G5m in D2O results in a pH of ∼7, whereas dissolving G5c in D2O gives a solution of pH ∼12. This difference arises from the use of pH 7.4 buffers in the preparation of G5m. When DOSY is used to obtain the value for RH under controlled pH conditions the values are the same within error (vida infra).
Solvated conditions are especially important for describing the behavior of dendrimers. In aqueous environments, protonation of the amines can influence backfolding and swelling in addition to generational effects. For example, Maiti and Goddard et al. initially demonstrated by MD that the radius of gyration of a structurally perfect G5 dendrimer swells from 2.1 nm at pH 10 to 2.5 nm at pH 7. Their results also indicate that significant backfolding occurs at all protonation levels.33 DOSY NMR experiments have been employed to study the diffusion properties of PAMAM in methanol26 and aqueous17,23 environments. Jiménez et al. reported that both diffusion and hydrodynamic radii scale with dendrimer generation (from G0 to G3 commercial materials) and that pH-induced swelling increases at higher generations.23 Bányai et al. employed DOSY NMR to study commercial G5 PAMAM materials with amine and carboxylate surface groups in aqueous environments. Amine-terminated G5c material in deuterium oxide had a measured RH of 3.05 nm, which they interpreted as the G5c behaving as a hard-sphere colloid with significant swelling upon hydration. A scaling of diffusion with solution pH (slower diffusion with lower pH) was also observed.32 Jachimska et al. observed a similar trend of pH induced swelling of ∼25% in commercial G6 PAMAM by quartz crystal microbalance.34
However, the relationship between pH and dendrimer radius is far from clear. Many groups have reported no significant swelling of dendrimers at low pH. Porcar and Chen et al. used SANS to study commercial G3–G6 dendrimer materials at various pH values. Only a small (∼5%) increase in RG (RG = 2.09 nm for G5) was observed under acidic conditions. Large changes in internal structure were still observed; therefore, the authors hypothesize that counterion shielding effects minimize the repulsion between charged terminal amines that would theoretically lead to swelling.35 In subsequent studies on commercial G4 and G5 PAMAM, this observation was experimentally attributed to a pH-induced conformational change from a dense-core structure at neutral pH to an evenly distributed structure at lower pH, with similar RG in both environments.36,37 Liu and Goddard et al. confirmed in simulation on structurally perfect PAMAM models that explicitly including counterions in calculations prevented the observed swelling previously reported by MD.38 Interestingly, Chen et al. found that at higher generations (G7–G8 commercial materials), a noticeable swelling still occurred upon protonation of the dendrimer. The source of the swelling was found to be the same structural rearrangement (redistribution of mass from the center to the periphery and intradendrimer hydration39) seen in lower generations, with a more observable result.5 The effect of counterion association has also been studied by MD and SANS and has been shown to influence observed properties such as structure rearrangement and observed radius.40
To gain experimental insight into the effect of pH on the variously sized components of G5c, we studied the diffusion behavior of G5c, G5m, and G5 dimer in pH buffers ranging from 3 to 11. The pH of a solution of G5c in deuterium oxide is ∼12. The isolated material, however, had pH values closer to 7 due to treatment with pH 7.4 buffer in preparation. To ensure that the observed differences in hydrodynamic radii were not due to swelling at lower pH, we collected DOSY spectra of both G5c and G5m in deuterated buffers at pH 3, 5, 7, 9, and 11. Figure 5 and Table 3 give the resulting Stejskal–Tanner plots. For G5c, only the pH 11 sample fell within one standard deviation of the D2O sample. This is expected because PAMAM is basic in solution (pH ≈ 11 to 12). As pH is lowered, the primary and secondary amines become partially to fully protonated. This causes a swelling of the dendrimer, evidenced by the RH increasing from 2.8 to 3.1 nm (∼10%). However, G5m shows no significant change between any two pH values. The pH of a solution of G5m in deuterium oxide is ∼7 due to the preparation. When comparing G5m to G5c at any given pH, a significant difference only appears at pH 11, the most basic condition used. This implies that the larger observed radius for G5m as compared with G5c material stems from a lesser conformational change due to pH. At high pH, the amines are expected to be neutral and the dendrimer branches spend more time folded into the core than extended out.5,36,41 However, this does not appear to be the case for G5m, which has approximately the same radius from pH 3 to 11 with no significant swelling.
Figure 5.

Stejskal–Tanner plots of (a) G5c and (b) G5m dissolved in various pH buffers.
Table 3. Effect of pH on Self Diffusion and Hydrodynamic Radius of Both G5c and G5m Dissolved in Various pH Buffersa.
| pH 3 | pH 5 | pH 7 | pH 9 | pH 11 | D2O | ||
|---|---|---|---|---|---|---|---|
| G5c | D (m/s2) × 10–11 | 7.41 | 7.43 | 7.77 | 7.69 | 8.17 | 8.21 ± 0.25 |
| RH (nm) | 3.1 | 3.1 | 2.9 | 3.0 | 2.8 | 2.8 ± 0.1 | |
| G5m | D (m/s2) × 10–11 | 7.16 | 7.34 | 7.50 | 7.54 | 7.48 | 7.49 ± 0.12 |
| RH (nm) | 3.2 | 3.1 | 3.1 | 3.0 | 3.1 | 3.1 ± 0.1 |
D2O samples represent five repeats with a standard error.
Chen et al.5 suggested that pH response only becomes significant for higher generation dendrimers. Experimentally, they found that commercial G3 and higher PAMAMs underwent significant swelling, whereas G2 and G1 did not. However, the work reported here suggests that dendrimer as large as G5, in monomer form (G5m), does not undergo significant swelling due to changes in pH. It is hypothesized, therefore, that the observed swelling in the commercial material is actually due to oligomer structures that make up >15% of the commercial sample. This could also explain the observations of Chen et al., as oligomers become more prevalent at higher generations so G3c would be expected to have significantly more oligomers present than G2c. G5 dimers are approximately the same size as a G6 PAMAM dendrimer by molecular weight; therefore, they would be expected to undergo larger conformational changes upon protonation than a G5-sized dendrimer. To test this theory, we collected DOSY spectra of isolated G5 dimer at pH 3, 7, and 11 (Figure 6, Table 4). A 44% increase in hydrodynamic radius was observed when the pH was lowered from 11 to 3, indicating a much higher degree of swelling for the dimer samples as compared with G5m. Therefore, the small difference in pH response of the G5c material compared with the G5m is the result of swelling of the ∼14% dimer and higher oligomer fractions present in the G5c material. It also explains why the RH value of G5m is larger than the average RH value G5c at high pH when the larger oligomer structures present in G5c are collapsed, decreasing the average RH of the G5c mixture.
Figure 6.
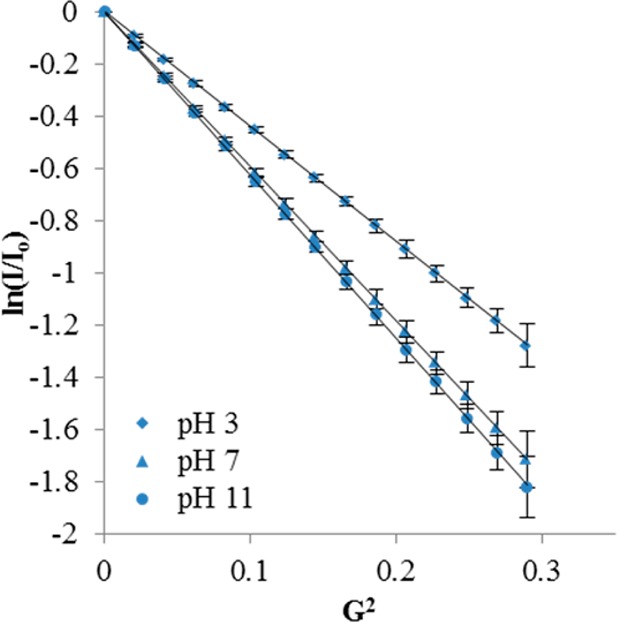
Stejskal–Tanner plots of G5 dimer in various pH buffers. Standard deviations are approximated by averaging the percent deviations of the G3c, G5c, and G5m at each data point.
Table 4. Summary of Self Diffusion and Hydrodynamic Radii of G5 Dimer in Various pH Buffers.
| pH 3 | pH 7 | pH 11 | D2O | |
|---|---|---|---|---|
| D (m/s2) × 10–11 | 3.89 | 5.23 | 5.53 | 5.68 |
| rH (nm) | 5.9 | 4.4 | 4.1 | 4.0 |
Hong et al. pointed out that implementation of the Stokes–Einstein equation in the form for “stick” boundary conditions assumes the sphere surface (i.e., the dendrimer) rotates with the same velocity as the liquid surface (i.e., D2O).7 Under the slip boundary condition, the dendrimer rotates independently from the solvent (i.e., no interaction), and the Stokes–Einstein relation takes the form
consequently increasing the measured radii by a factor of 1.5. The authors state that improper boundary conditions may have caused some groups to measure erroneous increases in RH by diffusion. It seems logical to assume that the charged surface amines present at lower pH values would interact more with the D2O than the neutral surface amines at higher pH. This would imply that lower pH values are closer to the stick limit and higher pH at the slip limit. Treatment of the G5m at high pH in the slip limit would imply that the dendrimer actually decreases in RH as pH is lowered. At pH 11, the slip-limit RH of G5m would give a volume of 421 nm3, and at pH 3 a stick-limit RH gives a volume of 138 nm3. This would reflect a collapsing of the dendrimer structure upon protonation of the primary amines, an extremely unlikely event that is not supported by MD computations. A stick/slip boundary limit transition would, in fact, account for the measured change in the dimer case. A pH 11 slip-limit gives an observed RH value of 6.2 nm and a pH 3 stick-limit RH value of 5.9 nm (around the expected error of ±0.1 nm). However, because the G5 dimer has the same chemical components as the G5m, there is no reason for the solvent to interact with it differently. Therefore, although it cannot be determined from DOSY alone which limiting case is most appropriate, the observed trend of the G5m data indicates that a complete switching of limits is not appropriate. Therefore, the swelling observed for the dimer is not an artifact of a boundary condition change of the Stokes–Einstein equation but is due to a change in dendrimer arm backfolding.
Conclusions
In summary, the diffusion behavior of T2 and T3 trailing generation, G5m, and dimer, trimer, and tetramer oligomers isolated from commercial PAMAM dendrimer material was studied by DOSY NMR spectroscopy. Samples isolated from the commercial material ranged in size from roughly equivalent to G2 (4700 Da) to G5 tetramers (73 000 Da). The self-diffusion constants of the isolated structures were found to scale exponentially with structure size at a similar rate as those reported as a function of dendrimer generation in poor solvents (i.e., when significant backfolding will occur). Additionally, the radius of hydration was found to scale exponentially with molecular weight (approximated by number of atoms) in good agreement with the molecular dynamics predicted relation of R ∝ N1/3. This result indicates that low- and high-molecular-weight fractions present in commercial G5 PAMAM dendrimer material effectively behave like trailing and higher generation PAMAM structures. Experimental results from ensemble techniques such as NMR spectroscopy and X-ray or neutron scattering on commercial G5 dendrimer materials reflect an average of many generations of dendrimers. This explains why a bulk response to pH has been observed in commercial PAMAM material but was not predicted by molecular models performed using structurally perfect simulations.
Additionally, we have explored the response of G5 dendrimer to pH. The commercial G5 material had a slight (∼10%) swelling when the pH was lowered from 11 to 3. However, the isolated G5 monomer had no significant change in RH across this range. It was found that the large, oligomeric fractions (dimer, in particular) had changes in observed RH of 44% when pH was lowered from 11 to 3. We conclude that dimer and larger fractions are the source of the change observed in the commercial sample.
Acknowledgments
This work was supported by the National Institute of Biomedical Imaging and Bioengineering (R01 EB005028).
The authors declare no competing financial interest.
Funding Statement
National Institutes of Health, United States
References
- Tomalia D. A.; Baker H.; Dewald J.; Hall M.; Kallos G.; Martin S.; Roeck J.; Ryder J.; Smith P. A New Class of Polymers: Starburst-Dendritic Macromolecules. Polym. Chem. 1985, 17, 117–132. [Google Scholar]
- Canetta E.; Maino G. Molecular Dynamic Analysis of the Structure of Dendrimers. Nucl. Instrum. Methods Phys. Res., Sect. B 2004, 213, 71–74. [Google Scholar]
- Rathgeber S.; Monkenbusch M.; Kreitschmann M.; Urban V.; Brulet A. Dynamics of Star-burst Dendrimers in Solution in Relation to their Structural Properties. J. Chem. Phys. 2002, 117, 4047–4062. [Google Scholar]
- Chen W.-R.; Porcar L.; Liu Y.; Butler P. D.; Magid L. J. Small Angle Neutron Scattering Studies of the Counterion Effects on the Molecular Conformation and Structure of Charged G4 PAMAM Dendrimers in Aqueous Solutions. Macromolecules 2007, 40, 5887–5898. [Google Scholar]
- Liu Y.; Chen C.-Y.; Chen H.-L.; Hong K.; Shew C.-Y.; Li X.; Liu L.; Melnichenko Y. B.; Smith G. S.; Herwig K. W.; Porcar L.; Chen W.-R. Electrostatic Swelling and Conformational Variation Observed in High-Generation Polyelectrolyte Dendrimers. J. Phys. Chem. Lett. 2010, 1, 2020–2024. [Google Scholar]
- Li X.; Zamponi M.; Hong K.; Porcar L.; Shew C.-Y.; Jenkins T.; Liu E.; Smith G. S.; Herwig K. W.; Liu Y.; Chen W.-R. pH Responsiveness of Polyelectrolyte Dendrimers: a Dynamical Perspective. Soft Matter 2011, 7, 618–622. [Google Scholar]
- Hong K.; Liu Y.; Porcar L.; Dazhi L.; Gao C. Y.; Smith G. S.; Herwig K. W.; Cai S.; Li X.; Wu B.; Chen W.-R.; Liu L. Structural Response of Polyelectrolyte Dendrimer towards Molecular Protonation: the inconsistency revealed by SANS and NMR. J. Phys.: Condens. Matter 2012, 24, 064116. [DOI] [PubMed] [Google Scholar]
- Stechemesser S.; Eimer W. Solvent-Dependent Swelling of Poly(amido amine) Starburst Dendrimers. Macromolecules 1997, 30, 2204–2206. [Google Scholar]
- Choi S. K.; Myc A.; Silpe J. E.; Sumit M.; Wong P. T.; McCarthy K.; Desai A. M.; Thomas T. P.; Kotlyar A.; Holl M. M. B.; Orr B. G.; Baker J. R. Dendrimer-Based Multivalent Vancomycin Nanoplatform for Targeting the Drug-Resistant Bacterial Surface. ACS Nano 2012, 7, 214–228. [DOI] [PubMed] [Google Scholar]
- Goonewardena S. N.; Kratz J. D.; Zong H.; Desai A. M.; Tang S.; Emery S.; Baker J. R.; Huang B. Design Considerations for PAMAM Dendrimer Therapeutics. Bioorg. Med. Chem. Lett. 2013, 23, 2872–2875. [DOI] [PubMed] [Google Scholar]
- Svenson S. Dendrimers as Versatile Platform in Drug Delivery Applications. Eur. J. Pharm. Biopharm. 2009, 71, 445–462. [DOI] [PubMed] [Google Scholar]
- Boas U.; Heegaard P. M. H. Dendrimers in Drug Research. Chem. Soc. Rev. 2004, 33, 43–63. [DOI] [PubMed] [Google Scholar]
- Rathgeber S.; Pakula T.; Urban V. Structure of Star-burst Dendrimers: A Comparison Between Small Angle X-ray Scattering and Computer Simulation Results. J. Chem. Phys. 2004, 121, 3840–3853. [DOI] [PubMed] [Google Scholar]
- Maiti P. K.; Çaǧın T.; Wang G.; Goddard W. A. Structure of PAMAM Dendrimers: Generations 1 through 11. Macromolecules 2004, 37, 6236–6254. [Google Scholar]
- Prosa T. J.; Bauer B. J.; Amis E. J.; Tomalia D. A.; Scherrenberg R. A SAXS Study of the Internal Structure of Dendritic Polymer Systems. J. Polym. Sci., Part B: Polym. Phys. 1997, 35172913–2924. [Google Scholar]
- Prosa T. J.; Bauer B. J.; Amis E. J. From Stars to Spheres: A SAXS Analysis of Dilute Dendrimer Solutions. Macromolecules 2001, 34, 4897–4906. [Google Scholar]
- Pavan G. M.; Posocco P.; Tagliabue A.; Maly M.; Malek A.; Danani A.; Ragg E.; Catapano C. V.; Pricl S. PAMAM Dendrimers for siRNA Delivery: Computational and Experimental Insights. Chem.—Eur. J. 2010, 16, 7781–7795. [DOI] [PubMed] [Google Scholar]
- Thomas T. P.; Majoros I.; Kotlyar A.; Mullen D.; Banaszak Holl M. M.; Baker J. R. Cationic Poly(amidoamine) Dendrimer Induces Lysosomal Apoptotic Pathway at Therapeutically Relevant Concentrations. Biomacromolecules 2009, 10, 3207–3214. [DOI] [PMC free article] [PubMed] [Google Scholar]
- van Dongen M. A.; Desai A.; Orr B. G.; Baker J. R. Jr.; Banaszak Holl M. M. Quantitative Analysis of Generation and Branch Defects in G5 poly(amidoamine) Dendrimer. Polymer 2013, 54, 4126–4133. [DOI] [PMC free article] [PubMed] [Google Scholar]
- Mullen D. G.; Desai A.; van Dongen M. A.; Barash M.; Baker J. R. Jr.; Banaszak Holl M. M. Best Practices for Purification and Characterization of PAMAM Dendrimer. Macromolecules 2012, 45, 5316–5320. [DOI] [PMC free article] [PubMed] [Google Scholar]
- Shi X.; Bi X.; Ganser T. R.; Hong S.; Myc L. A.; Desai A.; Holl M. M. B.; Baker J. R. HPLC Analysis of Functionalized Poly(amidoamine) Dendrimers and the Interaction Between a Folate-dendrimer Conjugate and Folate Binding Protein. Analyst 2006, 131, 842–848. [DOI] [PubMed] [Google Scholar]
- van Dongen M. A.; Vaidyanathan S.; Banaszak Holl M. M. PAMAM Dendrimers as Quantized Building Blocks for Novel Nanostructures. Soft Matter 2013, 9, 11188–11196. [DOI] [PMC free article] [PubMed] [Google Scholar]
- Jiménez V.; Gavín J.; Alderete J. Scaling Trend in Diffusion Coefficients of Low Generation G0–G3 PAMAM Dendrimers in Aqueous Solution at High and Neutral pH. Struct. Chem. 2012, 23, 123–128. [Google Scholar]
- Sagidullin A.; Skirda V. D.; Tatarinova E. A.; Muzafarov A. M.; Krykin M. A.; Ozerin A. N.; Fritzinger B.; Scheler U. Self-Diffusion and Nuclear Magnetic Resonance of Dendritic Macromolecules in Solutions. Appl. Magn. Reson. 2003, 25, 129–156. [Google Scholar]
- Sagidullin A.; Fritzinger B.; Scheler U.; Skirda V. D. Self-diffusion of Low-generation PAMAM Dendrimers with Hydroxyl Surface Groups in Solutions: a General Regularity. Polymer 2004, 45, 165–170. [Google Scholar]
- Fritzinger B.; Scheler U. Scaling Behaviour of PAMAM Dendrimers Determined by Diffusion NMR. Macromol. Chem. Phys. 2005, 206, 1288–1291. [Google Scholar]
- Hardy R. C.; Cottington R. L. Viscosity of Deuterium Oxide and Water in the Range 5° to 125 °C. J. Res. Natl. Bur. Stand. 1949, 42, 573–578. [Google Scholar]
- Esfand R.; Tomalia D. A. Poly(amidoamine) (PAMAM) Dendrimers: from Biomimicry to Drug Delivery and Biomedical Applications. Drug Discovery Today 2001, 6, 427–436. [DOI] [PubMed] [Google Scholar]
- Yang H.; Kao W. J. Dendrimers for Pharmaceutical and Biomedical Applications. J. Biomater. Sci., Polym. Ed. 2006, 17, 3–19. [DOI] [PubMed] [Google Scholar]
- Chen Z. Y.; Cai C. Dynamics of Starburst Dendrimers. Macromolecules 1999, 32, 5423–5434. [Google Scholar]
- Maiti P. K.; Bagchi B. Diffusion of flexible, charged, nanoscopic molecules in solution: Size and pH dependence for PAMAM dendrimer. J. Chem. Phys. 2009, 13121214901. [DOI] [PubMed] [Google Scholar]
- Banyai I.; Keri M.; Nagy Z.; Berka M.; Balogh L. P. Self diffusion of water and poly(amidoamine) dendrimers in dilute aqueous solutions. Soft Matter 2013, 9, 1645–1655. [Google Scholar]
- Maiti P. K.; Çaǧın T.; Lin S.-T.; Goddard W. A. Effect of Solvent and pH on the Structure of PAMAM Dendrimers. Macromolecules 2005, 383979–991. [Google Scholar]
- Jachimska B.; Łapczyńka M.; Zapotoczny S. Reversible Swelling Process of Sixth-Generation Poly(amido amine) Dendrimers Molecule As Determined by Quartz Crystal Microbalance Technique. J. Phys. Chem. C 2012, 11721136–1145. [Google Scholar]
- Porcar L.; Liu Y.; Verduzco R.; Hong K.; Butler P. D.; Magid L. J.; Smith G. S.; Chen W.-R. Structural Investigation of PAMAM Dendrimers in Aqueous Solutions Using Small-Angle Neutron Scattering: Effect of Generation. J. Phys. Chem. B 2008, 1124714772–14778. [DOI] [PubMed] [Google Scholar]
- Porcar L.; Hong K.; Butler P. D.; Herwig K. W.; Smith G. S.; Liu Y.; Chen W.-R. Intramolecular Structural Change of PAMAM Dendrimers in Aqueous Solutions Revealed by Small-Angle Neutron Scattering. J. Phys. Chem. B 2010, 11451751–1756. [DOI] [PubMed] [Google Scholar]
- Liu Y.; Porcar L.; Hong K.; Shew C.-Y.; Li X.; Liu E.; Butler P. D.; Herwig K. W.; Smith G. S.; Chen W.-R. Effect of counterion valence on the pH responsiveness of polyamidoamine dendrimer structure. J. Chem. Phys. 2010, 13212124901. [DOI] [PubMed] [Google Scholar]
- Liu Y.; Bryantsev V. S.; Diallo M. S.; Goddard W. A. PAMAM Dendrimers Undergo pH Responsive Conformational Changes without Swelling. J. Am. Chem. Soc. 2009, 13182798–2799. [DOI] [PubMed] [Google Scholar]
- Wu B.; Li X.; Do C.; Kim T.-H.; Shew C.-Y.; Liu Y.; Yang J.; Hong K.; Porcar L.; Chen C.-Y.; Liu E. L.; Smith G. S.; Herwig K. W.; Chen W.-R. Spatial distribution of intra-molecular water and polymeric components in polyelectrolyte dendrimers revealed by small angle scattering investigations. J. Chem. Phys. 2011, 13514144903. [DOI] [PubMed] [Google Scholar]
- Wu B.; Chen W.-R.; Egami T.; Li X.; Liu Y.; Wang Y.; Do C.; Porcar L.; Hong K.; Liu L.; Smith G. S.; Smith S. C. Molecular dynamics and neutron scattering study of the dependence of polyelectrolyte dendrimer conformation on counterion behavior. J. Chem. Phys. 2012, 1376064902. [DOI] [PubMed] [Google Scholar]
- Liu Y.; Bryanstev V.; Diallo M.; Goddard W. A. PAMAM Dendrimers Undergo pH Responsive Conformational Changes without Swelling. J. Am. Chem. Soc. 2009, 131, 2798–2799. [DOI] [PubMed] [Google Scholar]