

Abstract
We recently identified an engineered bioactive silica-based nanoparticle formulation (designated herein as NP1) that stimulates in vitro differentiation and mineralization of osteoblasts, the cells responsible for bone formation, and increases bone mineral density in young mice in vivo. The results demonstrate that these nanoparticles have intrinsic biological activity; however, the intracellular fate and a complete understanding of the mechanism(s) involved remains to be elucidated. Here we investigated the cellular mechanism(s) by which NP1 stimulates differentiation and mineralization of osteoblasts. We show that NP1 enters the cells through a caveolae-mediated endocytosis followed by stimulation of the mitogen activated protein kinase ERK1/2 (p44/p42). Our findings further revealed that NP1 stimulates autophagy including the processing of LC3β-I to LC3β-II, a key protein involved in autophagosome formation, which is dependent on ERK1/2 signaling. Using a variant of NP1 with cobalt ferrite magnetic metal core (NP1-MNP) to pull down associated proteins, we found direct binding of LC3β and p62, two key proteins involved in autophagosome formation, with silica nanoparticles. Interestingly, NP1 specifically interacts with the active and autophagosome associated form of LC3β (LC3β-II). Taken together, the stimulation of autophagy and associated signaling suggests a cellular mechanism for the stimulatory effects of silica nanoparticles on osteoblast differentiation and mineralization.
Keywords: silica nanoparticles, endocytosis, ERK1/2, autophagy, LC3β, p62, osteoblast differentiation
The skeleton is a dynamic organ that undergoes continuous regeneration. The deposition of mineral is conducted by mesenchymal-derived osteoblast cells, whereas removal of bone, resorption, is achieved by monocyte-derived osteoclasts. A number of cell models have been developed, such as the murine MC3T3-E1 cell line, allowing for the monitoring and coordination of cellular and biochemical studies necessary for osteoblasts to differentiate and form a mineralized matrix.1In vitro studies using these models have demonstrated that 50 nm spherical silica nanoparticles (NP1) can rapidly enter preosteoblasts2 and directly stimulate differentiation and mineralization.3,4 Intraperitoneal injection of NP1-PEG resulted in beneficial effects on bone mineral density in young mice.3 Further, although NP1 suppresses NF-κB signaling after 24 h, providing a partial explanation of how they may regulate osteoclast and osteoblast differentiation3 the process by which these silica nanoparticles enter osteoblasts, their intracellular fate, and the intracellular mechanism(s) by which they achieve their bioactive effect remain to be fully elucidated.
Extracellular factors can be internalized (endocytosed) by a number of membrane-mediated mechanisms that are influenced by size, shape, and surface properties of the factor. The three main endocytic processes are (1) caveolae/lipid raft-mediated, (2) clathrin-mediated, and (3) macropinocytosis/phagocytosis (reviewed in the literature5,6). Macropinocytosis/phagocytosis, involves large invaginations (>0.2 μm) for the uptake of nutrients and antigens and is the common mechanism for bacteria and virus entry.7 Clathrin-mediated endocytosis involves membrane invagination (∼200 nm) regulated by coating proteins such as caveolin and is most often associated with internalization of pathogens, nutrients, antigens, and receptors,8 and caveolae/lipid raft-mediated endocytosis (∼60–80 nm) occurs in cholesterol-rich regions of the membrane and has been associated with the regulation of cell signaling.9 Cellular recognition of extracellular factors can also trigger various signal transduction events. Many signaling events are funneled through one of three mitogen-activated protein kinases (MAPKs): extracellular signal-regulated kinases (ERK1/2, p44/42) most often associated with cell growth and proliferation, c-Jun amino (N)-terminal kinases (JNK1/2/3) often linked with both environmental as well as internal cell stress, and p38 associated with environmental stresses and inflammatory cytokines (reviewed in the literature10). Once an extracellular factor is internalized there are a number of different mechanisms by which a cell will process the material such as targeting to the lysosome, phagosome, and autophagosome. Although the mechanism(s) by which cells process internalized nanomaterials is currently poorly understood, recent studies have suggested autophagy as a possible cellular intermediate.11−13
The cellular process of macroautophagy (referred to herein as autophagy) is a highly regulated catabolic cellular process that degrades unnecessary or dysfunctional proteins and organelles through delivery to the lysosome. Autophagy can be induced by various stimuli, such as stress, cytokines, pathogens, aggregated proteins, and damaged or surplus organelles. Autophagy is characterized by sequestration of targeted proteins or organelles into double membrane vesicles called autophagosomes, which fuse with the lysosome causing degradation of the contents.14 Formation of the autophagosome is controlled by at least 32 different autophagy related genes (Atgs) mostly identified in yeast15 but conserved in mammalian cells. A key protein involved in “cargo” delivery and development of the double membrane is the microtubule-associated protein 1 light chain 3 (LC3β or Atg8), referred to herein as LC3β.16 Upon autophagosome formation inactive LC3β (LC3β-I) is proteolytically processed and lipidated to form active LC3β-II. An important protein involved in cargo delivery to the autophagosome is p62/Sequestosome 1 (SQSTM1)17,18 which binds ubiquitinated proteins and LC3β-II and results in targeting of substrates to the autophagosome. p62 (also known as a signaling adaptor/scaffold protein) has been proposed to regulate the packing and delivery of polyubiquitinated, misfolded, aggregated proteins and dysfunctional organelles for clearance through autophagy in mammalian cells and Drosophila.19−22 A recent study has linked the requirement of autophagy for osteoblast differentiation in vitro,23 and a second has demonstrated that suppression of autophagy in mice leads to decreased bone quality similar to aging24 These results suggest an important role of autophagy in osteoblast mineralization and maintenance of bone quality in vivo, although the details remain to be fully elucidated (reviewed in the literature25).
To date, spherical silica-based nanoparticles greater than 30 nm and less than 100 nm in diameter have been generally considered to be compatible with cell viability in vitro(4,26,27) although further studies are needed to fully understand the complex physicochemical interactions in vivo. Our recent studies suggest that certain silica nanoparticle formulations are not inert but have intrinsic beneficial biological activity on osteoblasts and osteoclasts.3,4 These nanoparticles are spherical 50 nm silica-based and have been synthesized by the Stöber method with or without a cobalt ferrite core, which possess magnetic properties, as well as fluorescent rhodamine B incorporated into the silica shell and with or without a surface modification of poly(ethylene glycol) (PEG).2,4,28 Although there are numerous antiosteoporotic drugs that target the osteoclast and limit further bone breakdown, these agents are inefficient at rebuilding lost bone mass. To date, agents capable of actively stimulating osteoblastic bone formation are rare, and currently only one FDA approved bone anabolic agent exists. There is consequently significant interest in the identification of new bone anabolic agents for amelioration of bone disease.
In the present study we investigated the cellular events necessary for nanoparticle-stimulated osteoblast differentiation using the murine preosteoblast cell line (MC3T3-E1). We report involvement of caveolae-mediated endocytosis in the mechanism of internalization and activation of the signaling intermediate ERK1/2 as a key intracellular signaling protein for the processing of LC3β. Finally, we show involvement of autophagy in the intracellular process by which silica nanoparticles stimulate osteoblast differentiation and mineralization. On the basis of our previous findings of increased bone mineral density in nanoparticle-treated mice the current findings have therapeutic relevance and suggest the process of autophagy as a novel potential target for the regulation of bone density. Furthermore, these studies represent one of the first comprehensive investigations of the intrinsic biological properties of a nanoparticle, and their cellular processing provides additional insight into the mechanisms by which they achieve their biological effect in addition to suppression of NF-κB.3
Results
Internalization of NP1 by Caveolae-Mediated Endocytosis
Extracellular factors can be internalized (endocytosed) by a number of membrane-mediated mechanisms, which are influenced by size and surface properties of the factor. Using the stable fluorescent properties of NP1 we have previously observed a robust internalization into mesenchymal-derived cells such as osteoblast, however, a much weaker internalization into cells from other lineages such as epithelial.4 To investigate the mechanism by which osteoblasts internalize NP1 we used known inhibitors of the different endocytic mechanisms6,29 and the strong photostable fluorescent properties of NP1 to track entry into the cell. We used two different inhibitors for each endocytic mechanism. We used the osteoblast precursor cell line MC3T3-E1,1 which has been used extensively to study multiple aspects of osteoblast differentiation and activity. MC3T3-E1 cells were pretreated with the following inhibitors: (1) Caveolae/lipid raft-mediated: Methyl-beta-cyclodextrin (MβCD) 3 mM and Nystatin 1 ng/mL. (2) Macro/phagocytosis: Amiloride 100 μM and Cytochalisin D 10 μM. (3) Clathrin-mediated: Phenylarsine oxide 30 nM and Chloropromazine 3 μM for 2 h (reviewed in the literature6), followed by addition of NP1 (60 μg/mL), and cells were analyzed for cytoplasmic fluorescence using fluorescent microscopy after 20 h. Inhibition of caveolae/lipid rafts completely blocked internalization of NP1 in osteoblasts (Figure 1A), while the other compounds had little effect on cell entry (Figure 1B). These results suggest that NP1 is internalized by a caveolae/lipid raft-mediated process.
Figure 1.

Inhibition of lipid raft/caveolae-mediated endocytosis blocks internalization of NP1, and NP1 rapidly enters cells by endocytosis. (A) MC3T3-E1 cells were pretreated for 1 h with inhibitors of lipid rafts/caveolae (MβCD), macropinocytosis (Chloropromazine), and clathrin-mediated (Amiloride), followed by addition of NP1 (60 μg/mL) for 20 h. Fluorescent microscopy (top panels) was used to determine internalization of the particles and light microscopy for cell viability (bottom panels) (20× magnification). (B) The concentrations of multiple inhibitors used in the assay and whether fluorescent NP1 was detected in the cytoplasm. (C) MC3T3-E1 cells were treated with NP1 (60 μg/mL) (red) for 1 h, and the lysomal tracker (blue) (lysotracker, Invitrogen Molecular Bioprobes) and endosome tracker (green) (Transferrin-GFP, Invitrogen MB) were added according to the manufacturer’s protocol. Images were captured after 1 h by Zeiss LSM 510 META point scanning laser confocal microscope. Merged images identify overlap (yellow) of the nanoparticles and endosome tracker (white arrow) and a lack of overlap with lysosome tracker.
NP1 Colocalizes with Endosomes
We next investigated the subsequent cellular localization of NP1 following internalization, by colocalizing NP1 fluorescence with that of fluorescent markers of target organelles. MC3T3-E1 cells were treated with NP1 (red) followed by addition of an endosome marker (transferin GFP-green) and a lysosome marker (lysotracker-blue) for 1 h, and images were captured by confocal fluorescent microscopy (Figure 1C). The results revealed a colocalization of the particles with the endosome marker at this early time point. Taken together with the endocytosis studies above, our data suggest that NP1 is initially internalized by caveolae followed by delivery to the endosome.
NP1-MNP Sequesters in Autophagosome-like Structures in Preosteoblasts
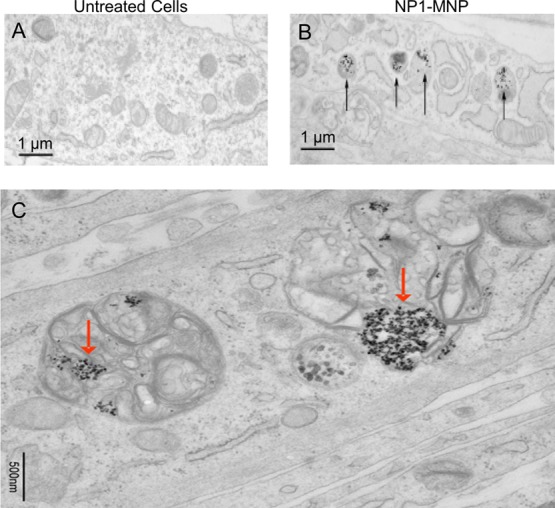
To determine the intracellular fate of NP1 following endosomal sequestration we took advantage of the electron dense core of NP1-MNP to investigate intracellular localization using transmission electron microscopy (TEM). Nondifferentiated MC3T3-E1 cells were treated with NP1-MNP for 18 h, and cells were fixed for TEM. Images at 1 μm resolution reveal numerous nanoparticles both within membrane bound structures as well as free in the cytoplasm (Figure 2A). Higher magnification images (100 and 200 nm resolution) revealed particles in discrete double membrane vesicles, a unique signature of autophagosomes30 (Figure 2B) and autolysosomes (Figure 2C). Dispersed NP1-MNP alone is shown for comparison (Figure 2D). Collectively, our TEM signatures showing autophagosome and autolysosome localization, combined with our intracellular fluorescent colocalization data showing endosomal but not lysosomal internalization, suggest that after endocytosis NP1-MNP is targeted to autophagosomes and ultimately sequestered in autolysosomes.
Figure 2.

Transmission electron microscopy of NP1-MNP treated MC3T3-E1 cells. (A) Metal core nanoparticles NP1-MNP (60 μg/mL) were added to MC3T3-E1 cells for 20 h, and TEM was performed. NP1-MNPs were detected in vesicles and free in the cytosol. (B,C) Higher magnification identified NP1-MNP in autolysosomes (merged autophagosome–-lysosome). (D) Pure NP1-MNP by TEM for comparison.
NP1 Stimulates Autophagy
Our TEM images suggested the presence of NP1 in autophagosomes. To determine whether NP1 is simply targeted to autophagosomes or is also involved in promoting autophagosome formation we next examined a key event in the formation of the autophagosome, and a diagnostic marker of autophagy, the shift in forms of LC3β from the mature form (LC3β-I) to the cleaved/lipidated-autophagosome associated form (LC3β-II), which migrates as a lower molecular weight on SDS PAGE gels because of increased hydrophobicity.31 Treatment of preosteoblasts with NP1-MNP for times up to 60 min resulted in a strong increase in LC3β-II (Figure 3A). We further detected an increase in p62 protein levels, indicative of autophagosome formation using Western blotting and corresponding to the increase in LC3β-II protein levels (Figure 3A). In addition to evidence of LC3β processing, we further employed a commonly used assay for monitoring autophagosome formation involving the use of a GFP tagged LC3β expression construct. Upon activation of autophagy LC3β translocates to punctate structures (autophagosomes) as visualized by fluorescent microscopy. We transiently transfected MC3T3-E1 cells with the LC3β-GFP construct followed by treatment with NP1 for 24 h. Fluorescent microscopy revealed a dramatic increase in punctate structures, considered reflective of autophagosome formation30,32 (Figure 3B right panel), which we quantified by counting (Figure 3C). These studies suggest that not only does NP1 likely localize to the autophagosome, but also they may actively stimulate autophagosome formation.
Figure 3.
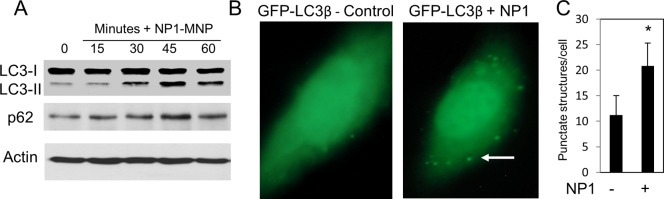
NP1 stimulates autophagy. (A) MC3T3-E1 cells were treated with NP1 (60 μg/mL) for indicated times (minutes), and the conversion of LC3β-I to LC3β-II, p62, and actin were analyzed by Western blotting (representative of at least three exp.). (B) Cells were transiently transfected with LC3β-GFP followed by treatment with vehicle (left panel) or NP1 60 μg/mL (right panel) for 20 h. Autophagosomes are recognized as punctate structures (white arrow). (C) Number of autophagosomes per cell (n = 20) were counted and presented graphically. *P < 0.01 (t test).
NP1 Directly Associates with the Key Autophagosome Proteins LC3β-II and p62
To investigate the potential for direct interactions of NP1 with autophagosome related proteins we leveraged the magnetic properties of our cobalt-ferrite core nanoparticles to perform a “pulldown” using a magnet (Figure 4A). We used two different nanoparticles to determine the effect of altering surface properties; NP1-MNP contain abundant Si–OH silanol groups and are strongly negatively charged, whereas NP1-MNP-PEG are surface modified with PEG and are less negatively charged. Poly(ethylene glycol) (PEG) is often used for in vivo applications to increase circulating time by evading the reticuloendothelial system. Preosteoblast cells were incubated with NP1-MNP or NP1-MNP-PEG for 72 h, and the nanoparticles were purified from the resulting lysate by magnetic separation. After three washes the bound proteins were analyzed by Western blotting (Figure 4A). Remarkably, only the LC3β-II form of the protein (autophagy active) was found to coassociate with NP1. LC3β-II was not detected in fetal bovine serum (FBS) alone, used as a specificity control (Figure 4B). Interestingly, the addition of PEG to the surface did not interfere with the protein–nanoparticle interaction. Furthermore, a second key protein needed for autophagosome formation, p62, was also coassociated with the nanoparticles using the same pulldown assay (Figure 4B). As expected, the amount of LC3β-II and p62 protein associated with the nanoparticles was dose-dependently related to the concentration added to the cells (Figure 4C). To further investigate specificity we increased the stringency (ionic strength) of the wash steps by increasing salt concentration. Both LC3β and p62 were found bound to the nanoparticles even at the most stringent conditions (1000 mM NaCl) suggesting an extremely strong and specific interaction (Figure 4D).
Figure 4.

Nanoparticle “pulldown” assays identify interaction with autophagy proteins. The metal core of NP1-MNP was used to “pulldown” nanoparticles and any associated proteins with a strong magnet. (A) Schematic of the assay that leverages the magnetic core to separate particles from lysate and identify bound proteins by Western blotting. Cells are incubated with NP1-MNP or NP1-MNP-PEG (100 μg/mL) for 3 days, lysed, and collected by magnetic separation. NP1-MNP is washed three times using the same approach, and bound proteins are analyzed by SDS-PAGE separation and Western blotting. (B) MC3T3-E1 cells were treated as described in (A), and the resulting blot probed for p62 and LC3β. NP1-MNP “OH” and NP1-MNP-PEG “PEG” were also incubated with fetal bovine serum “FBS” as a control for nonspecific binding. Whole cell lysate “WCL” was also run for comparison. LC3-II protein was dose-dependently, surface-independently separated by the magnetic pulldown method. (C) The pulldown assay was performed as in (A) with cell incubated with increasing concentrations of NP1-MNP and NP1-MNP-PEG, as indicated. (D) The pulldown assay was performed as in (A) with NP1-MNP-PEG, and the stringency of the wash conditions was increased by increasing salt concentrations. Representative of three independent experiments.
Inhibition of Autophagy Blocks NP1 Interaction with LC3β and P62
To further investigate the mechanism by which NP1-stimulates autophagy we utilized inhibitors of different stages of autophagy, including 3-Methyladenine (3-MA) (0.5 mM), which blocks the very early stages of autophagosome formation,33 Bafilomycin A1 (BA1) (0.1 μM), which blocks fusion of the autophagosome with the lysosome and subsequent acidification,34,35 and Chloroquine (CQ) (10 μM), which blocks the final step of degradation in the autolysosome (reviewed in the literature30) (Figure 5A). We used these inhibitors to investigate the interaction of NP1 with LC3β at the different stages of autophagic flux. MC3T3-E1 cells were pretreated for 1 h with inhibitors followed by addition of NP1-MNP-PEG (60 μg/mL) for 72 h. Cells were harvested, and nanoparticles were purified using the magnetic pulldown assay (Figure 4A) and analyzed by Western blotting. Results revealed that treatment with 3-MA greatly reduced the interaction of NP1-MNP-PEG with LC3β-II (Figure 5B). Treatment with CQ, which should increase autophagosome number, dramatically increased the interaction of NP1 with LC3β-II (Figure 5B). The results provide evidence that our nanoparticles are directly involved in initiation of the earliest stages of autophagosome formation.
Figure 5.

Inhibiting autophagosome formation blocks interaction of NP1-MNP with LC3. (A) Schematic of autophagosome and autolysosome formation and sites of inhibitor (3-Methyladenine (3MA), Bafilomycin A1 (BA1), and Chloroquine (CQ)) action. (B) MC3T3-E1 cells were pretreated with the 3MA (0.5 mM), BA1 (0.1 μM), and CQ (10 μM) for 1 h prior to addition of NP1-MNP-PEG for 72 h. The magnetic pulldown assay was used to analyze bound proteins by Western blotting as indicated.
Internalization of NP1 Stimulates Activation of ERK1/2 Signaling
Given the rapid sequestration of nanoparticles to the autophagosome, an organelle designed to sequester and dispose of potentially toxic agents, we postulated that NP1 internalization might generate a stress response that would in turn stimulate one or more of the common mitogen-activated protein kinases (MAPKs) signaling pathway cascades represented by p38, JNK, and ERK1/2. Although we did not identify a change in the stress responsive JNK pathway, a time-dependent phosphorylation of the growth-associated ERK1/2 was elicited by NP1 within 15 min of cell exposure (Figure 6A). To confirm the specificity of NP1 stimulated phosphorylation of ERK1/2 we used inhibitors of the three MAPK pathways. In agreement with the time course data, U0126, an inhibitor of MEK the upstream kinase of ERK1/2 blocked phosphorylation of ERK1/2 in response to NP1 treatment (Figure 6B). To determine if the process of endocytosis was the trigger for the stimulation of ERK1/2 phosphorylation we used MβCD to inhibit endocytosis. MβCD also blocked NP1-induced ERK1/2 phosphorylation (Figure 6C) suggesting the endocytosis stimulated by membrane exposure of NP1 initiates the ERK1/2 signal transduction pathway. Importantly, pharmacological inhibition of ERK1/2 signaling blocked the shift in LC3β-I to LC3β-II (Figure 6D) identifying ERK1/2 signaling as a required upstream event in NP1-stimulated autophagy. To rule out the possibility that ERK1/2 phosphorylation was required for NP1 endocytosis we analyzed cytoplasmic fluorescence in the presence or absence of U0126. Results revealed no inhibition of endocytosis in the presence of the ERK1/2 inhibitor (Figure 6E) confirming that stimulation of ERK1/2 phosphorylation is downstream of NP1 endocytosis.
Figure 6.

NP1 and NP1-MNP rapidly stimulate phosphorylation of ERK1/2 (pERK1/2). (A) MC3T3-E1 cells were serum starved overnight and treated with NP1 for the indicated time (minutes). Anisomycin (ani) (2.5 μg/mL, 30 min) was used as a positive control for p38 and pJNK. Cells were harvested and analyzed by Western blotting. (B) MC3T3-E1 cells were pretreated with inhibitors for ERK1/2 (U0126–30 μM), JNK (SP600125–10 μM), and p38 (SB203580–10 μM) followed by treatment with NP1 for 15 min and analyzed by Western blotting. (C) MC3T3-E1 cells were pretreated with the caveolae/lipid raft inhibitor MβCD for 2 h followed by addition of NP1-MNP (100 μg/mL) for 15 min, and the resulting samples were analyzed by Western blotting. (D) MC3T3-E1 cells were pretreated with U0126 (30 μM) or control followed by addition of NP1 for 45 min, and the resulting samples were analyzed for the conversation of LC3β-I to LC3β-II, p62, and actin by Western blotting. (E) MC3T3-E1 cells were pretreated with U0126 (30 μM) or control followed by NP1 (60 μg/mL) for 20 h, and fluorescent and light microscopy were used for detection of nanoparticle internalization.
Autophagy Is Stimulated during Osteoblast Differentiation
Osteoblast differentiation is a complex process that in vitro occurs on the order of weeks. A number of cell culture models have been developed that reasonably mimic the changes that occur in vivo, including the murine preosteoblast cell line MC3T3-E1.1 These cells, when treated with ascorbic acid and provided a source of organic phosphate such as beta-glycerophosphate (βGP), will differentiate and mineralize between 14 and 21 days of culture.36,37 Two key markers used to track osteoblast differentiation are the rise in alkaline phosphatase enzyme activity (an early maker of osteoblast differentiation) and increased gene expression of osteocalcin (a late marker synonymous with mineralizing osteoblasts). The result of the differentiation process is the formation and deposition of hydroxyapatite mineral.38 To determine if NP1 stimulates autophagy in differentiating osteoblasts MC3T3-E1 cells were differentiated in the presence of NP1-MNP (30 μg/mL), and protein was harvested at the indicated time points. Osteoblast differentiation was monitored by an increase in the ectoenzyme alkaline phosphatase (ALP) (Figure 7A), increased mineralization determined by Alizarin red S staining (Figure 7B), and an increase in specific genes such as osteocalcin (OSC) (Figure 7C). NP1-MNP accelerates osteoblast differentiation as demonstrated by a more rapid increase in ALP activity (Figure 7A) and increased mineralization (Figure 7B). The results confirm differentiation and mineralization of the preosteoblasts to mature active osteoblasts. Samples were harvested in parallel and analyzed for markers of autophagy. The data demonstrate a time-dependent increase in LC3β-II (Figure 7D), peaking at day 11 just prior to mineralization and corresponding with the key differentiation marker osteocalcin. Interestingly, gene expression of LC3β and p62 were also time-dependently increased also peaking at 11 days corresponding to expression of osteocalcin a marker of mature differentiated osteoblasts (Figure 7E).
Figure 7.

NP1-MNP stimulates osteoblast differentiation and expression of autophagy-related genes. (A) MC3T3-E1 cells were differentiated to osteoblasts in the presence of 30 μg/mL NP1-MNP or not (control), and samples were harvested for alkaline phosphatase enzyme activity at the indicated times (n = 3). (B) MC3T3-E1 cells were treated as in (A), and cells were stained for mineralization with Alizarin red S after 14 days. (C) Cells were treated and harvested as in (A) and analyzed for RNA expression of osteocalcin (OSC) by qRT-PCR. (D) Cells treated as in (A) were analyzed by Western blotting and probed with antibodies specific for the indicated proteins. Ubiquitin (Ub) was used as a loading control. (E) Cells were treated as in (A) and analyzed for RNA levels of autophagy genes using qRT-PCR. qRT-PCR results were normalized to Ubiquitin C and fold change calculated using the 2(−ΔΔCt) method. *P < 0.05, **P < 0.01 (students-t test).
NP1-MNP Is Found in Autophagosomes in Differentiated Osteoblasts
To confirm that NP1 also localizes to autophagosomes in differentiating cells we treated MC3T3-E1 cells with differentiation medium supplemented with NP1-MNP (60 μg/mL) for 28 days, and the resulting mineralized cell layers were analyzed by TEM. Results identified nanoparticles in autolysosome structures in these mature and mineralizing osteoblasts (compare Figure 8a (untreated) and Figure 8B (NP1-MNP treated)). Higher magnification (500 nm) confirmed the autolysosome localization (Figure 8C).
Figure 8.
Transmission electron microscopy of NP1-MNP treated differentiating osteoblasts. Metal core nanoparticles NP1-MNP were added to MC3T3-E1 cells (60 μg/mL), and the cells were differentiated for 28 days. Nanoparticles were added with medium changes, every 2–3 days. (A) Cross-sectional view of untreated cells (control) and (B) NP1-MNP treated. Black arrows identify NP1-MNP. (C) Higher magnification of NP1-MNP in vesicles after 28 days of osteoblast differentiation. Red arrows identify NP1-MNP.
Discussion
Our previous studies identified 50 nm silica nanoparticles as having significant stimulatory effects on osteoblast mineralization,3,4 and here we investigated the potential cellular mechanisms by which NP1 might influence cell behavior. Our data suggest that NP1 not only is sequestered to autophagic vesicles, but also stimulates autophagosome formation via an ERK1/2 dependent mechanism. Autophagy is a highly controlled intracellular process currently known to be stimulated by stresses including nutrient deprivation, misfolded or aggregated proteins, or damaged organelles.14,39 It has recently been reported that 10–50 nm gold, 22 nm TiO2, quantum dots (<10 nm), and 50 nm iron oxide nanoparticles can induce autophagy,11−13,40,41 and our results presented herein add 50 nm silica nanoparticles to this list. Collectively these studies suggest that it is not the material per se that stimulates autophagy but rather size or shape. Although there are a number of potential explanations for the stimulation of autophagy we hypothesize that the nanoparticle surface is coated with protein(s), and the cell views this as a misfolded or aggregated/agglomerated protein and processes it accordingly. When nanoparticles are exposed to a biological fluid they are gradually bound with proteins, which ultimately cover the surface. This de novo protein layer creates a bio–nano interface between nanoparticles and the fluid and has been referred to as a “protein corona” and at least 50 different types of proteins have been associated with the corona.42−44 One might therefore hypothesize that the cell misinterprets this protein corona as a misfolded or aggregated protein thereby targeting it to the autophagosome and ultimately the autolysosome.
Using a magnetic core version of our silica nanoparticle we investigated the possibility that NP1 bound key proteins involved in autophagosome formation and substrate recognition including LC3 and p62. Our data reveal that this is indeed the case. Previous nanoparticle–protein interactions have been studied in ex vitro experiments that used nanoparticles mixed with serum,45 plasma,46,47 or a single protein,48 however our study analyzed nanoparticles isolated from the cytoplasm of cultured cells providing a physiologically relevant model. One of the more interesting findings is that NP1 was only bound with the active, processed form of LC3β (LC3β-II). One potential explanation for this phenomenon is that the nanoparticles were brought into close proximity with only the activated form of LC3β as a result of compartmentalization in the autophagosome. It is also possible that NP1 interacts with p62 and that p62 only interacts with LC3β-II, although this has yet to be demonstrated. To remove bound proteins with low affinity we altered the salt concentration of the washes in our magnetic pulldown assay. The salt concentration can decrease nonspecific binding, and increasing the salt concentration is commonly used in immunoprecipitations, a biological technique to determine selective protein–protein interaction by protein (antigen)–antibody reaction or protein complex–antibody interaction. In Figure 4D, autophagic proteins, LC3β-II and p62 were both identified at all salt concentrations, whereas ubiquitin (used as a nonspecific control) was not detected in any pulldown lanes demonstrating both specificity and a stronger interaction of the particles with LC3β-II and p62. The results suggest the nanoparticles recognize both p62 and LC3β-II directly and with high affinity. Collectively, the results suggest for the first time that endocytosed silica nanoparticles strongly interact with specific autophagy-related proteins.
Somewhat surprisingly, we found that LC3β-II and p62 bound with similarly affinity to both the PEGylated and nontreated (OH) nanoparticles. The binding of proteins to the surface of nanoparticles could be influenced by surface properties such as charge and hydrophobicity/hydrophilicity.43 We expected that the PEGylated particles would be less interactive because the PEG moiety, which is used for in vivo applications to evade attack by the reticuloendothelial system, could physically interfere with proteins binding to the surface.49 Further, the PEGylated particle is much less negative in charge, as measured by zeta potential,4 and therefore would be less interactive with certain positively charged proteins than the more negatively charged NP1-MNP. Contrary to our expectation, there was no significant difference between NP1-MNP and NP1-MNP-PEG (Figure 5) in the interaction with LC3 or p62. There are a number of possible explanations for the findings. First, it is possible that because both NPs have negative charges favoring the interaction of similar proteins based on charge. Second, it is possible that the PEG is degraded from the nanoparticle surface once they are internalized thereby returning the surface to the base NP1 particle. Previous studies have suggested that PEG can be degraded through the oxidation of the alcohol groups (reviewed in the literature50), which can occur in mammalian cells and systems (reviewed in the literature51). The degradation is suggested to be mediated by enzymatic reactions such as alcohol dehydrogenase and sulfotransferases. Additionally, reactive oxygen species have been demonstrated to accelerate the degradation of PEG with molecular weights of 6000–20 000 to acids such as formic acetic within 120 min.52 Our PEG molecule was 260–400, and therefore, degradation should be possible in a relatively short period of time. Further, we utilized a PEG molecule having 6–9 repeating units (−CH2CH2O–, 0.35 nm) and it is possible that a longer molecule would produce a different result as suggested for those less than 3 nm.49 Finally, it is also possible that the nanoparticles are initially bound by different proteins as a result of the different surface properties; however, the cell recognizes both protein coated particles as misfolded or aggregated proteins, targeting them both for the autophagosome.
We also identified caveolae-mediated endocytosis as the mechanism of cellular entry of our silica nanoparticles, in agreement with previous studies on nanoparticle internalization.53−56 The 50 nm size of NP1 and NP1-MNP is consistent with caveolae-mediated internalization, suggested to be ∼60–80 nm.57 Caveolae are flask-like invaginations of the membrane rich in cholesterol and as such are considered specialized lipid rafts (reviewed in the literature58). A key protein(s) in the formation and function of caveolae is the 21 kDa Caveolin proteins-1,2,3. Using the magnetic properties of a cobalt ferrite core we performed magnetic pulldown assays to identify proteins bound or interacting with our nanoparticles and, in fact, detected a strong interaction with caveolin-1. Our results using inhibitors of autophagy also suggest that the interaction of NP1 with caveolin-1 occurs before autophagy stimulation and is maintained through formation and merging with the lysosome. Taken together the results suggest the possibility that caveolin-1 is responsible for directly recognizing the nanoparticles for internalization.
Our results identified ERK1/2 as a signaling intermediate between NP1-stimulated endocytosis and autophagosome formation. Autophagy in general has been recently linked to ERK1/2. Nutrient starvation activates ERK1 and 2, and in agreement with our studies, inhibition of ERK1/2 blocks induction of autophagy.59 Amino acids have also been demonstrated to suppress autophagosome formation through inhibition of ERK1/2.60 It should be noted that the other MAPKs, JNK and p38, have also been linked to regulation of autophagy (reviewed in the literature61). The failure to detect any role of these pathways in our system suggests the possibility of either cell type specificity and/or stimulation specific effects. To our knowledge, the results presented herein are the first to link the stimulation and requirement of ERK1/2 with nanoparticle stimulated autophagy. It will be interesting to determine if this is a common property of nanomaterials or if this is influenced by size, shape and charge as with many other cellular effects of nanomaterials.
Conclusions
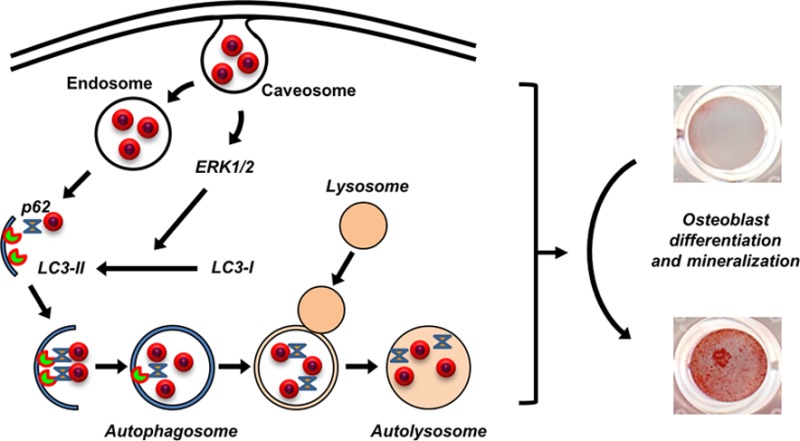
In conclusion, results presented herein suggest specific and coordinated mechanisms for the internalization and cellular processing of 50 nm silica nanoparticles (Figure 9). Our data revealed that NP1 and NP1-PEG are initially internalized by caveolae-mediated endocytosis, which triggers the stimulation of an ERK1/2 signaling pathway necessary for the processing of LC3β-I to LC3β-II and stimulating autophagosome assembly. The nanoparticles are likely released from the endosome both stimulating autophagy and being targeted to the autophagosome by p62 and LC3β-II. Although still not completely understood, this process is stimulatory to osteoblast differentiation and mineralization. This conclusion is supported by a recent study, which found that inhibiting autophagosome formation blocked mineralization in bone marrow and primary calvaria cells.23 Further, conditional knockout of Atg7, a protein necessary for autophagy, in terminally differentiated osteoblasts (osteocytes) in aged mice resulted in a decrease in cancellous bone, osteoblast number, and bone formation rate.24 Autophagy therefore represents a putative novel mechanism by which bone metabolism might be manipulated for stimulation of bone accrual. Our study adds to the understanding of the specific biological effects of nanomaterials on cell functions that will allow for future manipulation of bioactive nanomaterials with increased target specificity and efficacy.
Figure 9.
Schematic representing the intrinsic biological effects of silica-based nanoparticles on osteoblast differentiation. NP1 is internalized by caveolae-mediated endocytosis, which triggers a signal transduction pathway dependent on ERK1/2. This stimulation of ERK1/2 is necessary for the processing of LC3β form I to the activated form II. NP1 is bound by both LC3 and p62, resulting in the formation of autophagosomes. The stimulation of autophagy is necessary for osteoblast differentiation and mineralization.
Materials and Methods
Synthesis and Characterization of Silica Nanoparticles
The 50 nm fluorescent silica-based nanoparticles (NP1) were synthesized by the Stöber method, which comprises a solid silica shell (SiO2) doped with rhodamine B fluorescent tracking dye as described previously.2 These nanoparticles have been characterized for shape and size distribution using scanning electron microscopy (SEM) and transmission electron microscopy (TEM).2−4 For in vivo biocompatibility we have further developed a poly(ethylene glycol) (PEG)62 decorated variant (NP1-PEG), and the successful functionalization with PEG was confirmed by changes in zeta potential.3 We have additionally synthesized a composite nanoparticle, which incorporates a magnetic metal (CoFe2O4) core (MNP) to create NP1-MNP and NP1-MNP-PEG.28 These particles allow us to perform intracellular localization studies by electron microscopy and the potential of identifying bound cellular proteins using magnetic pull-down studies. Unlike fluorescent silica nanoparticles prepared from APS and isothiocyanated dye molecules for the thiourea linkage formation, which precipitates in alcohol and water at the neutral and basic pH regions, no amine terminal groups are present on our nanoparticle surface, which results in nanoparticles that are highly dispersible in most medium including alcohol, water, and PBS in a wide range of pHs.2 The incorporation of rhodamine B into the silica resulted in strong fluorescence with greatly enhanced photostability providing an ideal means to investigate cellular mechanism. Understanding the mechanism by which NP1 is internalized will provide valuable information toward our goal of understanding of the physicochemical properties of nanoparticles and how their biological activity might be further optimized. Chemicals for the synthesis of nanoparticles were obtained from Sigma (St. Louis, MO) and Gelest (Morrisville, PA).
General Method for Synthesis of Fluorescent Silica Nanoparticle (NP1)
(Trimethoxysilylpropyl)-rhodamine B (TMSP-RhB) (20 mg, as described in detail2) and tetraethyl orthosilicate (0.86 g) was dissolved in ethanol. Ammonia (1 mL) and water were added with stirring overnight. The silica nanoparticles were centrifuged, washed three times, and dispersed in ethanol for subsequent surface-modification or PBS for cell culture.
Synthesis of Fluorescent Magnetic Core-Silica Shell Nanoparticles (NP1-MNP)
Cobalt ferrite solution (34.7 mL, 20 mg/mL MNP solution in water) was added to polyvinylpyrrolidone solution (PVP; 0.65 mL; Mw average ∼55k, 25.6 mg/mL in H2O), and the mixture was stirred for 1 day at room temperature. The PVP-stabilized cobalt ferrite nanoparticles were separated by addition of aqueous acetone (H2O/acetone = 1/10, v/v) and centrifugation at 4000 rpm for 10 min. The supernatant solution was removed, and the precipitated particles were redispersed in ethanol (10 mL). Multigram-scale preparation of PVP-stabilized cobalt ferrite nanoparticles was easily reproduced in this modified synthetic method. A mixed solution of TEOS and TMSP-RhB (molar ratio = 0.3/0.04) was injected into the ethanol solution of PVP-stabilized cobalt ferrite. Polymerization initiated by adding ammonia solution (0.86 mL; 30 wt % by NH3) as a catalyst produced cobalt ferrite–silica core–shell nanoparticles containing organic dye. These nanoparticles were dispersed in ethanol and precipitated by ultracentrifugation (18000 rpm for 30 min). This washing process was repeated 3 times, and nanoparticles were finally dispersed in ethanol for the surface-modified step or in water for the cell culture.
PEGylation of Nanoparticles (NP1-PEG and NP1-MNP-PEG)
Purified NP1 or core–shell nanoparticles NP1-MNP (45 mg) were redispersed in absolute ethanol (10 mL) and then treated with 2-[methoxy(polyethyleneoxy)propyl] trimethoxysilane (PEG-Si(OMe)3: 125 mg, 0.02 mmol), CH3O(CH2CH2O)6–9-CH2CH2CH2Si(OCH3)3, at pH12 (adjusted with NH4OH). The resulting NP1-PEG or NP1-MNP-PEG was washed and centrifuged in ethanol three times and sterile water once. Zeta potential was measured using a Zetasizer Nano ZS90 (Malvern Instruments Ltd., Malvern, UK) at a concentration of 1 mg/mL in water. The following results were obtained: NP1 (−33.1 ± 6.1 mV), NP1-PEG (−7.6 ± 3.7 mV), NP1-MNP (−28.1 ± 1.2 mV), NP1-MNP-PEG (−8.3 ± 1.2 mV), as reported previously.4
Cell Culture and Reagents
Murine MC3T3-E1 cells1,38 were cultured in α-modified Eagle’s medium (α-MEM; Thermo Scientific, Waltham, MA) supplemented with 10% fetal bovine serum (FBS; Atlanta Biologicals, Lawrenceville, GA).3 All growth medium were supplemented with 1% l-glutamine (Invitrogen), and 1% of penicillin/streptomycin (Thermo Scientific). All cell lines were cultured at 37 °C in 5% CO2. Inhibitors were purchased from Sigma (3-Methyladenine (3MA) and Chloroquine (CQ)) and Enzo life sciences (Bafilomycin A1 (BA1)). The LC3-GFP construct was purchased from Invivogen (San Diego, CA).
Internalization Efficiency
After incubating cells with nanoparticles for indicated times excess nanoparticles were removed by washing with 1× PBS (3 times), and the cells were examined and photographed under fluorescent microscopy (Nikon Eclipse TS100, (Nikon, Melville, NY) G-2E/C LP filter set).
Confocal Microscopy
MC3T3-E1 cells were treated with nanoparticles 60 μg/mL (red) for 1 h, and the lysosomal tracker (blue) (lysotracker, Invitrogen-Molecular Bioprobes) and endosome tracker (green) (Transferrin-GFP, Invitrogen MB) were added according to the manufacturer’s protocol. Images were captured by Zeiss LSM 510 META point scanning laser confocal microscope.
Transmission Electron Microscopy
The cultured cells were fixed with 2.5% glutaraldehyde in 0.1 M cacodylate buffer and followed by 1% osmium tetroxide in the same buffer. After dehydration with ethanol, cells were infiltrated and eventually embedded in Epon resin. Ultrathin sections were counterstained with 4% uranyl acetate and lead citrate and examined on a Hitachi H-7500 transmission electron microscope.
MC3T3-E1 Differentiation, Mineralization, and Alkaline Phosphatase Assays
Osteoblast differentiation using the murine MC3T3-E1 cell line1 has been previously described.38 Briefly, MC3T3-E1 cells were differentiated to osteoblasts in αMEM supplemented with 10% FBS, penicillin, and streptomycin. Differentiation medium was supplemented with 50 μg of l-ascorbate and 10 mM β-glycerophosphate (Sigma Chemical Co., St. Louis, MO). NP1-MNP was added with medium changes twice per a week. Mineralization was visualized by staining with 40 mM Alizarin Red S (Sigma Chemical Co., St. Louis, MO) for 15 min. Excess stain was removed by washing with distilled water. Enzyme activity was measured in whole cell lysates using a kit from Sigma as described previously.38
Western Blot Analysis
The nanoparticle treated cells were rinsed with PBS and lysed in p300 lysis buffer (250 mM NaCl, 0.1% NP-40, 20 mM sodium phosphate, 30 mM sodium pyrophosphate, 5 mM EDTA, and 10 mM sodium fluoride, adjusted at pH 7.0) supplemented with Halt protease & phosphatase single-use inhibitor cocktail (Thermo Fisher Scientific). Whole cell lysate (10–30 μg) was separated by polyacrylamide gel electrophoresis (10, 12, and 15%) and electrotransferred to PVDF membrane Hybond-P (GE Health Sciences, Piscataway, NJ). After blocking in in 1× TBST with 5% nonfat dry milk, blots were incubated with specific primary antibodies overnight at 4 °C and visualized by horseradish peroxidase-conjugated second antibody using Pierce ECL Western blotting substrate (Thermo Fisher Scientific). Antibodies were purchased from Cell Signaling (Danvers, MA), LC3, p62, pERK1/2, ERK1/2, pJNK, pP38, and Rab5, and from Santa Cruz Biotechnologies, Inc. (Santa Cruz, CA), actin, JNK, p38, Ubiquitin, Flotilin, Caveolin-1.
Magnetic Pulldown Assay
MC3T3-E1 cells were incubated with NP1-MNP or NP1-MNP-PEG for 72 h. Cells were rinsed with cold PBS once and lysed in E1A lysis buffer (250 mM NaCl, 0.1% NP-40, and 50 mM HEPES, adjusted at pH 7.5) supplemented with Halt protease & phosphatase single-use inhibitor cocktail (Thermo Fisher Scientific). Nanoparticles were “pulled-down” from the lysate using Dynal magnets (Dynal Biotech ASA, Oslo Norway) ∼8 h initially followed by washing with lysis buffer. Two subsequent pulldowns were performed at 4 °C to further purify sample (Figure 5A).
RNA Extraction, cDNA Synthesis, and qRT-PCR for Osteoblast Differentiation Genes
RNA was extracted using TRIzol reagent following the manufacturer’s protocol (Invitrogen) and cDNA was synthesized using high capacity cDNA reverse transcription kit (Applied Biosystems, Foster City CA). qRT-PCR was performed using EvaGreen qPCR master mix (Biotium, Hayward CA) on an Applied Biosystems-StepOnePlus. Primers for OSC, LC3b, p62, and ubiquitin C (UbC) (control) were designed using qPrimerDepot software (http://mouseprimerdepot.nci.nih.gov/) with sequences as follows:
OSC: F-5′-AAGCAGGAGGGCAATAAGGT-3′, R-5′-CAAGCAGGGTTAAGCTCACA-3′. LC3b: F-5′-GAGAAGACCTTCAAGCAGCG-3′, R-5′-AATCACTGGGATCTTGGTGG-3′. p62: F-5′-AGAATGTGGGGGAGAGTGTG-3′, R-5′-TCTGGGGTAGTGGGTGTCAG-3′. UbC: F-5′-TCCAGAAAGAGTCCACCCTG-3′, R-5′-GACGTCCAAGGTGATGGTCT-3′. Fold change was calculated using the 2(−ΔΔCt) method.63
Acknowledgments
This study was supported by grants from NIAMS (AR056090), the Georgia Research Alliance (GRA.VL12.C2), and the Center for Pediatric Nanomedicine (RC159-G3) sponsored by Emory University, the Department of Biomedical Engineering at Georgia Institute of Technology, and Children’s Healthcare of Atlanta, Atlanta, GA, USA, to M.N. Weitzmann and G.R. Beck Jr., and a Biomedical Laboratory Research & Development Service Award Number I01BX002363 from the VA Office of Research and Development to G.R Beck Jr. G.R. Beck Jr. is also supported in part by a grant from the NCI (CA136716). M.N. Weitzmann is also supported in part by funding from the Biomedical Laboratory Research & Development Service of the VA Office of Research and Development (5I01BX000105) and by Grants AR059364 and AR053607 from NIAMS and AG040013 from NIA. The contents of this manuscript do not represent the views of the Department of Veterans Affairs or the United States Government. Research reported in this publication was supported in part by the Integrated Cellular Imaging Core of the Winship Cancer Institute of Emory University and NIH/NCI under Award Number P30CA138292. The content is solely the responsibility of the authors and does not necessarily represent the official views of the National Institutes of Health. The authors would like to thank Hong Yi of the Robert P. Apkarian Integrated Electron Microscopy Core at Emory University for expert technical assistance associated with TEM.
The authors declare no competing financial interest.
Funding Statement
National Institutes of Health, United States
References
- Sudo H.; Kodama H. A.; Amagai Y.; Yamamoto S.; Kasai S. In Vitro Differentiation and Calcification in a New Clonal Osteogenic Cell Line Derived from Newborn Mouse Calvaria. J. Cell. Biol. 1983, 96, 191–198. [DOI] [PMC free article] [PubMed] [Google Scholar]
- Ha S. W.; Camalier C. E.; Beck G. R. Jr.; Lee J. K. New Method to Prepare Very Stable and Biocompatible Fluorescent Silica Nanoparticles. Chem. Commun. (Cambridge, U. K.) 2009, 2881–2883. [DOI] [PMC free article] [PubMed] [Google Scholar]
- Beck G. R. Jr.; Ha S. W.; Camalier C. E.; Yamaguchi M.; Li Y.; Lee J. K.; Weitzmann M. N. Bioactive Silica-Based Nanoparticles Stimulate Bone-Forming Osteoblasts, Suppress Bone-Resorbing Osteoclasts, and Enhance Bone Mineral Density In Vivo. Nanomed.-Nanotechnol. Biol. Med. 2012, 8, 793–803. [DOI] [PMC free article] [PubMed] [Google Scholar]
- Ha S. W.; Sikorski J. A.; Weitzmann M. N.; Beck G. R. Jr. Bio-Active Engineered 50 nm Silica Nanoparticles with Bone Anabolic Activity: Therapeutic Index, Effective Concentration, and Cytotoxicity Profile In Vitro. Toxicol. In Vitro. 2013, 28, 354–364. [DOI] [PMC free article] [PubMed] [Google Scholar]
- Khalil I. A.; Kogure K.; Akita H.; Harashima H. Uptake Pathways and Subsequent Intracellular Trafficking in Nonviral Gene Delivery. Pharmacol. Rev. 2006, 58, 32–45. [DOI] [PubMed] [Google Scholar]
- Ivanov A. I. Pharmacological Inhibition of Endocytic Pathways: Is It Specific Enough to Be Useful?. Methods Mol. Biol. 2008, 440, 15–33. [DOI] [PubMed] [Google Scholar]
- Lim J. P.; Gleeson P. A. Macropinocytosis: An Endocytic Pathway for Internalising Large Gulps. Immunol. Cell Biol. 2011, 89, 836–843. [DOI] [PubMed] [Google Scholar]
- Le Roy C.; Wrana J. L. Clathrin- and Non-Clathrin-Mediated Endocytic Regulation of Cell Signalling. Nat. Rev. Mol. Cell Biol. 2005, 6, 112–126. [DOI] [PubMed] [Google Scholar]
- Lajoie P.; Nabi I. R. Lipid Rafts, Caveolae, and Their Endocytosis. Int. Rev. Cell Mol. Biol. 2010, 282, 135–163. [DOI] [PubMed] [Google Scholar]
- Cargnello M.; Roux P. P. Activation and Function of the Mapks and Their Substrates, the Mapk-Activated Protein Kinases. Microbiol. Mol. Biol. Rev. 2011, 75, 50–83. [DOI] [PMC free article] [PubMed] [Google Scholar]
- Ma X.; Wu Y.; Jin S.; Tian Y.; Zhang X.; Zhao Y.; Yu L.; Liang X. J. Gold Nanoparticles Induce Autophagosome Accumulation through Size-Dependent Nanoparticle Uptake and Lysosome Impairment. ACS Nano 2011, 5, 8629–8639. [DOI] [PubMed] [Google Scholar]
- Zhao Y.; Howe J. L.; Yu Z.; Leong D. T.; Chu J. J.; Loo J. S.; Ng K. W. Exposure to Titanium Dioxide Nanoparticles Induces Autophagy in Primary Human Keratinocytes. Small 2013, 9, 387–392. [DOI] [PubMed] [Google Scholar]
- Khan M. I.; Mohammad A.; Patil G.; Naqvi S. A.; Chauhan L. K.; Ahmad I. Induction of Ros, Mitochondrial Damage and Autophagy in Lung Epithelial Cancer Cells by Iron Oxide Nanoparticles. Biomaterials 2012, 33, 1477–1488. [DOI] [PubMed] [Google Scholar]
- Deter R. L.; Baudhuin P.; De Duve C. Participation of Lysosomes in Cellular Autophagy Induced in Rat Liver by Glucagon. J. Cell. Biol. 1967, 35, C11–16. [DOI] [PMC free article] [PubMed] [Google Scholar]
- Tanida I. Autophagosome Formation and Molecular Mechanism of Autophagy. Antioxid. Redox Signaling 2011, 14, 2201–2214. [DOI] [PubMed] [Google Scholar]
- Kabeya Y.; Mizushima N.; Ueno T.; Yamamoto A.; Kirisako T.; Noda T.; Kominami E.; Ohsumi Y.; Yoshimori T. LC3, a Mammalian Homologue of Yeast Apg8p, Is Localized in Autophagosome Membranes after Processing. EMBO J. 2000, 19, 5720–5728. [DOI] [PMC free article] [PubMed] [Google Scholar]
- Mathew R.; Karp C. M.; Beaudoin B.; Vuong N.; Chen G.; Chen H. Y.; Bray K.; Reddy A.; Bhanot G.; Gelinas C.; et al. Autophagy Suppresses Tumorigenesis through Elimination of p62. Cell 2009, 137, 1062–1075. [DOI] [PMC free article] [PubMed] [Google Scholar]
- Itakura E.; Mizushima N. P62 Targeting to the Autophagosome Formation Site Requires Self-Oligomerization but Not LC3 Binding. J. Cell. Biol. 2011, 192, 17–27. [DOI] [PMC free article] [PubMed] [Google Scholar]
- Kim P. K.; Haileye D. W.; Mullen R. T.; Lippincott-Schwartz J. Ubiquitin Signals Autophagic Degradation of Cytosolic Proteins and Peroxisomes. Proc. Natl. Acad. Sci. U. S. A. 2008, 105, 20567–20574. [DOI] [PMC free article] [PubMed] [Google Scholar]
- Kirkin V.; Lamark T.; Johansen T.; Dikic I. NBR1 Cooperates with p62 in Selective Autophagy of Ubiquitinated Targets. Autophagy 2009, 5, 732–733. [DOI] [PubMed] [Google Scholar]
- Nezis I. P.; Simonsen A.; Sagona A. P.; Finley K.; Gaumer S.; Contamine D.; Rusten T. E.; Stenmark H.; Brech A. Ref(2)P, the Drosophila melanogaster Homologue of Mammalian p62, Is Required for the Formation of Protein Aggregates in Adult Brain. J. Cell Biol. 2008, 180, 1065–1071. [DOI] [PMC free article] [PubMed] [Google Scholar]
- Pankiv S.; Clausen T. H.; Lamark T.; Brech A.; Bruun J. A.; Outzen H.; Overvatn A.; Bjorkoy G.; Johansen T. p62/SQSTM1 Binds Directly to Atg8/LC3 to Facilitate Degradation of Ubiquitinated Protein Aggregates by Autophagy. J. Biol. Chem. 2007, 282, 24131–24145. [DOI] [PubMed] [Google Scholar]
- Liu F.; Fang F.; Yuan H.; Yang D.; Chen Y.; Williams L.; Goldstein S. A.; Krebsbach P. H.; Guan J. L. Suppression of Autophagy by FIP200 Deletion Leads to Osteopenia in Mice through the Inhibition of Osteoblast Terminal Differentiation. J. Bone Miner. Res. 2013, 28, 2414–2430. [DOI] [PMC free article] [PubMed] [Google Scholar]
- Onal M.; Piemontese M.; Xiong J.; Wang Y.; Han L.; Ye S.; Komatsu M.; Selig M.; Weinstein R. S.; Zhao H.; et al. Suppression of Autophagy in Osteocytes Mimics Skeletal Aging. J. Biol. Chem. 2013, 288, 17432–17440. [DOI] [PMC free article] [PubMed] [Google Scholar]
- Hocking L. J.; Whitehouse C.; Helfrich M. H. Autophagy: A New Player in Skeletal Maintenance?. J. Bone Miner. Res. 2012, 27, 1439–1447. [DOI] [PubMed] [Google Scholar]
- Tang F.; Li L.; Chen D. Mesoporous Silica Nanoparticles: Synthesis, Biocompatibility and Drug Delivery. Adv. Mater. 2012, 24, 1504–1534. [DOI] [PubMed] [Google Scholar]
- Gehrke H.; Fruhmesser A.; Pelka J.; Esselen M.; Hecht L. L.; Blank H.; Schuchmann H. P.; Gerthsen D.; Marquardt C.; Diabate S.; et al. In Vitro Toxicity of Amorphous Silica Nanoparticles in Human Colon Carcinoma Cells. Nanotoxicology 2013, 7, 274–293. [DOI] [PubMed] [Google Scholar]
- Yoon T. J.; Kim J. S.; Kim B. G.; Yu K. N.; Cho M. H.; Lee J. K. Multifunctional Nanoparticles Possessing a “Magnetic Motor Effect” for Drug or Gene Delivery. Angew. Chem., Int. Ed. Engl. 2005, 44, 1068–1071. [DOI] [PubMed] [Google Scholar]
- Rothberg K. G.; Ying Y. S.; Kamen B. A.; Anderson R. G. Cholesterol Controls the Clustering of the Glycophospholipid-Anchored Membrane Receptor for 5-Methyltetrahydrofolate. J. Cell Biol. 1990, 111, 2931–2938. [DOI] [PMC free article] [PubMed] [Google Scholar]
- Mizushima N.; Yoshimori T.; Levine B. Methods in Mammalian Autophagy Research. Cell 2010, 140, 313–326. [DOI] [PMC free article] [PubMed] [Google Scholar]
- Mizushima N.; Yoshimori T. How to Interpret LC3 Immunoblotting. Autophagy 2007, 3, 542–545. [DOI] [PubMed] [Google Scholar]
- Klionsky D. J.; Abdalla F. C.; Abeliovich H.; Abraham R. T.; Acevedo-Arozena A.; Adeli K.; Agholme L.; Agnello M.; Agostinis P.; Aguirre-Ghiso J. A.; et al. Guidelines for the Use and Interpretation of Assays for Monitoring Autophagy. Autophagy 2012, 8, 445–544. [DOI] [PMC free article] [PubMed] [Google Scholar]
- Seglen P. O.; Gordon P. B. 3-Methyladenine: Specific Inhibitor of Autophagic/Lysosomal Protein Degradation in Isolated Rat Hepatocytes. Proc. Natl. Acad. Sci. U. S. A. 1982, 79, 1889–1892. [DOI] [PMC free article] [PubMed] [Google Scholar]
- Klionsky D. J.; Elazar Z.; Seglen P. O.; Rubinsztein D. C. Does Bafilomycin A1 Block the Fusion of Autophagosomes with Lysosomes?. Autophagy 2008, 4, 849–850. [DOI] [PubMed] [Google Scholar]
- Yoshimori T.; Yamamoto A.; Moriyama Y.; Futai M.; Tashiro Y. Bafilomycin A1, a Specific Inhibitor of Vacuolar-Type H(+)-Atpase, Inhibits Acidification and Protein Degradation in Lysosomes of Cultured Cells. J. Biol. Chem. 1991, 266, 17707–17712. [PubMed] [Google Scholar]
- Quarles L. D.; Yohay D. A.; Lever L. W.; Caton R.; Wenstrup R. J. Distinct Proliferative and Differentiated Stages of Murine MC3T3-E1 Cells in Culture: An In Vitro Model of Osteoblast Development. J. Bone Miner. Res. 1992, 7, 683–692. [DOI] [PubMed] [Google Scholar]
- Franceschi R. T.; Iyer B. S. Relationship between Collagen Synthesis and Expression of the Osteoblast Phenotype in MC3T3-E1 Cells. J. Bone Miner. Res. 1992, 7, 235–246. [DOI] [PubMed] [Google Scholar]
- Beck G. R. Jr.; Sullivan E. C.; Moran E.; Zerler B. Relationship between Alkaline Phosphatase Levels, Osteopontin Expression, and Mineralization in Differentiating MC3T3-E1 Osteoblasts. J. Cell Biochem. 1998, 68, 269–280. [DOI] [PubMed] [Google Scholar]
- Mizushima N. Autophagy: Process and Function. Genes Dev. 2007, 21, 2861–2873. [DOI] [PubMed] [Google Scholar]
- Li J. J.; Hartono D.; Ong C. N.; Bay B. H.; Yung L. Y. Autophagy and Oxidative Stress Associated with Gold Nanoparticles. Biomaterials 2010, 31, 5996–6003. [DOI] [PubMed] [Google Scholar]
- Seleverstov O.; Zabirnyk O.; Zscharnack M.; Bulavina L.; Nowicki M.; Heinrich J. M.; Yezhelyev M.; Emmrich F.; O’Regan R.; Bader A. Quantum Dots for Human Mesenchymal Stem Cells Labeling. A Size-Dependent Autophagy Activation. Nano Lett. 2006, 6, 2826–2832. [DOI] [PubMed] [Google Scholar]
- Nel A. E.; Madler L.; Velegol D.; Xia T.; Hoek E. M.; Somasundaran P.; Klaessig F.; Castranova V.; Thompson M. Understanding Biophysicochemical Interactions at the Nano-Bio Interface. Nat. Mater. 2009, 8, 543–557. [DOI] [PubMed] [Google Scholar]
- Mahmoudi M.; Lynch I.; Ejtehadi M. R.; Monopoli M. P.; Bombelli F. B.; Laurent S. Protein-Nanoparticle Interactions: Opportunities and Challenges. Chem. Rev. 2011, 111, 5610–5637. [DOI] [PubMed] [Google Scholar]
- Yang S. T.; Liu Y.; Wang Y. W.; Cao A. Biosafety and Bioapplication of Nanomaterials by Designing Protein-Nanoparticle Interactions. Small 2013, 9, 1635–1653. [DOI] [PubMed] [Google Scholar]
- Zhu Z. J.; Posati T.; Moyano D. F.; Tang R.; Yan B.; Vachet R. W.; Rotello V. M. The Interplay of Monolayer Structure and Serum Protein Interactions on the Cellular Uptake of Gold Nanoparticles. Small 2012, 8, 2659–2663. [DOI] [PMC free article] [PubMed] [Google Scholar]
- Monopoli M. P.; Walczyk D.; Campbell A.; Elia G.; Lynch I.; Bombelli F. B.; Dawson K. A. Physical-Chemical Aspects of Protein Corona: Relevance to In Vitro and In Vivo Biological Impacts of Nanoparticles. J. Am. Chem. Soc. 2011, 133, 2525–2534. [DOI] [PubMed] [Google Scholar]
- Walkey C. D.; Chan W. C. Understanding and Controlling the Interaction of Nanomaterials with Proteins in a Physiological Environment. Chem. Soc. Rev. 2012, 41, 2780–2799. [DOI] [PubMed] [Google Scholar]
- Mahmoudi M.; Shokrgozar M. A.; Sardari S.; Moghadam M. K.; Vali H.; Laurent S.; Stroeve P. Irreversible Changes in Protein Conformation Due to Interaction with Superparamagnetic Iron Oxide Nanoparticles. Nanoscale 2011, 3, 1127–1138. [DOI] [PubMed] [Google Scholar]
- Jokerst J. V.; Lobovkina T.; Zare R. N.; Gambhir S. S. Nanoparticle Pegylation for Imaging and Therapy. Nanomedicine (London, U. K.) 2011, 6, 715–728. [DOI] [PMC free article] [PubMed] [Google Scholar]
- Kawai F. Microbial Degradation of Polyethers. Appl. Microbiol. Biotechnol. 2002, 58, 30–38. [DOI] [PubMed] [Google Scholar]
- Webster R.; Didier E.; Harris P.; Siegel N.; Stadler J.; Tilbury L.; Smith D. Pegylated Proteins: Evaluation of Their Safety in the Absence of Definitive Metabolism Studies. Drug Metab. Dispos. 2007, 35, 9–16. [DOI] [PubMed] [Google Scholar]
- Giroto J. A.; Teixeira A. C. S. C.; Nascimento C. A. O.; Guardani R. Degradation of Poly(Ethylene Glycol) in Aqueous Solution by Photo-Fenton and H2O2/UV Processes. Ind. Eng. Chem. Res. 2010, 49, 3200–3206. [Google Scholar]
- Chithrani B. D.; Chan W. C. Elucidating the Mechanism of Cellular Uptake and Removal of Protein-Coated Gold Nanoparticles of Different Sizes and Shapes. Nano Lett. 2007, 7, 1542–1550. [DOI] [PubMed] [Google Scholar]
- Chung T. H.; Wu S. H.; Yao M.; Lu C. W.; Lin Y. S.; Hung Y.; Mou C. Y.; Chen Y. C.; Huang D. M. The Effect of Surface Charge on the Uptake and Biological Function of Mesoporous Silica Nanoparticles in 3t3-L1 Cells and Human Mesenchymal Stem Cells. Biomaterials 2007, 28, 2959–2966. [DOI] [PubMed] [Google Scholar]
- Kim J. S.; Yoon T. J.; Yu K. N.; Noh M. S.; Woo M.; Kim B. G.; Lee K. H.; Sohn B. H.; Park S. B.; Lee J. K.; et al. Cellular Uptake of Magnetic Nanoparticle Is Mediated through Energy-Dependent Endocytosis in A549 Cells. J. Vet. Sci. 2006, 7, 321–326. [DOI] [PMC free article] [PubMed] [Google Scholar]
- Lorenz M. R.; Holzapfel V.; Musyanovych A.; Nothelfer K.; Walther P.; Frank H.; Landfester K.; Schrezenmeier H.; Mailander V. Uptake of Functionalized, Fluorescent-Labeled Polymeric Particles in Different Cell Lines and Stem Cells. Biomaterials 2006, 27, 2820–2828. [DOI] [PubMed] [Google Scholar]
- Petros R. A.; DeSimone J. M. Strategies in the Design of Nanoparticles for Therapeutic Applications. Nat. Rev. Drug Discovery 2010, 9, 615–627. [DOI] [PubMed] [Google Scholar]
- Parton R. G.; Simons K. The Multiple Faces of Caveolae. Nat. Rev. Mol. Cell Biol. 2007, 8, 185–194. [DOI] [PubMed] [Google Scholar]
- Corcelle E.; Nebout M.; Bekri S.; Gauthier N.; Hofman P.; Poujeol P.; Fenichel P.; Mograbi B. Disruption of Autophagy at the Maturation Step by the Carcinogen Lindane Is Associated with the Sustained Mitogen-Activated Protein Kinase/Extracellular Signal-Regulated Kinase Activity. Cancer Res. 2006, 66, 6861–6870. [DOI] [PubMed] [Google Scholar]
- Pattingre S.; Bauvy C.; Codogno P. Amino Acids Interfere with the ERK1/2-Dependent Control of Macroautophagy by Controlling the Activation of Raf-1 in Human Colon Cancer HT-29 Cells. J. Biol. Chem. 2003, 278, 16667–16674. [DOI] [PubMed] [Google Scholar]
- Periyasamy-Thandavan S.; Jiang M.; Schoenlein P.; Dong Z. Autophagy: Molecular Machinery, Regulation, and Implications for Renal Pathophysiology. Am. J. Physiol.: Renal, Fluid Electrolyte Physiol. 2009, 297, F244–256. [DOI] [PMC free article] [PubMed] [Google Scholar]
- Alcantar N. A.; Aydil E. S.; Israelachvili J. N. Polyethylene Glycol-Coated Biocompatible Surfaces. J. Biomed. Mater. Res. 2000, 51, 343–351. [DOI] [PubMed] [Google Scholar]
- Livak K. J.; Schmittgen T. D. Analysis of Relative Gene Expression Data Using Real-Time Quantitative Pcr and the 2(-Delta Delta C(T)) Method. Methods 2001, 25, 402–408. [DOI] [PubMed] [Google Scholar]