

Abstract
We recently reported that trace insertion of exogenous fluorescent (green BODIPY) analogs of sphingomyelin (SM) into living red blood cells (RBCs), partially spread onto coverslips, labels submicrometric domains, visible by confocal microscopy. We here extend this feature to endogenous SM, upon binding of a SM-specific nontoxic (NT) fragment of the earthworm toxin, lysenin, fused to the red monomeric fluorescent protein, mCherry [construct named His-mCherry-NT-lysenin (lysenin*)]. Specificity of lysenin* binding was verified with composition-defined liposomes and by loss of 125I-lysenin* binding to erythrocytes upon SM depletion by SMase. The 125I-lysenin* binding isotherm indicated saturation at 3.5 × 10⁶ molecules/RBC, i.e., ∼3% of SM coverage. Nonsaturating lysenin* concentration also labeled submicrometric domains on the plasma membrane of partially spread erythrocytes, colocalizing with inserted green BODIPY-SM, and abrogated by SMase. Lysenin*-labeled domains were stable in time and space and were regulated by temperature and cholesterol. The abundance, size, positioning, and segregation of lysenin*-labeled domains from other lipids (BODIPY-phosphatidylcholine or -glycosphingolipids) depended on membrane tension. Similar lysenin*-labeled domains were evidenced in RBCs gently suspended in 3D-gel. Taken together, these data demonstrate submicrometric compartmentation of endogenous SM at the membrane of a living cell in vitro, and suggest it may be a genuine feature of erythrocytes in vivo.
Keywords: toxin, His-mCherry-NT-lysenin, lateral membrane heterogeneity, vital confocal imaging, membrane tension, cholesterol, temperature
Lipids at the outer leaflet of the mammalian plasma membrane are mainly composed of: i) SM, the most abundant sphingolipid (SL), based on a ceramide backbone and bearing a phosphocholine polar head; ii) glycosphingolipids (GSLs), another group of SLs bearing various sugars instead of phosphocholine, from simple glucosylceramide (GlcCer) to complex GSLs such as GM1 [for a review, see (1)]; iii) phosphatidylcholine (PC), the major glycerophospholipid, sharing the same phosphocholine polar head as SM; and iv) nonpolar cholesterol. Lipid bilayers are no longer considered as a homogenous solvent for membrane proteins (2), but are now represented with lateral heterogeneity at two different scales of time and space: i) transient nanometric “lipid rafts”, defined as small clusters enriched in SLs, sterol, and GPI-anchored proteins (3, 4); versus ii) submicrometric/mesoscale domains (5–15). These larger and more stable domains are well-characterized on artificial vesicles (16, 17), but their relevance for living cells has been questioned (18, 19).
The occurrence in living cells of submicrometric/mesoscale domains was first inferred from unexpected behavior in fluorescence recovery after photobleaching (FRAP) (20), and further indicated by single-molecule tracking, based on discrete jumps between predicted mesoscale domains (6). Besides this dynamic evidence, we previously reported that insertion at trace level into the outer plasma membrane leaflet of exogenous SM, modified by replacing part of its fatty acyl chain by the green fluorophore BODIPY (BODIPY-SM), labels submicrometric assemblies visible by confocal microscopy on various cells, including cultured cell lines and red blood cells (RBCs) partially spread onto poly-L-lysine-coated coverslips (9–11). Other reported examples include: i) activated blood platelets labeled with the lipidomimetic dialkylindocarbocyanine dye, DiIC18 (21); ii) rabbit RBCs and macrophages labeled with Laurdan (13, 22), an artificial membrane probe for “packing” of surrounding lipids; iii) fibroblasts labeled with BODIPY-lactosylceramide (23); and iv) very specialized membranes, such as human skin stratum corneum (14) and lung surfactant (15), in which lipids are the main components and membrane cytoskeleton anchorage is lacking. Interestingly, domains of similar size have been reported for yeast plasma membrane proteins (24, 25).
Recently, special attention has been given to the lateral organization of SM at the plasma membrane, in view of its abundance [∼35% of total phospholipid content in human RBCs (26, 27)], and its importance for the formation/maintenance of rafts and their signaling function. By confocal microscopy, fluorescent patches labeled by trace insertion of BODIPY-SM into the plasma membrane of partially spread/stretched RBCs are ∼500 nm in diameter and show a 5- to 8-fold enrichment over the rest of the labeled surface. These domains appear stable in time and space and depend on temperature, membrane tension, cholesterol, and association to the membrane:spectrin anchorage complexes (9–11). Disappearance of BODIPY-SM domains upon inhibition of endogenous SM biosynthesis or surface depletion by SMase pointed to natural SM assemblies (9, 10). However, acyl BODIPY substitution remained an important issue, calling for direct demonstration for endogenous SM lateral organization in living cells.
Using high-resolution imaging mass spectrometry, Kraft and colleagues (8) recently reported the existence of 15N-SL stable submicrometric domains (∼200 nm average diameter) in fixed fibroblasts, which depend on cholesterol and cytoskeleton. Another way to look at endogenous surface lipids, applicable to nonfixed cells, is direct labeling via nontoxic (NT) binding proteins derived from lipid-specific toxins. SM is known to be subverted as a “receptor” for pore-forming toxins such as equinatoxin II [from the sea anemone Actinia equina (28)] and lysenin [from the earthworm Eisenia foetida (29, 30)]. Molecular dissection of lysenin distinguished a pore-forming domain (amino acids 1-160) and a C-terminal SM-binding domain (amino acids 161-297). A chimeric protein made of the latter sequence, as NT lysenin fragment (NT-lysenin), and the fluorescent protein, Dronpa, in the N-terminal position (Dronpa-NT-lysenin) preserved its ability to specifically bind to SM and allowed observation of submicrometric domains (∼250 nm in diameter) by super-resolution microscopy (PALM) on fixed HeLa cells (31).
The main aim of the present study was to assess the lateral organization of endogenous SM in the flat membrane of featureless RBCs by high-resolution confocal imaging. To this aim, we swapped Dronpa, which is best suited to PALM, for the monomeric red fluorescent protein mCherry, which is far more photostable, thus optimal for long-term imaging experiments. This new construct, referred to as His-mCherry-NT-lysenin (lysenin*), also allowed for colabeling with green BODIPY-lipids, so as to address simultaneously the localization of endogenous (red signal) and fluorescent exogenous SM or other polar lipids (green signal). Most crucial, our investigations were carried out in unfixed cells, because conventional formaldehyde-based fixatives do not cross-link lipids and do not arrest lateral protein diffusion (32).
We first validated the binding specificity and innocuity of lysenin* and verified by radio-iodination that trace labeling yielded a visible signal by confocal microscopy. We saw that labeling of endogenous SM on RBCs partially spread onto coverslips revealed comparable submicrometric domains upon insertion of exogenous green BODIPY-SM. Combination of nonsaturating red lysenin* concentration with green BODIPY-SM yielded perfect colocalization and allowed for double labeling with other BODIPY-lipids as well. Lysenin* proved sensitive, convenient, and reliable to address the roles of temperature, cholesterol, and membrane tension for the biogenesis of endogenous SM domains. It also allowed labeling of RBCs gently suspended in a 3D-gel, so as to rule out physical stress imposed on the plasma membrane of partially spread RBCs, and revealed numerous domains. This indicated that submicrometric domains may also occur on circulating RBCs in vivo.
MATERIALS AND METHODS
Expression and purification of lysenin*
The expression plasmid pET28/lysenin* encodes the monomeric C-terminal, nontoxic (NT) domain of the SM-specific toxin, NT-lysenin, that is expressed as a fusion protein with an N-terminal 6xHis-tag followed by the monomeric red fluorescent protein mCherry. It was generated from pET28/His-Dronpa-NT-lysenin (31) by swapping in-frame Dronpa for mCherry sequences using restriction enzymes KpnI (from Klebsiella pneumonia) and HindIII (from Haemophilus influenzae). The resulting plasmid was expanded into Escherichia coli strain BL21 (DE3) and recombinant protein, lysenin*, was expressed in lysogeny broth (LB) medium at 16°C for 72 h in the presence of 0.4 mM isopropyl β-D-thiogalactoside. Bacterial extracts were prepared as previously described (33) and the recombinant protein was purified using an Ni-NTA Superflow cartridge (Qiagen) and eluted with imidazole as in (34). Fraction analysis by SDS-PAGE revealed recombinant lysenin* at the expected size (∼45 kDa). Most enriched fractions were pooled, concentrated, and desalted as described (33), then aliquots were stored in 20 mM NaCl supplemented with 25 mM HEPES (pH 7.2) and 5% glycerol at −80°C until use. Protein concentration was estimated by measuring the absorbance at 280 nm.
RBC isolation and pharmacological treatments
RBCs were isolated from healthy volunteers. This study was approved by the Medical Ethics Institutional Committee of the Université catholique de Louvain; each donor gave written informed consent. Blood was collected by venipuncture into dry EDTA (K+ salt)-coated tubes, diluted 1:10 in DMEM [containing 25 mM glucose and 25 mM HEPES (Invitrogen)], and washed twice by centrifugation at 133 g for 2 min and resuspension. For cholesterol or SM depletion, washed RBCs were respectively preincubated in suspension at 37°C with 0–0.25 mM methyl-β-cyclodextrin (mβCD) (Sigma-Aldrich) for 30 min or at 20°C with 0–10 mU/ml Bacillus cereus SMase (Sigma-Aldrich) for 10 min. RBCs were further pelleted as above and labeled with lysenin* (see below) in the continued presence of mβCD or SMase (as appropriate), pelleted and resuspended in DMEM containing 5 mg/ml BSA then again in DMEM alone, and plated onto coverslips for imaging (see below).
Lysenin* binding to multilamellar vesicles and RBCs
To generate multilamellar vesicles (MLVs), L-α- PC (Sigma-Aldrich), SM (egg, chicken; Avanti Polar Lipids), and cholesterol (Sigma-Aldrich) were prepared essentially as described (35) with some modifications. Briefly, lipids were mixed as follows: i) PC and cholesterol (2:1 molar ratio); or ii) SM, PC, and cholesterol (3:4:5.5 molar ratio). The solvent was evaporated under vacuum (Rotavapor R-210; Buchi, Switzerland) for 2 h to obtain a thin and dried film of lipids. Lipid film was then resuspended in 40 mM Tris-HCl by vortex and five freezing/thawing cycles. Lysenin* was incubated with the resulting MLVs (1:5,000 molar ratio, by reference to total lipids) at 37°C for 30 min and ultracentrifuged twice (60,000 g for 30 min). Alternatively, lysenin* was incubated with washed RBCs [∼1:20 molar ratio, by reference to total lipids estimated from (26)] at 20°C for 30 min and ultracentrifuged once (60,000 g for 30 min). Pellet was resuspended in DMEM supplemented with 1 mg/ml BSA and ultracentrifuged twice more (60,000 g for 15 min).
Pellets containing MLVs or RBCs and supernatants (SNs) were analyzed by Western blotting. Proteins were resolved by SDS-PAGE (in 12% polyacrylamide gels) and transferred onto nitrocellulose membrane (Hybond™-C Extra; Amersham Biosciences, Roosendaal, The Netherlands). After migration and transfer, blots were blocked at room temperature for 1 h in TBS [20 mM Tris-HCl, 0.5M NaCl (pH 7.5)] supplemented with 5% nonfat dry milk and 0.05% Tween 20 and incubated at 4°C overnight with a mouse anti-N-terminal His antibody (1:4,000; GE Healthcare) in TBS containing 1% defatted (DF)-BSA (Sigma-Aldrich), followed by three washes in TBS plus 0.05% Tween 20. Blots were finally incubated at room temperature for 1 h with HRP-conjugated goat anti-mouse IgG (1:10,000; Life Technologies) in TBS supplemented with 5% nonfat dry milk and 0.05% Tween 20 and washed three times in TBS containing 0.05% Tween 20 and once in TBS. Immunoreactive bands were visualized using chemiluminescence (ECL SuperSignal® West Femto; Thermo Scientific) and acquired with a 4000MM Kodak Image Station (Eastman Kodak Co., Rochester, NY).
Lysenin* radio-iodination and binding to RBCs
Lysenin* radio-iodination was performed using precoated iodination tubes according to the manufacturer’s protocol (Pierce). Briefly, 50 μg purified lysenin* was labeled with 1 mCi Na125I to a specific radioactivity of ∼1,500 cpm/ng protein. More than 97% of the radioactivity was precipitable after incubation with 10% (v/v) trichloroacetic acid. Before binding to RBCs, lysenin* was mixed in DMEM containing 1 mg/ml DF-BSA, then cleared of aggregates by centrifugation at 20,000 g for 10 min at 4°C. Freshly isolated and washed RBCs (∼2 × 10⁷ cells in 50 μl) were incubated in suspension with a fixed amount of 125I-lysenin* (0.3 × 10⁶ cpm) mixed with increased concentrations of cold lysenin* at 20°C for 20 min, then washed three times by centrifugation/resuspension. Aliquots of the three SNs and the pellet were counted in a γ counter (2470 Wizard automatic γ counter; Perkin-Elmer). Radioactivity in pooled SNs and pellet was considered as free and bound lysenin*, respectively. When appropriate, RBCs were pretreated with mβCD or SMase, as above, prior to labeling with 0.3 × 10⁶ cpm 125I-lysenin* mixed with 1 μM cold lysenin* in the continuous presence of the pharmacological agents.
RBC labeling with lysenin* and immobilization on coated coverslips and IBIDI chambers or trapping in a gel
Before each experiment, lysenin* in 1 mg/ml DF-BSA was cleared of aggregates by centrifugation at 20,000 g for 10 min as above. Except when otherwise stated, freshly isolated erythrocytes were then incubated in suspension with 1.5 μM lysenin* at 20°C or 37°C and immobilized onto 2 cm2 poly-L-lysine-coated coverslips. Briefly, coverslips were first coated with 0.1 mg/ml poly-L-lysine (70–150 kDa; Sigma-Aldrich) at 20°C for 7 min, then DMEM was added for another 7 min. Poly-L-lysine:DMEM was then removed and coverslips were left to dry for at least 1 h. Washed RBCs (∼107 cells in 25 μl) were plated onto a coated coverslip at 20°C for exactly 4 min, then the suspension was removed and replaced by fresh medium, and attached RBCs were allowed to spread for another 4 min (except for colocalization with BODIPY-lipids, see below). This led to a variable level of stretching, exploited in Figs. 7, 8, and supplementary Fig. VI. Alternatively, RBCs were spread onto poly-D-lysine-coated coverslips (Sigma-Aldrich) or dropped into IBIDI (IBIDI, Proxylab) chambers compatible with high-resolution confocal microscopy. For RBC suspension in a 3D mounting cold hydrogel (CyGel Sustain, Biostatus), labeled RBCs were washed by two centrifugations and resuspended in CyGel at 4°C. The solution was then dropped on a coverslip, placed upside down on Lab-Tek chamber, and observed at 37°C.
Fig. 7.
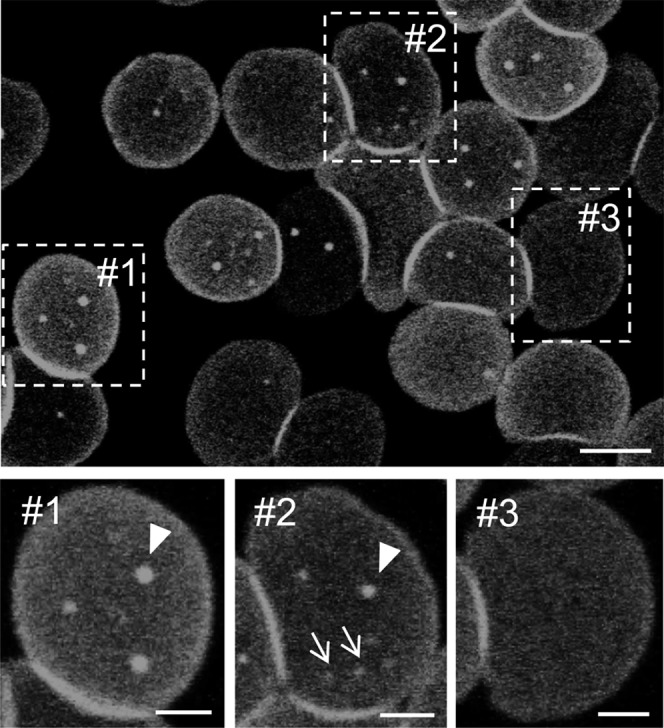
Abundance, size, and localization of endogenous SM submicrometric domains depend on RBC spreading stage. RBCs were labeled in suspension with lysenin* at room temperature, allowed to attach onto poly-L-lysine-coverslips, placed upside-down in Lab-Tek chambers, and directly analyzed by confocal microscopy. This led to three stages of RBC spreading corresponding to differential domain abundance, size, and localization: i) stage #1, notice minimal spreading and strongest peripheral labeling, associated with large central domains (arrowhead); ii) stage #2, intermediate spreading associated with both large central (arrowhead) and small peripheral domains (arrows); and iii) stage #3, most spread RBCs, with only diffuse homogenous lysenin* labeling but no domain. Scale bars for general view, 5 μm; insets, 2 μm. Representative images from >20 experiments.
Fig. 8.

Coexistence between endogenous SM domains and BODIPY-PC and -GSL (GlcCer, GM1) domains depends on membrane tension and lipid class. Erythrocytes were sequentially labeled in suspension with lysenin* (red at merge), attached onto poly-L-lysine-coverslips, and labeled with exogenous BODIPY-PC (a, d), -GM1 (b, e), or -GlcCer (c, f) (green at merge); all at 20°C (a, d) or 37°C (b, c, e, f), to maximize domain abundance in each condition (9, 10). This procedure led to three patterns of RBCs, as in Fig. 7; only stage #1 (a–c) and stage #2 (d–f) RBCs are presented. Notice large colocalization between lysenin* and the three BODIPY-lipids (yellow arrowheads) on stage #1 RBCs, contrasting with larger dissociation on stage #2 RBCs (white arrowheads, domains decorated by BODIPY-lipids only; red arrowheads, domains labeled by lysenin* only). Representative of at least three independent experiments for each BODIPY-lipid. Scale bars, 2 μm.
RBC labeling with TMA-DPH and BODIPY-lipids
RBCs were labeled with the lipidomimetic dye, 1-(4-trimethylammoniumphenyl)-6-phenyl-1,3,5-hexatriene p-toluenesulfonate (TMA-DPH), as described in (9). Double labeling with lysenin* and BODIPY-lipids [BODIPY-SM, -GM1, -GlcCer, and -PC, either from Invitrogen or synthesized; for structures see (9, 10)] was performed as follows: RBCs were labeled in suspension for 20 min with lysenin* at 20°C or 37°C as specified, washed, attached onto coated coverslips for 4 min, and labeled with BODIPY-lipids at 20°C (BODIPY-SM and -PC) or 37°C (BODIPY-GM1 and -GlcCer) for 15 min in the absence of lysenin*. Double labeling with lysenin* and BODIPY-SM was also performed as follows: sequential labeling in suspension with BODIPY-SM for 15 min, then with lysenin* for 20 min in the continuous presence of BODIPY-SM, washing, and attaching/spreading onto coated coverslips as above.
Confocal vital imaging and FRAP
For confocal imaging, coverslips were placed upside-down into Lab-Tek chambers. Alternatively, RBCs were dropped onto uncoated plastic IBIDI chambers compatible with high-resolution microscopy. Cells were examined with a Zeiss LSM510 confocal microscope using a plan-Apochromat 63× numerical aperture 1.4 oil immersion objective in a thermostated cabinet (XL/LSM incubator, Zeiss; Tempcontrol 37-2, PeCon) (9–11). FRAP was performed as previously described (9–11) at 37°C by photobleaching ∼2.5 μm2 regions of interest to minimal residual fluorescence intensity: this required six iterations at 100% laser power, due to the high photostability of mCherry.
Scanning electron microscopy
Erythrocytes spread onto poly-L-lysine-coated coverslips and labeled or not with lysenin* were extensively washed with DMEM, fixed with 15 mM dimethylsuberimidate (pH 8.0) at room temperature for 20 min, rinsed twice in 0.14M cacodylate buffer (pH 7.4), and fixed with 1% glutaraldehyde in cacodylate buffer at 4°C overnight. The next day, samples were extensively washed in 0.1M cacodylate buffer and postfixed with 1% (w/v) osmium tetroxide at 4°C for 30 min. Samples were then dehydrated in graded ethanol series and critical-point dried (CPD 300, Leica, Austria). A 10 nm gold film was sputter-coated, and specimens were observed in a CM12 electron microscope at 80 kV with the use of the secondary electron detector (Philips, Eindhoven, The Netherlands).
SM measurements
Lipids were extracted in chloroform/methanol and stirred. Samples were then centrifuged (3,320 g for 15 min) at room temperature and the organic phase was collected and washed with 0.05M NaCl. After stirring and centrifugation, the organic phase was washed again twice by addition of 0.36M CaCl2/methanol (1:1; v/v). After stirring and centrifugation, Triton X-100 in acetone was added to the organic phase, which was then dried under nitrogen flow at room temperature and resuspended in water. Extracted lipids were then analyzed with a fluorometric SM assay kit (Abcam). Alternatively, lipids were separated by thin layer chromatography in chloroform:methanol:15 mM CaCl2 (65:35:8; v/v/v) (36) and revealed by charring densitometry after staining with 10% cupric sulfate in 8% O-phosphoric acid (37). Band intensity of SM was quantified and expressed by reference to the band corresponding to PC from the same sample and finally expressed as percentage of control.
Hemolysis
To evaluate the innocuity of lysenin*, RBCs were incubated in suspension with the indicated concentrations of lysenin* at 37°C for 30 min and then centrifuged (133 g for 2 min). To determine the innocuity of pharmacological agents, RBCs were either incubated with the indicated concentrations of SMase at 20°C for 30 min or with mβCD as in (11). Hemoglobin released in SNs was then read at 560 nm in 96-well plates (SpectraCountTM, Packard BioScience Co.). For normalization as 100% value, full hemolysis was achieved by 0.2% Triton X-100.
RESULTS
Specific binding of lysenin* to SM in artificial and natural membranes
By swapping Dronpa for mCherry, we generated a useful probe consisting of an N-terminal His tag fused to mCherry and the NT C-terminal domain of lysenin*, as the minimal fragment able to recognize SM (38). By Western blotting anti-His tag, two bands can be observed, one at ∼45 kDa, corresponding to full lysenin*, and an N-terminal spurious fragment at ∼30 kDa (lanes 5 and 3 in Fig. 1A, B, respectively). As expected, the latter was not detected in the pellet, neither from MLVs (lane 1 in Fig. 1A) nor from RBCs (lane 1 in Fig. 1B), indicating binding specificity of the full lysenin*. In addition, lysenin* only bound to and sedimented with liposomes when containing SM, indicating specific interaction with SM in model membranes (Fig. 1A, compare lanes 1 and 3). Moreover, 125I-lysenin* binding to RBCs was almost completely abrogated by 10 mU/ml SMase (Fig. 1C), supporting specific interaction with SM also in RBCs. This treatment decreased the SM level by ∼60% (supplementary Fig. IB) without inducing hemolysis (supplementary Fig. IA) or affecting cholesterol, PC, and phosphatidylethanolamine contents (as evaluated by Amplex Red cholesterol assay kit and thin layer chromatography; data not shown). These data established that SM was necessary and sufficient for lysenin* binding to membranes and validated its use as a specific reporter of endogenous SM at the outer leaflet of RBCs. Moreover, up to 7.5 μM lysenin* showed no toxicity, as indicated by hemolysis assay (supplementary Fig. II).
Fig. 1.

Specificity and quantification of lysenin* binding to endogenous SM in liposomes and RBCs in suspension. A, B: Specific binding of full lysenin*, but not its fragment at ∼30 kDa, to MLVs containing SM and to RBCs. A: Lysenin* was incubated or not (lane 5) with MLVs (1:5,000 molar ratio by reference to total lipids) containing SM (+SM; lanes 1 and 2) or not (−SM; lanes 3 and 4). B: Lysenin* was incubated or not (lane 3) in suspension with freshly isolated RBCs (∼1:20 molar ratio). After centrifugation, pellets (P) containing MLVs (A) or RBCs (B) and supernatants (SN) were analyzed by Western blotting for His-tag on lysenin*. Relative molecular masses (Mr) are indicated on the right. Arrowheads at left point to the expected position of full lysenin* (∼45 kDa). Pelleting of lysenin* depends on SM incorporation into liposomes. An N-terminal spurious fragment at ∼30 kDa was not detected in the pellet (P), neither after incubation with MLVs nor with RBCs. Representative blot from two independent experiments (A) and one experiment (B). C: Specific binding of 125I-lysenin* to SM in RBCs. Freshly isolated RBCs were either kept untreated (open bar) or depleted of SM by 10 mU/ml SMase (filled bar) prior to labeling in suspension with 125I-lysenin* (0.3 × 10⁶ cpm) mixed with 1 μM cold lysenin* (in the continued presence of SMase at right). After washing by centrifugation/resuspension, counts per minute of 125I-lysenin* bound to RBCs were measured and expressed as percentage of control cells. SM depletion decreases lysenin* binding by ∼90%. D: Binding isotherm of 125I-lysenin* to RBCs. RBCs were incubated in suspension with 125I-lysenin* (0.3 × 10⁶ cpm) together with the indicated concentrations of cold lysenin*. Bound lysenin* is expressed as (molecules/RBC) × 106 and is presented as the mean ± SEM of three samples. Representative of two independent experiments. E: Scatchard plot of data in (D). Bound values represent (molecules/RBC) × 106 and bound/free ratios are in nl/RBC. It has to be noticed that free values represent both the free “RBC-bindable” full lysenin* (∼45 kDa) and the “non-bindable” fragment (∼30 kDa).
Quantification of accessible lysenin* binding sites
To determine binding parameters of the interaction between lysenin* and SM, RBCs were incubated with increasing 125I-lysenin* concentrations. Binding roughly increased in proportion with concentration until ∼2.5 μM, then leveled off to reach saturation at ∼3.5 × 10⁶ lysenin* molecules bound per RBC. Analysis by Scatchard plot revealed a single class of binding sites (Fig. 1D, E). Unless otherwise stated, a nonsaturating lysenin* concentration was used hereafter (≤1.5 μM). Three conclusions were derived. First, in this assay, lysenin* specifically and exclusively interacted with SM at the outer RBC membrane leaflet. Second, the estimated level of occupancy at saturated lysenin* binding was ∼3% of SM abundance in this leaflet, estimated at ∼108 per RBC (26). Third, the single component in the Scatchard plot was compatible with monovalent lysenin*:SM interaction.
Like exogenous BODIPY-SM, lysenin* labels submicrometric domains on RBCs partially spread onto poly-L-lysine coverslips
These conclusions encouraged us to use lysenin* as a SM-specific probe for vital confocal imaging. When RBCs were labeled in suspension with 1.25 μM lysenin*, then partially spread onto poly-L-lysine-treated coverslips, a limited number of well-defined round submicrometric domains were observed on most cells (Fig. 2Aa). Such fluorescent patches were undistinguishable in size and shape from those observed upon exogenous BODIPY-SM insertion into the outer plasma membrane leaflet of partially spread/stretched RBCs [compare Fig. 2Ab with Fig. 2Aa; see also (9, 10)]. Lysenin*-labeled submicrometric domains vanished upon moderate SM digestion (∼25%) by 3 mU/ml SMase, whereas diffuse labeling was largely preserved. At higher SM digestion (∼60% by 10 mU/ml SMase), both submicrometric domains and diffuse lysenin* labeling were strongly decreased (supplementary Fig. IC). Domains were also observed upon spreading onto coverslips precoated with poly-D-lysine instead of poly-L-lysine (supplementary Fig. IIIa–c) and on loosely attached stomatocytes/discocytes in plastic IBIDI chambers (supplementary Fig. IIId–f), ruling out specific artifact due to poly-L-lysine-coverslip spreading. These experiments indicated that endogenous SM formed submicrometric domains, readily decorated by lysenin*.
Fig. 2.

Comparison of SM domains on partially spread RBCs after labeling of endogenous SM by lysenin* or insertion of exogenous BODIPY-SM. A: Like inserted exogenous BODIPY-SM, lysenin* labels submicrometric domains. In (a), freshly isolated RBCs were labeled in suspension by lysenin* at 37°C. After washing, RBCs were attached-spread onto poly-L-lysine-coated coverslips. In (b), RBCs were attached-spread on poly-L-lysine coverslips before insertion of BODIPY-SM at 37°C. All coverslips were washed, placed upside down in Lab-Tek chambers, and immediately examined at 37°C. Representative images of >20 experiments in (a); for (b), see additional images in (9-11)’. All scale bars, 2 μm. B: Colocalization between BODIPY-SM and lysenin* at nonsaturating concentration versus steric hindrance upon saturation of lysenin* binding. RBCs were labeled in suspension with lysenin* at 1.25 μM [∼40% saturation (a); see Fig. 1D] or 2.5 μM [quasi saturation (b)], attached-spread on poly-L-lysine coverslips, then labeled with exogenous BODIPY-SM in the absence of lysenin*. Domains boxed at left are enlarged at right. At nonsaturating lysenin* concentration (a), notice perfect colocalization with BODIPY-SM, presented by BSA as carrier, contrasting with impaired accessibility in large domains labeled at saturating lysenin* concentration (b). In (b’), the left panel reproduces merge of (b) to define line intensity profile, shown at right. Notice the signal saturation in the large lysenin* domains (numbered 1, 3, 5) with minimal enrichment of BODIPY-SM, but comparable enrichment of both BODIPY-SM and lysenin* in the smaller domains (numbered 2, 4). Representative images of two to three independent experiments. Scale bars, 2 μm; 0.5 μm in insets. For the effect of the sequence of labeling procedure, see supplementary Fig. IV.
Next, to address independently whether lysenin* was an “innocent” probe or might affect domain formation, we looked at the effect of an ∼10-fold lysenin* concentration range on the number, size, and fluorescence intensity of labeled domains. In practice, to avoid saturation of detectors by emitted fluorescence, we analyzed two series of concentrations (from 2.5 to 5 μM and from 0.6 to 2.5 μM) using identical settings for image acquisition in each, then fluorescence intensity was normalized to the average signal obtained at the common 2.5 μM concentration. Increasing lysenin* concentrations changed neither the abundance nor the size of domains (∼0.5 μm diameter on average; data not shown), but their average fluorescence intensity increased proportionally with concentration up to 5 μM (profiles in Fig. 3A, B and quantification in Fig. 3C; provided light-saturated profiles were excluded). A 4- to 12-fold enrichment was observed in this concentration range. We concluded that lysenin* did not induce SM domain formation or expansion, and could instead be used as a reliable probe to detect variations in local SM concentration.
Fig. 3.

In partially spread RBCs, nonsaturated fluorescence intensity of submicrometric domains is proportional to lysenin* concentration. A, B: Confocal imaging and fluorescence intensity at increasing lysenin* concentration. RBCs were labeled in suspension at 37°C with the indicated concentrations of lysenin*, attached onto poly-L-lysine-coated coverslips, and examined by confocal microscopy using the same settings for image acquisition for the two indicated concentrations in (A) and the three indicated concentrations in (B). All scale bars, 2 μm. Right panels show line intensity profiles along the paths indicated at left by broken lines. Numbers refer to the indicated domains and broken lines on the right indicate the baseline for diffuse membrane labeling. SM domain abundance and size (∼0.5 μm in diameter; determined for 75–137 RBCs from 1.25 to 5 μM) do not significantly differ, but fluorescence in nonsaturated domains increases with lysenin* concentration. C: Quantification of fluorescence intensity as a function of lysenin* concentration. Lysenin* enrichment values (peak intensity/baseline ratio) at each tested lysenin* concentration are presented as mean ± SEM of 12–31 domains tested in the two experiments and are expressed as percent of enrichment at 2.5 μM lysenin*, after exclusion of domains with saturated profile.
Colocalization between lysenin* and BODIPY-SM domains is independent of the order of labeling but depends on lysenin* enrichment
Because lysenin*-labeled submicrometric domains enriched in endogenous SM that were seen on partially spread RBCs appeared undistinguishable from those revealed upon insertion of exogenous BODIPY-SM, locally delivered by the bulky protein BSA as carrier, we performed double labeling experiments with non- or sub-saturating lysenin* concentrations (see Fig. 1D), using two orders of probe addition. When erythrocytes were first labeled in suspension with lysenin* at low (non-saturating) concentration (1.25 μM) then incubated with BODIPY-SM in the absence of toxin, all domains were double labeled by lysenin* and BODIPY-SM (Fig. 2Ba). At higher lysenin* concentration (2.5 μM), moderately lysenin*-labeled domains remained equally labeled by BODIPY-SM (yellow arrowheads in Fig. 2Bb), but accessibility of BODIPY-SM to lysenin*-saturated domains was strongly reduced (red arrowheads in Fig. 2Bb; intensity profiles in ). However, when the order was reversed (i.e., RBCs sequentially labeled in suspension with BODIPY-SM then with 2.5 μM lysenin* in the continued presence of BODIPY-SM), SM domains showed perfect colocalization (supplementary Fig. IV), suggesting that lysenin* is able to recognize both endogenous SM and BODIPY-SM. The identity between endogenous SM domains decorated by nonsaturating lysenin* concentrations or revealed upon insertion of the exogenous analog, BODIPY-SM, validated a posteriori the latter tracer as a bona fide qualitative probe. The partial loss of accessibility to BODIPY-SM:BSA complexes (∼68 kDa) upon saturating lysenin* labeling (∼45 kDa) can be readily explained by a steric hindrance and is consistent with the observed 4- to 12-fold enrichment of lysenin* in the submicrometric SM domains.
BODIPY-SM- and lysenin*-labeled endogenous SM submicrometric domains are regulated by temperature and cholesterol
Despite our evidence indicating that BODIPY-SM can be used as a qualitative vital tracer of SM submicrometric domains, the spatial identity between BODIPY-SM- and lysenin*-labeled patches did not yet exclude an effect of the inserted BODIPY moiety on the functional properties of the SM domains. Because we had previously shown that temperature and cholesterol regulated the abundance of BODIPY-SM domains (9–11), we next investigated whether they likewise affected endogenous SM submicrometric domains labeled by lysenin*. As shown in Fig. 4A, confocal imaging of erythrocytes labeled with lysenin* revealed well-defined submicrometric patches at all examined temperatures (from 10°C to 42°C), but the number of domains varied with temperature, peaking at 20°C (Fig. 4B), as previously reported upon BODIPY-SM insertion (9).
Fig. 4.
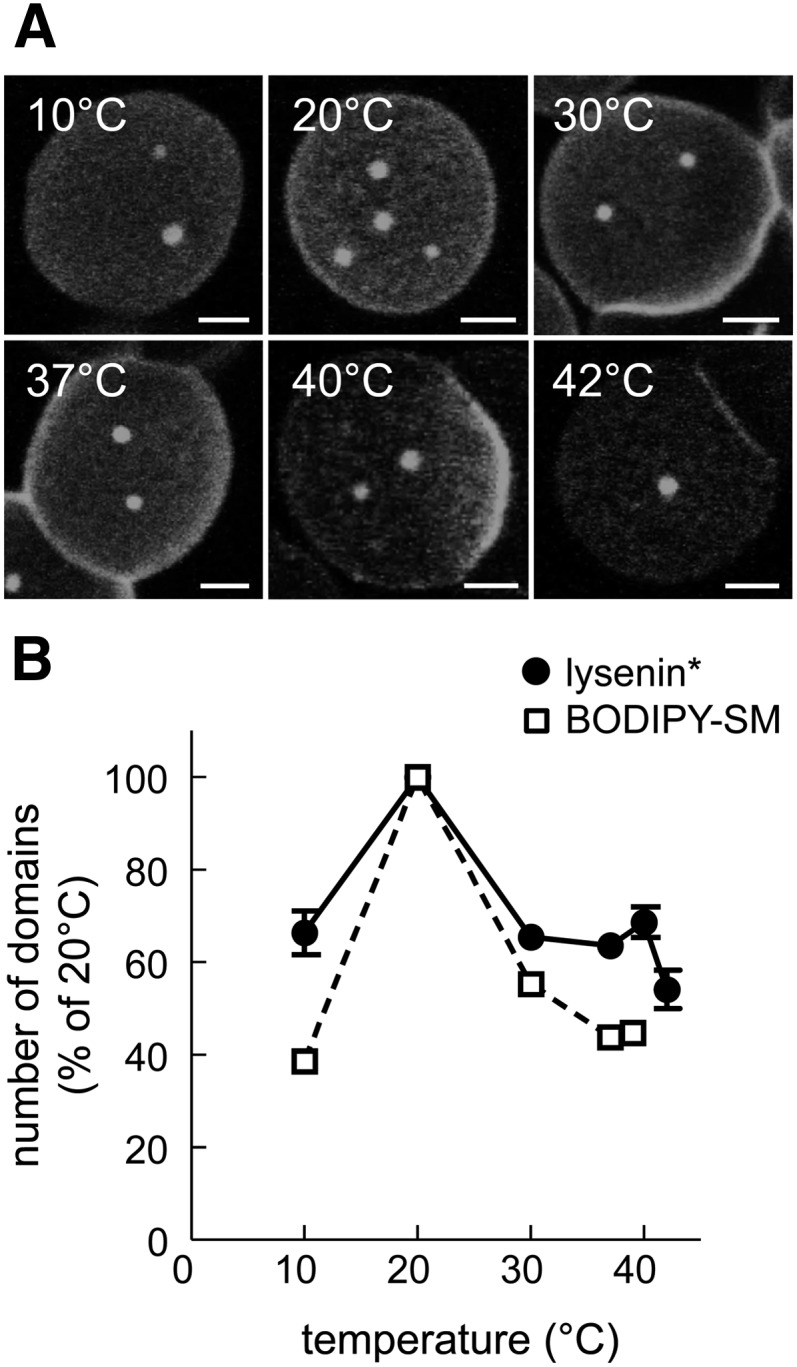
Abundance of endogenous SM submicrometric domains depends on temperature. A: Confocal imaging. RBCs were incubated in suspension with lysenin* at the indicated temperatures, washed, attached-spread onto poly-L-lysine-coated coverslips, and examined in Lab-Tek chambers at the same temperature as for labeling. All scale bars, 2 μm. B: Morphometry. The number of domains labeled by lysenin* (filled circles) was recorded per hemi-cell surface at the indicated temperatures and is expressed as the percentage of domain number at 20°C (mean ± SEM of two to five independent experiments with 56 to 1,568 cells; except at 40°C, one experiment with 174 cells). Open squares are numbers of BODIPY-SM domains recorded under identical conditions [reproduced from (9) for comparison purposes]. Notice the maximal labeling of endogenous SM domains by lysenin* and the insertion of exogenous BODIPY-SM at 20°C.
The role of cholesterol was next examined in RBCs at 37°C using partial depletion by mβCD. At 0.25 mM, this treatment led to an ∼25% cholesterol depletion without causing any hemolysis (11) or affecting the endogenous SM content (data not shown). This moderate cholesterol depletion strongly decreased lysenin* domain abundance (Fig. 5A and general views in supplementary Fig. V). However, total binding of 125I-lysenin* to RBCs was unaffected (Fig. 5B), indicating that loss of SM domains was not due to impaired lysenin* binding, but reflected a crucial role of cholesterol in their stabilization. Taken together, these results showed that, as observed after exogenous BODIPY-SM insertion, endogenous SM submicrometric domain abundance depends on both temperature and membrane cholesterol content. Moreover, they confirmed a role for lipid phase behavior and cholesterol in SM domain formation and/or maintenance.
Fig. 5.
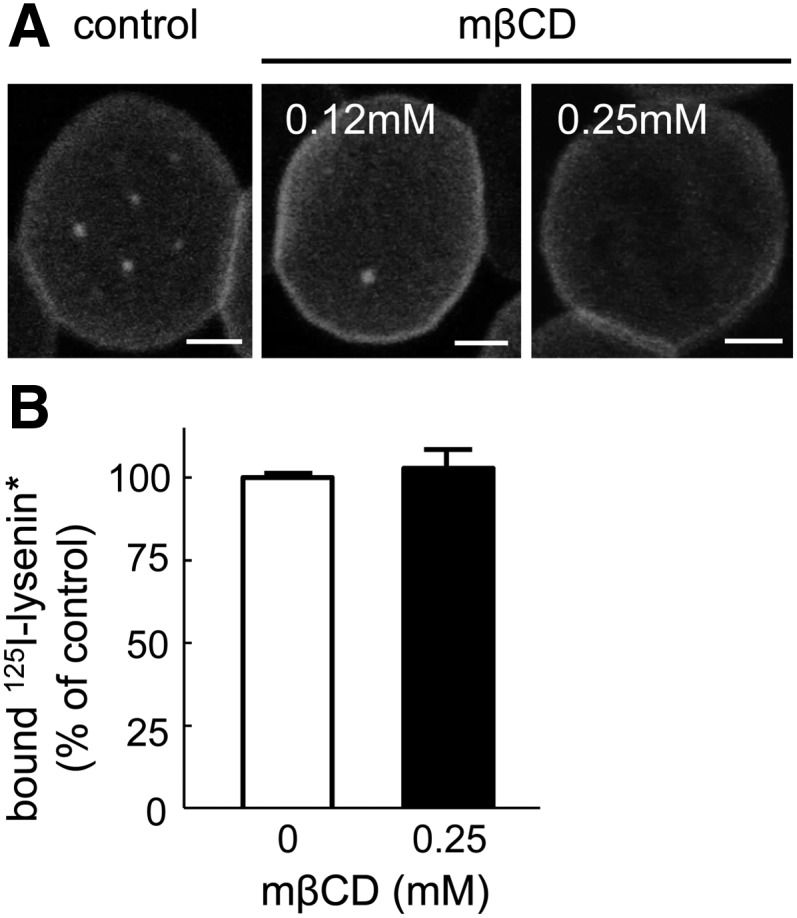
Abundance of endogenous SM submicrometric domains depends on membrane cholesterol. A: Moderate cholesterol depletion strongly decreases endogenous SM domain abundance. RBCs were treated in suspension with the indicated mβCD concentrations (∼75% residual cholesterol at 0.25 mM), then incubated with lysenin*, attached-spread onto poly-L-lysine-coverslips, and observed by confocal microscopy at identical settings in all conditions. Scale bars, 2 μm. Representative of six independent experiments. For views with multiple cells, see supplementary Fig. V. B: Moderate cholesterol depletion does not affect 125I-lysenin* binding to RBCs. RBCs were either kept untreated (open bar) or depleted in cholesterol by 0.25 mM mβCD (filled bar) prior to labeling by 125I-lysenin* mixed with cold lysenin* as in Fig. 1C. After washing, 125I-lysenin* bound to RBCs was expressed as the percentage of control and presented as mean ± SEM.
BODIPY-SM and endogenous SM submicrometric domains are stable in time and space
Because the plasma membrane of RBCs is stabilized by a strong tangential spectrin network connected by two nonredundant perpendicular anchorage complexes (39), we looked at SM submicrometric domain stability using FRAP on lysenin*-labeled domains. Despite high mCherry photoresistance, up to 50% photobleaching could be reached. As shown in Fig. 6A, domains in unbleached and bleached areas (white square) retained a fixed position and a comparable size over an interval of ∼2 min, compatible with retention by the spectrin cytoskeleton, at least in partially spread RBCs. By FRAP, ∼60% of fluorescence recovery was obtained in bleached areas, with a t1/2 of ∼30 s (Fig. 6B). For reference, BODIPY-SM domains showed an ∼75% recovery, with a t1/2 of ∼10 s (11). These results indicated that SM submicrometric domains are stable assemblies, in time and space, of highly dynamic individual lipids/clusters. The slower restoration of lysenin* signal in submicrometric domains by nonbleached lipids, as compared with BODIPY-SM, could be attributed to the much larger individual size and/or steric hindrance of the conjugated toxin fragment.
Fig. 6.
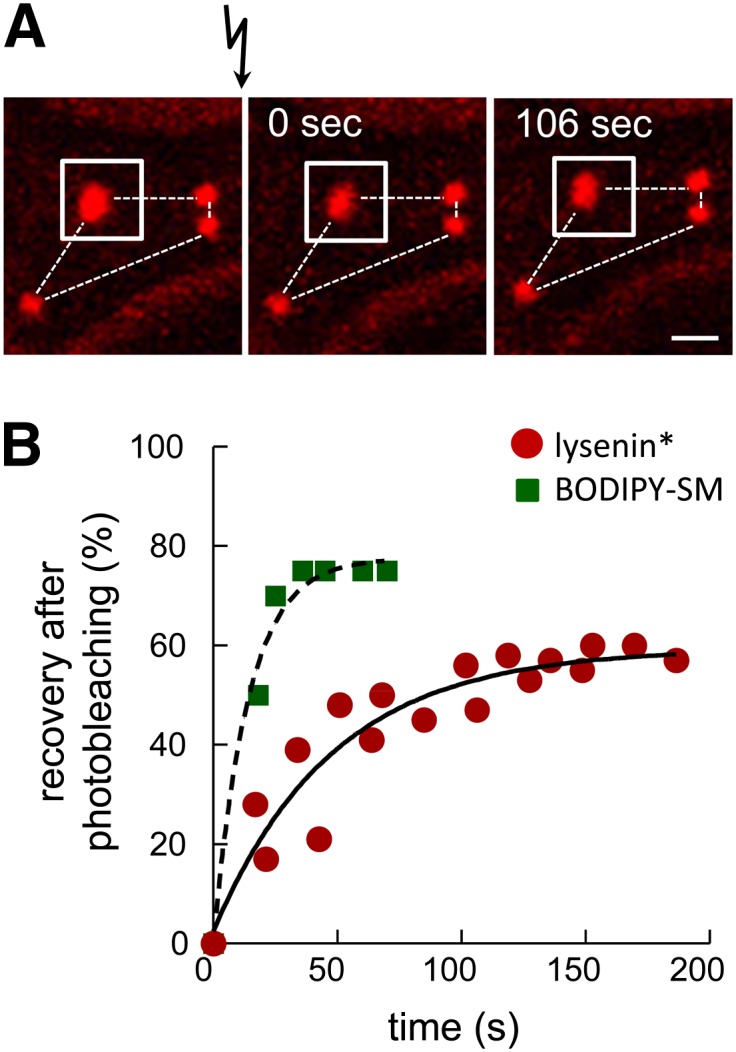
Endogenous SM submicrometric domains assume fixed position but exchange their constituents. Analysis by FRAP at 37°C in ∼2.5 μm2 fields centered on endogenous SM submicrometric domain [white squares in (A)] at the indicated time intervals after photobleaching. A: Representative vital imaging. Flash arrow indicates bleaching of area shown by the white squares. As expected, mCherry is only partially (<50%) photobleached. Notice the immobility in the space of all domains (fixed positions as in constellations, dotted lines). Scale bar, 1 μm. B: Quantification. Red circles, lysenin* (means of five bleached domains from two independent experiments); green squares, BODIPY-SM [reproduced from (11) for comparison purposes]. Fluorescence recovery is expressed as percentage of signal before photobleaching, after correction of residual fluorescence immediately after bleaching. Curves derived by monoexponential fitting. As compared with BODIPY-SM domains (green squares, t1/2 ∼10 s; ∼75% maximal recovery), notice the expected slower (t1/2 ∼33 s) and decreased fluorescence recovery (∼60% at infinite time) of endogenous SM domains decorated by lysenin* (red circles).
Endogenous SM submicrometric domain abundance, size, and positioning depend on RBC spreading
Based on similar properties of lysenin* and BODIPY-SM domains, we next took advantage of mCherry photostability to analyze in detail the relationship between the presence of domains and membrane tension, as first indicated by the extent of spreading. In our previous report on BODIPY-SM domains, we simply distinguished two stages: partially versus extensively spread RBCs, the former bearing domains and the latter not (11). After careful analysis of a larger number of RBCs labeled by low lysenin* concentration, three different patterns, related to increasing stage of spreading, could be distinguished: i) stage #1, with minimal spreading (as suggested by combination of smaller average total area with strongest diffuse label at the cell margin, indicating projection of micrometer-thick membrane curvature), showed mostly large domains with central location (arrowhead in Fig. 7, inset #1); ii) stage #2, with more spreading (increased average total area and lesser marginal signal), displayed not only large central domains as above (arrowhead) but also smaller domains that extended toward the cell periphery (arrows in Fig. 7, inset #2); and iii) stage #3, with most stretched RBCs (largest average cell area and little or no peripheral signal), displayed no detectable enriched domain over the diffuse labeling (Fig. 7, inset #3). Irrespectively of the RBC spreading level, domains did not reflect “anatomical” features, such as surface projection or vesiculation. Indeed, in contrast to lysenin*, TMA-DPH, a “bulk” membrane tracer (40), did not cluster at the RBC plasma membrane into round domains (supplementary Fig. VI). RBC surface was further analyzed by high-resolution scanning electron microscopy, first without labeling to verify the preservation of its smooth membrane under control conditions, then after labeling with lysenin* to exclude formation of membrane protrusion. As shown in supplementary Fig. VIIa, untreated poly-L-lysine-coated RBCs fixed with dimethylsuberimidate showed a smooth surface devoid of spicules and microvesicles. Upon labeling with lysenin* and subsequent fixation with dimethylsuberimidate, domains appeared undistinguishable as observed in living cells (supplementary Fig. VIIb’) and the RBC surface remained free of spicules and protrusions [compare panels (a) and (b) in supplementary Fig. VII].
Segregation between endogenous SM domains and other lipids depends on RBC spreading
Using a combination of green BODIPY (BODIPY505) derivatives of GSLs (GlcCer and GM1) and PC, and a red BODIPY (BODIPY589) derivative of GlcCer, we recently reported discrimination between PC and GlcCer domains contrasting with large colocalization of GlcCer with GM1 (10). However, because red BODIPY is a more bulky fluorophore than green BODIPY, we remained concerned by perturbations of fluorophore-substituted fatty acyl chain lateral interactions within the outer membrane leaflet. To further investigate this issue, we took advantage of red lysenin* to perform double-vital imaging under more reliable conditions. As shown in Fig. 8, we found that the relation between endogenous SM labeled by low lysenin* concentration (1.25 μM) and other lipids depends on RBC membrane stretching and the lipid class. On stage #1 RBCs, all green BODIPY-PC and -GM1 domains coincided with lysenin* domains (yellow arrowheads in Fig. 8a, b). BODIPY-GlcCer also partially colocalized with lysenin* domains, but additional spots were only labeled by BODIPY-GlcCer (white arrow in Fig. 8c), which can be reasonably attributed to the higher melting temperature of GlcCer than GM1, SM, and PC. However, further stretching (stage #2 RBCs) promoted segregation between red lysenin* domains (red arrowheads in ) and the three BODIPY-lipids (white arrowheads in ). The question was irrelevant for stage #3 where SM domains were absent. These results raised the hypothesis that SM differentially associates with PC, GM1, and GlcCer, according to the balance between intrinsic packing (reflected by melting temperature) and membrane tension.
Lysenin* also labels SM submicrometric domains on RBCs in suspension in a gel
Finally, because spreading onto coverslips induces an artificially flat conformation, different from the biconcave ovoid shape of circulating RBCs, we developed an alternative technique to visualize erythrocytes by high-resolution confocal vital imaging after suspension in a 3D-gel. Gentle suspension of lysenin*-labeled RBCs into the gel, which better preserved their ovoid shape, revealed more SM submicrometric domains than after stretching (Fig. 9). This key observation demonstrated that domains were not an experimental artifact limited to stretched RBCs, but were probably a relevant feature of erythrocytes circulating in the blood. However, variation in size and close proximity between domains precluded rigorous analysis at this preliminary stage.
Fig. 9.
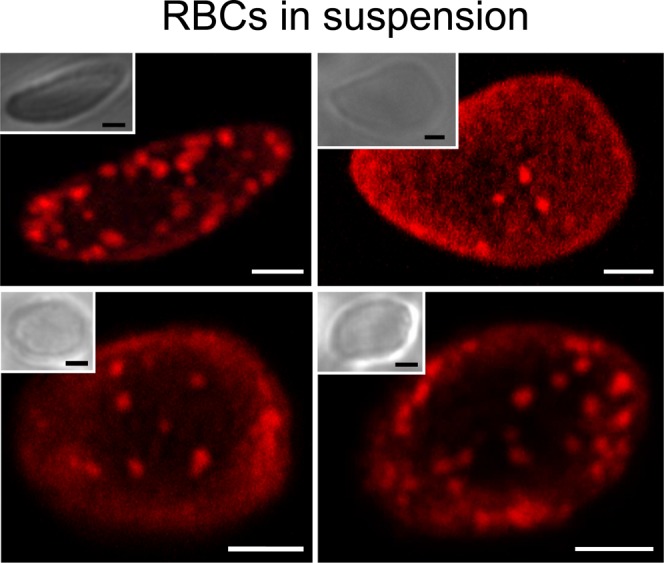
Evidence of SM submicrometric domains on RBCs in suspension. RBCs were labeled with lysenin* at 37°C then maintained in suspension in a cold gel compatible with living cells (CyGelTM, BioStatus) and directly examined by confocal microscopy at 37°C. Images are representative of two independent experiments. All scale bars, 2 μm.
DISCUSSION
Overview
We here addressed the lateral organization of endogenous SM decorated by lysenin* in RBCs. Three major conclusions were derived. First, lysenin* is a new, reliable, versatile, and quantitative probe to directly study SM localization by confocal imaging, and may have broad applications in biology. In retrospect, this probe of endogenous SM validates our previous observations on SM submicrometric domains using insertion of exogenous BODIPY-SM into partially spread nonfixed RBCs. This main conclusion, derived from two vital imaging tools, is also entirely consistent with recent evidence by high-resolution methods in fixed cells (8, 31, 38, 41). Second, we provide basic mechanistic insights on domain composition and regulation, based on lipid phase transition (temperature), cholesterol, and membrane tension. Third, the abundance of SM domains in gently suspended (ovoid shape), nonstretched, and nonfixed erythrocytes strongly supports their relevance for circulating erythrocytes in vivo.
Selection of human RBCs as the simplest and most characterized cell system
We selected human RBCs as the simplest and most robust eukaryotic cell system, for which membrane lipid composition (42), proteome (43), and cytoskeletal control (39) are extensively characterized. In contrast to other eukaryotic cells, the absence of vesicular trafficking avoids any confusion with peripheral endosomes. Most importantly, scanning electron microscopy confirmed the flat RBC surface, i.e., lack of structural features such as membrane projections that are typical of most other cells. These membrane projections would artificially increase membrane area in confocal image pixels, because of superposition of perpendicular clustered objects, in the nonresolved thickness of the optical sections. Normal RBCs resist severe deformation (including the >10,000 “quality controls” across tiny splenic pores in their 120 day lifetime). Robustness and deformability of RBCs are attributed to high cholesterol content, that regulates lipid ordering and membrane fluidity, as well as to strong plasma membrane anchorage to the underlying spectrin network via two nonredundant anchorage complexes, ankyrin and 4.1R complexes (39).
Lysenin* binding specificity and validation as nonperturbing probe
We first confirmed the specificity of lysenin* for SM, based on: i) selective binding to pelletable liposomes when containing SM, but not when containing PC (which bears the same phosphocholine headgroup); and ii) suppression by SMase of 125I-lysenin* binding and lysenin* labeling of submicrometric domains. Taken together with previous observations (44), our data are consistent with recognition by the C-terminal domain of lysenin* of the linkage between the phosphocholine headgroup and the ceramide backbone of SM, as suggested for equinatoxin II, another SM-specific toxin (28).
In contrast to insertion of exogenous fluorescent lipid analogs, toxins offer several advantages: i) targeting of nonmodified endogenous lipids; ii) versatile coupling with fluorescent proteins or fluorophores; and iii) successful labeling of cells in 3D-gels, which we failed to achieve using BODIPY-SM:BSA. However, only a few lipid-specific fluorescent toxins are validated so far (45); and admittedly, their size is much greater than the targeted lipid (e.g., projected diameter of lysenin* is ∼15 times larger than endogenous SM). This size discrepancy predicts steric hindrance but does not preclude specificity, as perhaps best exemplified by EGF-ferritin conjugates for which grafting a ∼450 kDa ferritin moiety allowed us to faithfully follow the fate of the small EGF molecule [∼6 kDa; (46)]. Complementarity between lipid analogs and lipid-specific toxins, when available, is illustrated by this paper.
Binding isotherms based on isotopic dilution of 125I-lysenin* allowed us to derive the fractional level of SM occupancy by comparison to total SM, estimated at ∼108 per RBC (26). At low lysenin* concentration (1.25 μM), sufficient for adequate labeling of SM domains, ∼1.3 × 10⁶ lysenin* molecules were bound per RBC, i.e., ∼1% of total SM, demonstrating tracer occupancy and suggesting minimal perturbation, if any. Indeed, higher lysenin* concentrations changed neither domain number nor area, but proportionally increased their labeling intensity, indicating that domains were not induced, but rather revealed, by lysenin*. Moreover, the single component in the Scatchard plot was compatible with monovalent lysenin*:SM interaction onto RBC plasma membrane. Furthermore, up to 7.5 μM lysenin*, no detectable hemolysis was induced.
Estimation of the SM surface coverage by lysenin* and of the size of SM submicrometric domains
Comparing the surface projection of lysenin* [∼45 kDa; 10 nm2 (47)] with that of SM (0.7 nm2), values above imply that <20% of the RBC surface occupied by SM was covered by lysenin*. Based on the average number of domains per hemi-RBC in our routine conditions (∼4–5), the average surface area of individual domains (∼0.2 μm2) and their fluorescence enrichment at 1.25 μM (∼4-fold) combined with the known surface area of hemi-RBC [72 μm2 (48)], one can further estimate that 1.25 μM lysenin* covered ∼35% of the total area occupied by the submicrometric SM domains, which leaves room for additional labeling. Accordingly, increasing lysenin* concentration or presenting BODIPY-SM:BSA allowed further tracer insertion. In contrast, at saturating lysenin* concentration (∼5 μM), similar calculations indicate full SM occupancy by lysenin*, preventing subsequent BODIPY-SM incorporation.
The diameter of individual submicrometric domains we evidenced here by confocal microscopy in unfixed, partially spread, featureless RBCs using BODIPY-SM and lysenin* is ∼500 nm (range: 350–950 nm at 1.25 μM, 96 domains), close to the resolution limit of the method. More precise values have been recently provided by PALM, high-resolution ion mass spectrometry, or electron microscopy, but cells were not featureless and were formaldehyde-fixed. PALM with Dronpa-NT-lysenin revealed SM domains of ∼250 nm in diameter on fixed HeLa cells (31), but of ∼500 nm on fixed LLC-PK1 cells (41). By electron microscopy, SM-rich domains labeled with lysenin on fixed Jurkat cells were ∼150 nm in diameter (38). High-resolution ion mass spectrometry based on 15N-SLs revealed domains of ∼200 nm in diameter in fixed fibroblasts, interestingly regulated by cholesterol and actin cytoskeleton (8). While it is unclear whether these different values result from alternative methods or cells, all previous researches, combined with this study, have concurred to establish the concept of rather stable submicrometric SM domains on eukaryotic cells, thus conceptually distinct from transient nanometric rafts. However, it cannot be excluded that the larger level of organization of submicrometric domains could result from raft coalescence.
Control of SM submicrometric domains by temperature, cholesterol, and membrane tension
As previously shown for BODIPY-SM domains (9–11), the abundance of endogenous SM domains peaked at 20°C and decreased upon cholesterol depletion, suggesting liquid-phase separation. This issue was already discussed for BODIPY-SM in (9). We will now focus on the role of cholesterol. The strong decrease of lysenin* domain abundance upon moderate cholesterol depletion, which was also found with 15N-SLs on fibroblasts (8), can be explained neither by a modification of SM level (unchanged as checked by thin layer chromatography; data not shown), nor by a decrease of lysenin* binding to SM (unchanged as shown by 125I-lysenin*), and pointed instead to a modification of SM lateral organization. Our approach did not allow us to distinguish whether moderate cholesterol depletion fragmented SM domains into smaller assemblies below the detection limit of conventional confocal microscopy or caused SM randomization over the plasma membrane. We can however conclude that cholesterol is a major stabilization factor for SM submicrometric domains. We suggest that cholesterol abundance and dynamic distribution along the plasma membrane must play a crucial role in the dynamic regulation of domain biogenesis (nucleation) and/or expansion (size), as for transient nanometric rafts.
A third regulator of submicrometric domain is membrane tension, known to be itself regulated by cholesterol (11, 49). In this study, membrane tension was manipulated in two ways: i) increase by stretching on coverslips up to an almost two-dimensional object; versus ii) decrease by gentle suspension on a gel, so as to better preserve their 3D ovoid shape. In full agreement with our previous observations based on exogenous BODIPY-SM insertion (11), endogenous SM labeling by lysenin* disclosed a decrease then disappearance of submicrometric domains on coverslips, from the loosely attached stage #1 to maximally stretched stage #3. Conversely, endogenous SM domains were most abundant on more relaxed RBCs suspended in 3D-gel. We confirm that endogenous SM domains were stable in time and space, as shown by FRAP, and were also restricted by strong membrane spectrin anchorage (data not shown). Biophysical studies are clearly required to measure the relation between elastic membrane tension and submicrometric domains. These could benefit from acute dissociation of 4.1R complexes (pharmacological) or genetic deficiency of ankyrin complexes in spherocytosis.
Relation with other polar lipids
We previously suggested the segregation of at least three different classes of domains, respectively enriched in GSLs, SM, and PC (10). However, red BODIPY-SM was not available, precluding colocalization experiments between SM and other lipid classes (PC, GM1, GlcCer), and the bulky red BODIPY may be more prone to artifacts. These two major limitations could now be circumvented by the combination of red lysenin*, validated above, with green BODIPY-lipids. We here found that lysenin* domains showed large coenrichment with green BODIPY-PC and -GSL (GM1 and GlcCer) domains on poorly stretched RBCs (stage #1), but large segregation upon increased stretching (stage #2). This observation suggests that the erythrocyte membrane is not organized in three different classes of submicrometric domains as previously suggested (10), but is rather composed of domains that can be spatially related, depending on intrinsic cohesiveness of individual lipids (melting temperature) and the extent of membrane stretching.
Biological relevance of SM submicrometric domains
Admittedly, most of the observations reported here have been obtained using RBCs spread onto poly-L-lysine coverslips, up to almost a flat two-dimensional rigid system which is far from the biconcave shape and plasticity of RBCs in the circulation and in particular during splenic filtration. However, imaging of living RBCs gently suspended in a 3D-gel, thus without artificial stretching, not only confirmed the existence of micrometric domains but revealed that their abundance is underestimated in the classical coverslip assay, even though this approach yielded essential results. If abundant submicrometric domains turn out to be the rule in circulating RBCs, and perhaps many other cell types, what could be their function? Two opposite roles may be considered. First, submicrometric lipid domains could promote lipid resilience necessary to membrane deformability by providing stretchable membrane reservoirs, by analogy to caveolae in endothelial cells (50). This function would be essential for RBC squeezing into the narrow pores of spleen sinusoids. Conversely, boundaries of submicrometric lipid domains might reflect high-tension fragility sites, i.e., propensity to fragmentation and hemolysis during splenic filtration of senescent or diseased RBCs. These opposite potential properties might even coexist, and one or the other might prevail, depending on the type of lipid domains and the intensity of stretching/deformation. Testing these hypotheses would also depend on biophysical studies, which could not only exploit, but also possibly explain and help in managing RBC membrane fragility diseases.
Supplementary Material
Acknowledgments
The authors thank Drs. A. Miyawaki, M. Abe, and T. Kobayashi at Riken Brain Science Institute (Saitama, Japan) for generously supplying the Dronpa-NT-lysenin plasmid and Dr. A. De Matteis (Naples, Italy) for mCherry-Rab5 plasmid, as well as N. Chevalier and J. Lorent (Université catholique de Louvain, Belgium) for technical support.
Footnotes
Abbreviations:
- DF
- defatted
- FRAP
- fluorescence recovery after photobleaching
- GlcCer
- glucosylceramide
- GSL
- glycosphingolipid
- lysenin*
- His-mCherry-nontoxic-lysenin
- mβCD
- methyl-β-cyclodextrin
- MLV
- multilamellar vesicle
- NT
- nontoxic
- PALM
- super-resolution microscopy
- PC
- phosphatidylcholine
- RBC
- red blood cell
- SL
- sphingolipid
- SN
- supernatant
- TMA-DPH
- 1-(4-trimethylammoniumphenyl)-6-phenyl-1,3,5-hexatriene p-toluenesulfonate
This work was supported by grants from Université catholique de Louvain (UCL) (FSR), the F.R.S-FNRS, the Salus Sanguinis Foundation, Actions de Recherche Concertées (ARC), InterUniversity Attraction Pole (IUAP), and the Région Wallonne.
The online version of this article (available at http://www.jlr.org) contains supplementary data in the form of seven figures.
REFERENCES
- 1.van Meer G., Voelker D. R., Feigenson G. W. 2008. Membrane lipids: where they are and how they behave. Nat. Rev. Mol. Cell Biol. 9: 112–124 [DOI] [PMC free article] [PubMed] [Google Scholar]
- 2.Singer S. J., Nicolson G. L. 1972. The fluid mosaic model of the structure of cell membranes. Science. 175: 720–731 [DOI] [PubMed] [Google Scholar]
- 3.Lingwood D., Simons K. 2010. Lipid rafts as a membrane-organizing principle. Science. 327: 46–50 [DOI] [PubMed] [Google Scholar]
- 4.Pike L. J. 2006. Rafts defined: a report on the Keystone Symposium on Lipid Rafts and Cell Function. J. Lipid Res. 47: 1597–1598 [DOI] [PubMed] [Google Scholar]
- 5.Kusumi A., Fujiwara T. K., Chadda R., Xie M., Tsunoyama T. A., Kalay Z., Kasai R. S., Suzuki K. G. 2012. Dynamic organizing principles of the plasma membrane that regulate signal transduction: commemorating the fortieth anniversary of Singer and Nicolson’s fluid-mosaic model. Annu. Rev. Cell Dev. Biol. 28: 215–250 [DOI] [PubMed] [Google Scholar]
- 6.Fujiwara T., Ritchie K., Murakoshi H., Jacobson K., Kusumi A. 2002. Phospholipids undergo hop diffusion in compartmentalized cell membrane. J. Cell Biol. 157: 1071–1081 [DOI] [PMC free article] [PubMed] [Google Scholar]
- 7.Frisz J. F., Klitzing H. A., Lou K., Hutcheon I. D., Weber P. K., Zimmerberg J., Kraft M. L. 2013. Sphingolipid domains in the plasma membranes of fibroblasts are not enriched with cholesterol. J. Biol. Chem. 288: 16855–16861 [DOI] [PMC free article] [PubMed] [Google Scholar]
- 8.Frisz J. F., Lou K., Klitzing H. A., Hanafin W. P., Lizunov V., Wilson R. L., Carpenter K. J., Kim R., Hutcheon I. D., Zimmerberg J., et al. 2013. Direct chemical evidence for sphingolipid domains in the plasma membranes of fibroblasts. Proc. Natl. Acad. Sci. USA. 110: E613–E622 [DOI] [PMC free article] [PubMed] [Google Scholar]
- 9.Tyteca D., D’Auria L., Van Der Smissen P., Medts T., Carpentier S., Monbaliu J. C., de Diesbach P., Courtoy P. J. 2010. Three unrelated sphingomyelin analogs spontaneously cluster into plasma membrane micrometric domains. Biochim. Biophys. Acta. 1798: 909–927 [DOI] [PubMed] [Google Scholar]
- 10.D’Auria L., Van Der Smissen P., Bruyneel F., Courtoy P. J., Tyteca D. 2011. Segregation of fluorescent membrane lipids into distinct micrometric domains: evidence for phase compartmentation of natural lipids? PLoS ONE. 6: e17021. [DOI] [PMC free article] [PubMed] [Google Scholar]
- 11.D’Auria L., Fenaux M., Aleksandrowicz P., Van Der Smissen P., Chantrain C., Vermylen C., Vikkula M., Courtoy P. J., Tyteca D. 2013. Micrometric segregation of fluorescent membrane lipids: relevance for endogenous lipids and biogenesis in erythrocytes. J. Lipid Res. 54: 1066–1076 [DOI] [PMC free article] [PubMed] [Google Scholar]
- 12.D’Auria L., Deleu M., Dufour S., Mingeot-Leclercq M. P., Tyteca D. 2013. Surfactins modulate the lateral organization of fluorescent membrane polar lipids: a new tool to study drug:membrane interaction and assessment of the role of cholesterol and drug acyl chain length. Biochim. Biophys. Acta. 1828: 2064–2073 [DOI] [PubMed] [Google Scholar]
- 13.Sanchez S. A., Tricerri M. A., Gratton E. 2012. Laurdan generalized polarization fluctuations measures membrane packing micro-heterogeneity in vivo. Proc. Natl. Acad. Sci. USA. 109: 7314–7319 [DOI] [PMC free article] [PubMed] [Google Scholar]
- 14.Plasencia I., Norlen L., Bagatolli L. A. 2007. Direct visualization of lipid domains in human skin stratum corneum’s lipid membranes: effect of pH and temperature. Biophys. J. 93: 3142–3155 [DOI] [PMC free article] [PubMed] [Google Scholar]
- 15.Bernardino de la Serna J., Perez-Gil J., Simonsen A. C., Bagatolli L. A. 2004. Cholesterol rules: direct observation of the coexistence of two fluid phases in native pulmonary surfactant membranes at physiological temperatures. J. Biol. Chem. 279: 40715–40722 [DOI] [PubMed] [Google Scholar]
- 16.Baumgart T., Hess S. T., Webb W. W. 2003. Imaging coexisting fluid domains in biomembrane models coupling curvature and line tension. Nature. 425: 821–824 [DOI] [PubMed] [Google Scholar]
- 17.Lingwood D., Ries J., Schwille P., Simons K. 2008. Plasma membranes are poised for activation of raft phase coalescence at physiological temperature. Proc. Natl. Acad. Sci. USA. 105: 10005–10010 [DOI] [PMC free article] [PubMed] [Google Scholar]
- 18.Bagatolli L. A., Ipsen J. H., Simonsen A. C., Mouritsen O. G. 2010. An outlook on organization of lipids in membranes: searching for a realistic connection with the organization of biological membranes. Prog. Lipid Res. 49: 378–389 [DOI] [PubMed] [Google Scholar]
- 19.Bagatolli L. A., Mouritsen O. G. 2013. Is the fluid mosaic (and the accompanying raft hypothesis) a suitable model to describe fundamental features of biological membranes? What may be missing? Front. Plant Sci. 4: 457. [DOI] [PMC free article] [PubMed] [Google Scholar]
- 20.Yechiel E., Edidin M. 1987. Micrometer-scale domains in fibroblast plasma membranes. J. Cell Biol. 105: 755–760 [DOI] [PMC free article] [PubMed] [Google Scholar]
- 21.Gousset K., Wolkers W. F., Tsvetkova N. M., Oliver A. E., Field C. L., Walker N. J., Crowe J. H., Tablin F. 2002. Evidence for a physiological role for membrane rafts in human platelets. J. Cell. Physiol. 190: 117–128 [DOI] [PubMed] [Google Scholar]
- 22.Gaus K., Gratton E., Kable E. P., Jones A. S., Gelissen I., Kritharides L., Jessup W. 2003. Visualizing lipid structure and raft domains in living cells with two-photon microscopy. Proc. Natl. Acad. Sci. USA. 100: 15554–15559 [DOI] [PMC free article] [PubMed] [Google Scholar]
- 23.Singh R. D., Liu Y., Wheatley C. L., Holicky E. L., Makino A., Marks D. L., Kobayashi T., Subramaniam G., Bittman R., Pagano R. E. 2006. Caveolar endocytosis and microdomain association of a glycosphingolipid analog is dependent on its sphingosine stereochemistry. J. Biol. Chem. 281: 30660–30668 [DOI] [PubMed] [Google Scholar]
- 24.Spira F., Mueller N. S., Beck G., von Olshausen P., Beig J., Wedlich-Soldner R. 2012. Patchwork organization of the yeast plasma membrane into numerous coexisting domains. Nat. Cell Biol. 14: 640–648 [DOI] [PubMed] [Google Scholar]
- 25.Malínská K., Malínský J., Opekarová M., Tanner W. 2003. Visualization of protein compartmentation within the plasma membrane of living yeast cells. Mol. Biol. Cell. 14: 4427–4436 [DOI] [PMC free article] [PubMed] [Google Scholar]
- 26.Cornwell D. G., Heikkila R. E., Bar R. S., Biagi G. L. 1968. Red blood cell lipids and the plasma membrane. J. Am. Oil Chem. Soc. 45: 297–304 [DOI] [PubMed] [Google Scholar]
- 27.de Gier, Van Deenen L.1961. Some lipid characteristics of red cell membranes of various animal species. Biochim. Biophys. Acta. 49: 286–296.
- 28.Bakrac B., Gutierrez-Aguirre I., Podlesek Z., Sonnen A. F., Gilbert R. J., Macek P., Lakey J. H., Anderluh G. 2008. Molecular determinants of sphingomyelin specificity of a eukaryotic pore-forming toxin. J. Biol. Chem. 283: 18665–18677 [DOI] [PubMed] [Google Scholar]
- 29.Ishitsuka R., Kobayashi T. 2004. Lysenin: a new tool for investigating membrane lipid organization. Anat. Sci. Int. 79: 184–190 [DOI] [PubMed] [Google Scholar]
- 30.Ishitsuka R., Yamaji-Hasegawa A., Makino A., Hirabayashi Y., Kobayashi T. 2004. A lipid-specific toxin reveals heterogeneity of sphingomyelin-containing membranes. Biophys. J. 86: 296–307 [DOI] [PMC free article] [PubMed] [Google Scholar]
- 31.Mizuno H., Abe M., Dedecker P., Makino A., Rocha S., Ohno-Iwashita Y., Hofkens J., Kobayashi T., Miyawaki A. 2011. Fluorescent probes for superresolution imaging of lipid domains on the plasma membrane. Chem Sci. 2: 1548–1553 [Google Scholar]
- 32.Ziomek C. A., Schulman S., Edidin M. 1980. Redistribution of membrane proteins in isolated mouse intestinal epithelial cells. J. Cell Biol. 86: 849–857 [DOI] [PMC free article] [PubMed] [Google Scholar]
- 33.Maliekal P., Vertommen D., Delpierre G., Van Schaftingen E. 2006. Identification of the sequence encoding N-acetylneuraminate-9-phosphate phosphatase. Glycobiology. 16: 165–172 [DOI] [PubMed] [Google Scholar]
- 34.Veiga-da-Cunha M., Hadi F., Balligand T., Stroobant V., Van Schaftingen E. 2012. Molecular identification of hydroxylysine kinase and of ammoniophospholyases acting on 5-phosphohydroxy-L-lysine and phosphoethanolamine. J. Biol. Chem. 287: 7246–7255 [DOI] [PMC free article] [PubMed] [Google Scholar]
- 35.Bensikaddour H., Snoussi K., Lins L., Van Bambeke F., Tulkens P. M., Brasseur R., Goormaghtigh E., Mingeot-Leclercq M. P. 2008. Interactions of ciprofloxacin with DPPC and DPPG: fluorescence anisotropy, ATR-FTIR and 31P NMR spectroscopies and conformational analysis. Biochim. Biophys. Acta. 1778: 2535–2543 [DOI] [PubMed] [Google Scholar]
- 36.Cheng Z. J., Singh R. D., Sharma D. K., Holicky E. L., Hanada K., Marks D. L., Pagano R. E. 2006. Distinct mechanisms of clathrin-independent endocytosis have unique sphingolipid requirements. Mol. Biol. Cell. 17: 3197–3210 [DOI] [PMC free article] [PubMed] [Google Scholar]
- 37.Marsh J. B., Weinstein D. B. 1966. Simple charring method for determination of lipids. J. Lipid Res. 7: 574–576 [PubMed] [Google Scholar]
- 38.Kiyokawa E., Baba T., Otsuka N., Makino A., Ohno S., Kobayashi T. 2005. Spatial and functional heterogeneity of sphingolipid-rich membrane domains. J. Biol. Chem. 280: 24072–24084 [DOI] [PubMed] [Google Scholar]
- 39.Salomao M., Zhang X., Yang Y., Lee S., Hartwig J. H., Chasis J. A., Mohandas N., An X. 2008. Protein 4.1R-dependent multiprotein complex: new insights into the structural organization of the red blood cell membrane. Proc. Natl. Acad. Sci. USA. 105: 8026–8031 [DOI] [PMC free article] [PubMed] [Google Scholar]
- 40.Illinger D., Poindron P., Fonteneau P., Modollel M., Kuhry J. G. 1990. Internalization of the lipophilic fluorescent probe trimethylamino-diphenylhexatriene follows the endocytosis and recycling of the plasma membrane in cells. Biochim. Biophys. Acta. 1030: 73–81 [DOI] [PubMed] [Google Scholar]
- 41.Abe M., Makino A., Hullin-Matsuda F., Kamijo K., Ohno-Iwashita Y., Hanada K., Mizuno H., Miyawaki A., Kobayashi T. 2012. A role for sphingomyelin-rich lipid domains in the accumulation of phosphatidylinositol-4,5-bisphosphate to the cleavage furrow during cytokinesis. Mol. Cell. Biol. 32: 1396–1407 [DOI] [PMC free article] [PubMed] [Google Scholar]
- 42.Zachowski A. 1993. Phospholipids in animal eukaryotic membranes: transverse asymmetry and movement. Biochem. J. 294: 1–14 [DOI] [PMC free article] [PubMed] [Google Scholar]
- 43.Goodman S. R., Kurdia A., Ammann L., Kakhniashvili D., Daescu O. 2007. The human red blood cell proteome and interactome. Exp. Biol. Med. (Maywood). 232: 1391–1408 [DOI] [PubMed] [Google Scholar]
- 44.Yamaji A., Sekizawa Y., Emoto K., Sakuraba H., Inoue K., Kobayashi H., Umeda M. 1998. Lysenin, a novel sphingomyelin-specific binding protein. J. Biol. Chem. 273: 5300–5306 [DOI] [PubMed] [Google Scholar]
- 45.Skočaj M., Bakrač B., Križaj I., Maček P., Anderluh G., Sepčić K. 2013. The sensing of membrane microdomains based on pore-forming toxins. Curr. Med. Chem. 20: 491–501 [DOI] [PubMed] [Google Scholar]
- 46.McKanna J. A., Haigler H. T., Cohen S. 1979. Hormone receptor topology and dynamics: morphological analysis using ferritin-labeled epidermal growth factor. Proc. Natl. Acad. Sci. USA. 76: 5689–5693 [DOI] [PMC free article] [PubMed] [Google Scholar]
- 47.De Roe C., Courtoy P. J., Baudhuin P. 1987. A model of protein-colloidal gold interactions. J. Histochem. Cytochem. 35: 1191–1198 [DOI] [PubMed] [Google Scholar]
- 48.Westerman M. P., Pierce L. E., Jensen W. N. 1961. A direct method for the quantitative measurement of red cell dimensions. J. Lab. Clin. Med. 57: 819–824 [PubMed] [Google Scholar]
- 49.Sun M., Northup N., Marga F., Huber T., Byfield F. J., Levitan I., Forgacs G. 2007. The effect of cellular cholesterol on membrane-cytoskeleton adhesion. J. Cell Sci. 120: 2223–2231 [DOI] [PubMed] [Google Scholar]
- 50.Sinha B., Koster D., Ruez R., Gonnord P., Bastiani M., Abankwa D., Stan R. V., Butler-Browne G., Vedie B., Johannes L., et al. 2011. Cells respond to mechanical stress by rapid disassembly of caveolae. Cell. 144: 402–413 [DOI] [PMC free article] [PubMed] [Google Scholar]
Associated Data
This section collects any data citations, data availability statements, or supplementary materials included in this article.