Abstract
Ultrasmall (3, 4, 5, and 6 nm), water-soluble Fe3O4 magnetic nanoparticles were synthesized in diethylene glycol (DEG) via a facile one-pot reaction. Hydrodynamic size and relaxation time measurements did not show particle aggregation when Fe3O4 nanoparticles were dispersed in phosphate buffered saline, fetal bovine serum, or calf bovine serum for 1 week. Furthermore, the new Fe3O4 nanoparticles tolerated high salt concentrations (≤1 M NaCl) and a wide pH range from 5 to 11. Surface modification of the nanoparticles with poly(ethylene glycol) bis(carboxymethyl) ether (HOOC-PEG-COOH, 600 g/mol) was accomplished through a ligand-exchange reaction. The effects of PEG modification on magnetization and relaxivity of the Fe3O4 nanoparticles were investigated, and the results indicate that the increase in transverse relaxivity after PEG modification may be due to the increased volume of slowly diffusing water surrounding each nanoparticle. In vitro experiments showed that the DEG- and PEG-coated Fe3O4 nanoparticles have little effect on NIH/3T3 cell viability.
1. Introduction
Magnetic nanoparticles have shown great potential in biomedical applications such as magnetic separation, magnetic resonance imaging (MRI), targeted drug delivery, and hyperthermia treatment of cancer.1–11 In particular, magnetic nanoparticles are excellent MR contrast agents for noninvasive cellular and molecular imaging.4–9 Magnetic nanoparticles composed of Fe3O4 have been extensively investigated due to their excellent magnetic properties and biocompatibility.4–7 Recently, high-temperature decomposition strategies have been developed to produce monodisperse and highly crystalline Fe3O4 nanoparticles, but they are soluble only in nonpolar solvents.12,13 Consequently, their biological applications are limited without extensive surface modifications.14–16 To avoid sophisticated phase transfer processes, a modified thermal decomposition process for preparing water-soluble and biocompatible Fe3O4 nanoparticles via a one-pot reaction was developed.5,17,18
The polyol method is a versatile chemical approach for the synthesis of water dispersible nanoparticles with well-defined shapes and controlled sizes.19–22 Polyol can act as a solvent to dissolve inorganic compounds due to their high dielectric constants, and offers a wide operating-temperature range for preparing inorganic nanoparticles. It can act as a reducing agent, control particle growth, and prevent interparticle aggregation.23 Nanoparticles prepared through this process can be dispersed in aqueous media and other polar solvents since the surface of the nanoparticles is coated by hydrophilic polyol ligands in situ. In addition, the high reaction temperature favors nanoparticles with high crystallinity and monodispersity. A polyol process has been developed to produce 8 nm nonaggregated Fe3O4 nanoparticles.20 Most recently, an approach was developed to synthesize water-dispersible Fe3O4 nanoparticles by using FeCl3 as the iron source and diethylene glycol (DEG) as the reductantand solvent in the presence of CH3COONa.21 However, the poor colloidal stability of these nanoparticles at neutral pH makes them far from optimal for biomedical applications.
Enhancing in vivo targeting specificity is a great challenge encountered with iron oxide MR contrast agents. Commonly used iron oxide nanoparticle contrast agents generate local contrast through nonspecific uptake by mononuclear phagocytes, and with a hydrodynamic size of over 50 nm, these particles remain primarily intravascular and are taken up by the reticuloendothelial system (RES),24,25 which severely undermines their targeting specificity. Smaller hydrodynamic sizes are desired to overcome these problems.24,26 As shown in Table 1, despite recent synthetic progress, it remains challenging to prepare monodisperse ultrasmall magnetite nanoparticles with high relaxivity and good colloidal stability under physiological conditions via a one-pot reaction.5,19–21,27–30
TABLE 1.
Properties of Iron Oxide Nanoparticles Reported in Relative Literature and Our Work
| synthesis method | composition | size (nm) | colloidal stability | r2 (mM−1 s−1) | refs |
|---|---|---|---|---|---|
| thermal decomposition | Fe3O4 | 10.9 | H2O and PBS | – | 5 |
| polyol | Fe2O3 | 30–200 | diethylene glycol | – | 19 |
| polyol | Fe3O4 | 3–11 | H2O (pH ≤5 or pH ≥9) | – | 21 |
| polyol | Fe3O4 | 8 | H2O and PBS | 8 nm: 82.68 (1.5 T) | 20 |
| thermal decomposition | Fe3O4 | 4–12 | H2O and PBS (phase transfer needed) | 6 nm: 106 (1.5 T) | 27 |
| coprecipitation | 5 mol % Eu USMIO | 6.6 | H2O | 6.6 nm: 33.9 (0.47 T) | 28 |
| coprecipitation | MION | 4.6 | – | 4.6 nm: 34.8 | 29 |
| coprecipitation | USPIO | 4.9 | 0.9% normal saline | 4.9 nm: 53.1 (0.47 T) | 30 |
| polyol | Fe3O4 | 3–6 | H2O, PBS and serum (0–1 M NaCl, pH 5–11) | 5 nm: 86 6 nm: 119 (1.41 T) | our work |
Herein, we present a direct synthesis of monodisperse, water-soluble, 3–6 nm Fe3O4 magnetic nanoparticles in DEG via a one-pot reaction, as illustrated in Scheme S1 (Supporting Information). The Fe3O4 nanoparticles show good colloidal stability in phosphate buffered saline (PBS), fetal bovine serum (FBS), and calf bovine serum (CBS). Furthermore, the Fe3O4 nanoparticles are stable in up to 1 M NaCl solution and against various pH (5–11). Surface modification with poly(ethylene glycol) bis(carboxymethyl) ether (HOOC-PEG-COOH) was accomplished through a facile ligand-exchange reaction, resulting in up to 95% increase in transverse relaxivity (r2, at 1.41 T) that may be due to the increased volume of slowly diffusing water surrounding each nanoparticle. Cell viability assays showed that the DEG- and PEG-coated Fe3O4 nanoparticles have little effect on NIH/3T3 cell viability. Due to their monodispersity, colloidal stability and high r2, these Fe3O4 nanoparticles are promising candidates for a variety of MR imaging applications.
2. Experimental Section
Synthesis of Fe3O4 Nanoparticles
The synthesis of 3 nm Fe3O4 nanoparticles is as follows. Iron (III) acetylacetonate [Fe(acac)3, 1.2 mmol, 99.9+%, Aldrich] and diethylene glycol (DEG, 20 mL, 99%, Sigma-Aldrich) were mixed and purged with nitrogen. The reaction mixture was heated at 140 °C for 1 h followed by 2 h at 200 °C, producing a black, homogeneous, colloidal suspension. After cooling to room temperature, 100 mL ethanol/ether (v/v = 1:8) was added to the reaction solution and resulted in a black precipitation of magnetite nanoparticles that were separated by centrifugation. After washing with ethanol/ether three times, the precipitate was redispersed in water for further investigation. Fe3O4 nanoparticles (4 and 5 nm) were prepared by extending the reaction time at 200 °C to 3 and 6 h, respectively. For 6 nm Fe3O4 nanoparticles, 2.4 mmol Fe(acac)3 and 20 mL DEG were mixed followed by heating at 140 °C for 1 h and 200 °C for 8 h.
Surface Modification of Fe3O4 Nanoparticles with HOOC-PEG-COOH
Three milliliters of 6 nm (3, 4, or 5 nm) DEG-Fe3O4 aqueous solution (0.43 mg Fe/mL) was mixed with 84 mg poly(ethylene glycol) bis(carboxymethyl) ether (HOOC-PEG-COOH, Aldrich, 600 g/mol) in 27 mL of 10 mM phosphate buffer (PB) at pH 6.4 and ultrasonicated in Branson ultrasonication bath for 30 min. The reaction mixture was stirred at room temperature for 12 h. Excess HOOC-PEG-COOH molecules were removed by size filtration three times using Millipore Amicon Ultra 30 000 centrifugal filters. Purified PEG-Fe3O4 was redispersed in 10 mM PB.
Cell Culture
NIH/3T3 cells (ATCC, Manassas, VA) were grown in phenol red free DMEM (modified to contain 4.5 mg/L glucose, 2 mM l-glutamine, 1 mM sodium pyruvate, and nonessential amino acids) supplemented with 10% CBS. All cells were grown in a humidified incubator at 37 °C and 5% CO2. All flasks and multiwell plates were tissue culture treated and sterile. Prior to each experiment, NIH/3T3 cells were plated in 24-well tissue culture plates and allowed to grow to ~50% before addition of nanoparticle solutions.
Cell Viability Experiments
Six nanometer DEG-Fe3O4 or 6 nm PEG-Fe3O4 (in 10 mM PB) were diluted in the afore-mentioned cell culture media to specified iron concentrations and vortexed. NIH/3T3 cells were incubated with Fe3O4 nanoparticles at 37 °C and 5% CO2 for 24 h followed by two rinses with 0.50 mL of DPBS. Cells were detached using 0.25% trypsin/EDTA followed by addition of media (resulting in a 1:1 v/v trypsin-cell suspension/media solution) to neutralize the trypsin. Cells were then counted and percent cell viability determined using a Guava EasyCyte Mini personal cell analyzer (Guava Technologies, Hayward, CA). Specifically, 20 µL of cells were diluted 10-fold with Guava ViaCount reagent up to a total volume of 200 µL. Cells were allowed to stain at room temperature for 5–20 min. Samples were vortexed and analyzed using the Guava ViaCount software module (1000 trials per run).
Characterizations
TEM images and selected area electron diffraction patterns were obtained on a Hitachi H-8100 operated at an accelerating voltage of 200 kV. HR-TEM images were obtained on a JEOL JEM-2100F FAST TEM operated at an accelerating voltage of 200 kV. Samples for TEM and HRTEM analysis were prepared by spreading a drop of the solution sample on copper grids coated with a carbon film followed by evaporation under ambient conditions. XRD measurement was performed on a powder sample of the Fe3O4 nanoparticles using a Scintag XDS2000 goniometer. DLS measurements were performed with a Malvern Instruments Zetasizer Nano Series Nano-ZS with Dispersion Technology Software 5.03 (Worcestershire, U.K.). FTIR spectra were obtained on a Thermo Nicolet NEXUS 870 Fourier transform spectrometer (Thermo Scientific, Waltham, MA). Magnetic susceptibility measurements were carried using a Quantum Design MPMS5 SQUID magnetometer (San Diego, CA). MR phantom images were collected at two field strengths, 14.1 and 3 T. 14.1 T images were acquired on a General Electric/Bruker Omega 600WB 14.1 T imaging spectrometer at ambient temperature (~25 °C). A T2-weighted image was acquired using a multislice multi echo pulse sequence (TR = 4294.3 ms, TE = 101.8 ms, 16 echoes). Images were acquired with field of view (FOV) = 2 × 2 cm2, data matrix = 256 × 256, slice thickness = 1 mm, and four signal averages. T2 was measured with a static TR (1169.9 ms) and variable TE (10.2, 20.4, 30.5, 40.7, 50.9, 61.1, 71.3, 81.4, 91.6, 101.8, 112, 122.2 ms) values. Three T images were acquired on a Siemens TIM Trio clinical imaging system using a 35 mm diameter volume RF coil. A T2 weighted image was acquired using a spin echo pulse sequence (TR = 1500 ms, TE = 75 ms). Sequence parameters were as follows. FOV = 7.5 × 10 cm2, data matrix = 96 × 128, slice thickness = 2 mm, and three signal averages. Transverse and longitudinal relaxation times were also measured at 1.41 T (60 MHz) and 37 °C on a Bruker mq60 NMR analyzer equipped with the Minispec V2.51 Rev.00/NT software (Billerica, MA). An inversion–recovery pulse sequence was used to measure the longitudinal relaxation times, while both Carr–Purcell–Meiboom–Gill (CPMG) and spin–echo pulse sequences were used to measure transverse relaxation times. Iron concentrations of each sample for SQUID, relaxivity and MRI were determined via inductively coupled plasma atomic emission spectroscopy (ICP-AES, Varian).
3. Results and Discussion
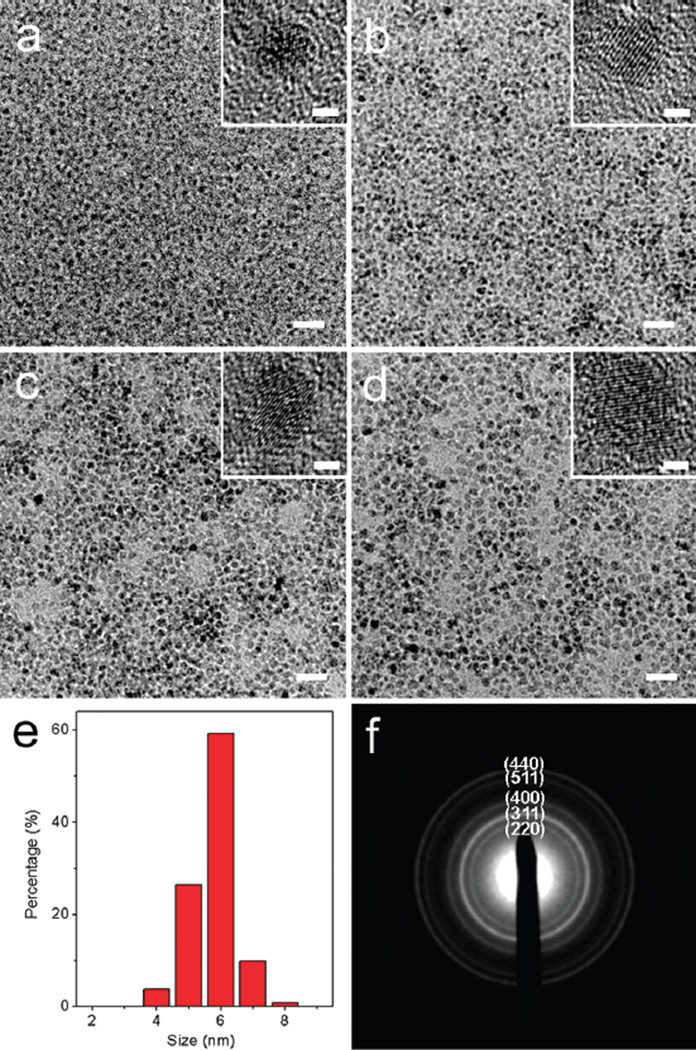
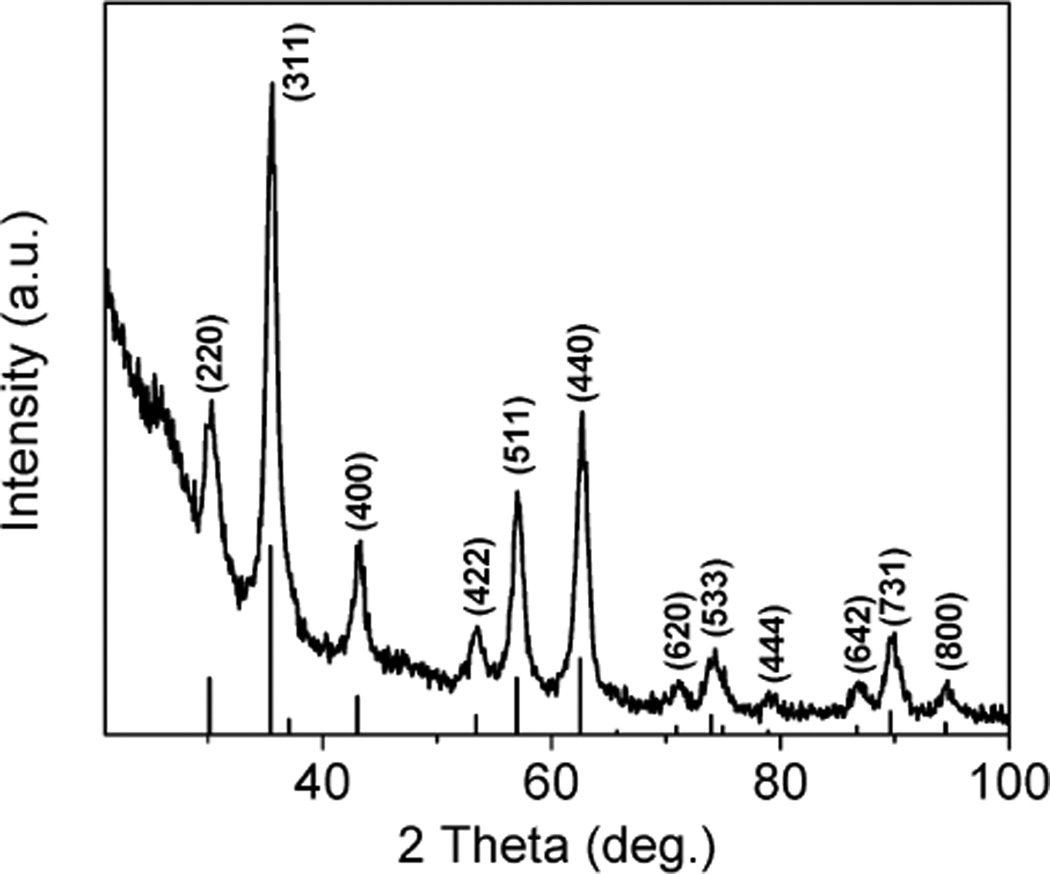
A polyol process was designed to synthesize ultrasmall, watersoluble Fe3O4 magnetic nanoparticles by using Fe(acac)3 as the iron precursor and DEG as the solvent, reducing agent, and stabilizer. Under the reductive atmosphere provided by DEG at higher temperature,31,32 Fe(III) is partially reduced to Fe(II), and Fe3O4 nanoparticles are formed. Typically, 6 ± 0.6 nm Fe3O4 nanoparticles were prepared by heating a mixture of 2.4 mmol Fe(acac)3 and 20 mL DEG at 140 °C for 1 h followed by 8 h at 200 °C. Fe3O4 nanoparticles (3, 4, and 5 nm) were obtained using a lower concentration of Fe(acac)3 and shorter reaction times at 200 °C. Figure 1a–d shows representative TEM and HR-TEM images of 3, 4, 5, and 6 nm Fe3O4 nanoparticles. The low-magnification TEM image of 6 nm Fe3O4 nanoparticles (Figure S1, Supporting Information) clearly shows their good monodispersity and high dispersity. The histogram of particle size based on statistical results of 6 nm Fe3O4 nanoparticles is shown in Figure 1e. Ten percent relative standard deviation demonstrates the high monodispersity of the Fe3O4 nanoparticles prepared by this procedure. Selected area electron diffraction reveals that the nanoparticles are of high crystallinity (Figure 1f). The lattice spacings (calculated on the basis of the diffraction patterns) are in agreement with those of bulk magnetite (JCPDS 19-0629). The crystal structure was further determined by powder X-ray diffraction (XRD). As shown in Figure 2, the position and relative intensity of all diffraction peaks of 6 nm Fe3O4 nanoparticles match well with those from the JCPDS card (19-0629) for magnetite. The average particle size calculated using Debye–Scherrer’s formula is 6.1 nm, which is quite close to the TEM results.
Figure 1.
TEM (inset is HR-TEM) images of (a) 3, (b) 4, (c) 5, and (d) 6 nm Fe3O4 nanoparticles; (e) histogram and (f) electron diffraction patterns of 6 nm Fe3O4 nanoparticles. The scale bars are 20 nm in TEM images and 2 nm in HR-TEM images.
Figure 2.
Powder X-ray diffractogram of 6 nm Fe3O4 nanoparticles. All peaks are well matched to the JCPDS card (19-0629) data for magnetite (bars).
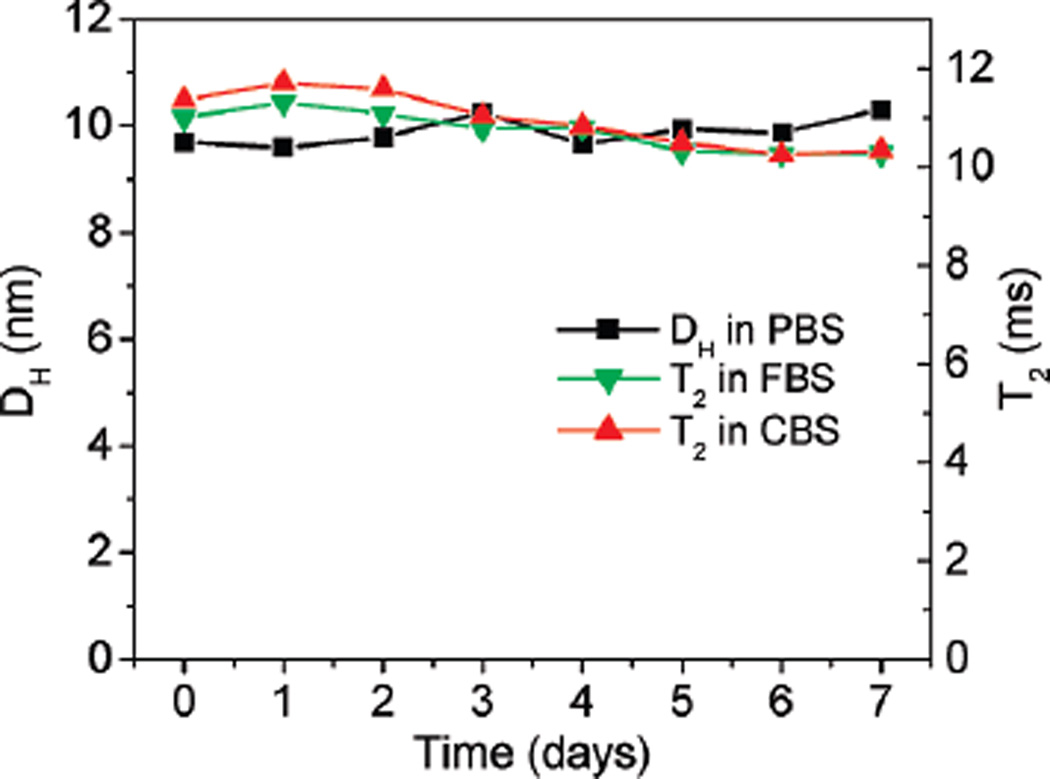
Colloidal stability under physiological conditions is one of the most important issues relating to the biological applications of nanomaterials. The Fe3O4 nanoparticles synthesized by this procedure can be readily and stably dispersed in aqueous media, including PBS, FBS, and CBS, without further surface modification. The colloidal stability of the Fe3O4 nanoparticles in PBS was investigated by measuring their hydrodynamic size (DH) for 1 week. As shown in Figure 3, the DH of 6 nm Fe3O4 nanoparticles was stable during the 1 week measurement period representing excellent particle stability. Since the presence of serum will affect the DH of the Fe3O4 nanoparticles, the colloidal stability of the Fe3O4 nanoparticles in FBS and CBS was investigated by measuring the transverse relaxation times (T2) over a period of 1 week. Figure 3 shows the temporal evolution of T2 of 6 nm Fe3O4 nanoparticles in FBS and CBS. The T2 of the Fe3O4 nanoparticles changed only slightly after 1 week, demonstrating good colloidal stability in FBS and CBS. To investigate the effects of pH and ionic strength on colloidal stability, Fe3O4 nanoparticles were exposed to 0–1 M NaCl and pH 3–11 solutions, as shown in Figure S2 (Supporting Information). The Fe3O4 nanoparticles were stable with salt concentrations as high as 1 M NaCl and tolerated a wide pH range from 5 to 11.
Figure 3.
Temporal evolution of hydrodynamic size of 6 nm Fe3O4 nanoparticles in PBS and T2 of 6 nm Fe3O4 nanoparticles in FBS and CBS.
Surface modification of Fe3O4 nanoparticles is necessary to realize their biocompatibility and surface functionality.2,4,7,15,26 The relatively weak coordinating ability of DEG molecules makes it possible to modify the nanoparticle surface through a ligand-exchange reaction. Previous studies have shown that carboxylate groups provide excellent ligation for Fe3O4 nanoparticles.12 In addition, PEG is a widely used biocompatible material for modifying magnetic nanoparticles due to its nontoxic, nonimmunogenic, and nonantigenic characteristics.4,5,16,18 Therefore, commercially available HOOC-PEG-COOH (600 g/mol) was chosen to modify the Fe3O4 nanoparticle surface. Typically, a mixture of DEG-Fe3O4 and HOOC-PEG-COOH molecules in 10 mM phosphate buffer at pH 6.4 was ultrasonicated in Branson ultrasonication bath for 30 min and stirred for 12 h under room temperature. Extensive size filtration by centrifugation was used to remove excess HOOC-PEG-COOH molecules.
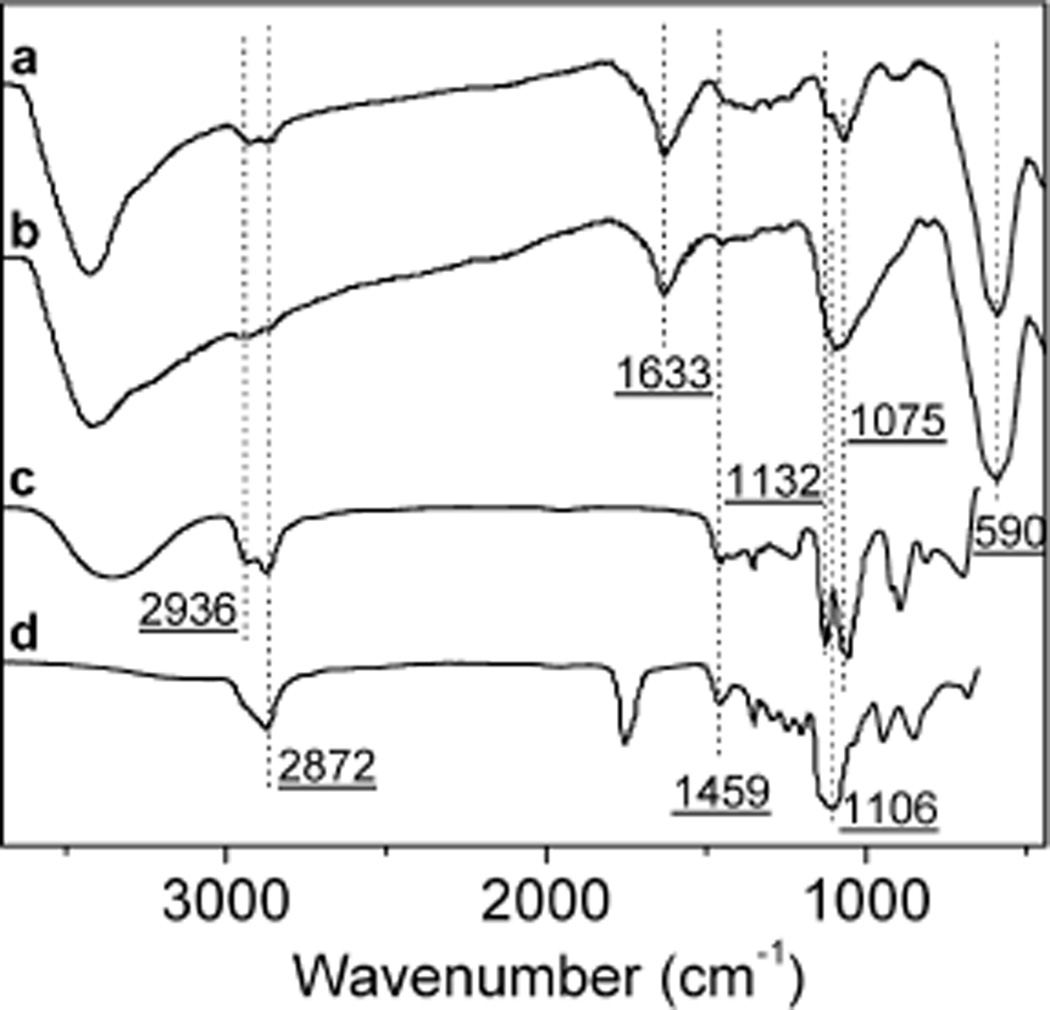
The surface chemical structure of both DEG-Fe3O4 and PEG-Fe3O4 was characterized by Fourier-transform infrared (FTIR) spectroscopy. Figure 4 shows the spectra of DEG-Fe3O4, PEG-Fe3O4, DEG, and HOOC-PEG-COOH. The characteristic bands of DEG at 2936 (CH2 asymmetric stretch), 2872 (CH2 symmetric stretch), 1459 (CH2 scissor), 1132 (C–O–C asymmetric stretch), and 1075 cm−1 (C–O–C symmetric stretch) appear in the spectrum of DEG-Fe3O4, indicating DEG is present on the Fe3O4 nanocrystal surface.33,34 The band at 1633 cm−1 has been shown in tri(ethylene glycol)-coated Fe3O4 nanoparticles20 and might be ascribed to the byproducts produced in the reaction system under high temperature.21 After PEG modification, the C–O–C stretching band coalesced into one peak at 1106 cm−1, instead of two peaks at 1132 and 1075 cm−1 in DEG-Fe3O4, which matches well with the spectrum of HOOC-PEG-COOH. This spectral change indicates that HOOC-PEG-COOH molecules have been modified to the Fe3O4 nanoparticle surface. In addition, IR spectra of DEG-Fe3O4 and PEG-Fe3O4 exhibit characteristic peaks centered at 590 cm−1 that are attributed to lattice absorption of the magnetite.27,35–37
Figure 4.
FTIR spectra of (a) 6 nm DEG-Fe3O4 and (b) 6 nm PEG-Fe3O4. Spectra c and d were recorded from the parent (c) DEG and HOOC-PEG-COOH (600 g/mol).
The presence of PEG on the nanoparticle surface was further confirmed by DLS. The DH of 6 nm Fe3O4 nanoparticles increased from 10 to 20 nm following PEG modification. The DH of 10 nm for 6 nm DEG-Fe3O4 is slightly larger than the superposition of 6 nm core and ~1.5 nm DEG coating since counterions and water form a diffuse layer which moves with the Fe3O4 nanoparticles.38 This result reveals no particle aggregation in aqueous solutions. Similarly, the DH of 6 nm PEG-Fe3O4 is 20 nm, slightly larger than the simple superposition of 6 nm core and ~10 nm PEG coating, indicating that some of the HOOC-PEG-COOH molecules on the Fe3O4 nanoparticle surface are coordinated with Fe3O4 nanoparticles with only one carboxyl group, and therefore, another carboxyl group can be used for conjugation with dyes or biomolecules. Similarly, PEG modification of 3, 4, and 5 nm Fe3O4 nanoparticles resulted in an increase in DH: from 8 to 16, 9 to 17, and 9 to 19 nm, respectively.
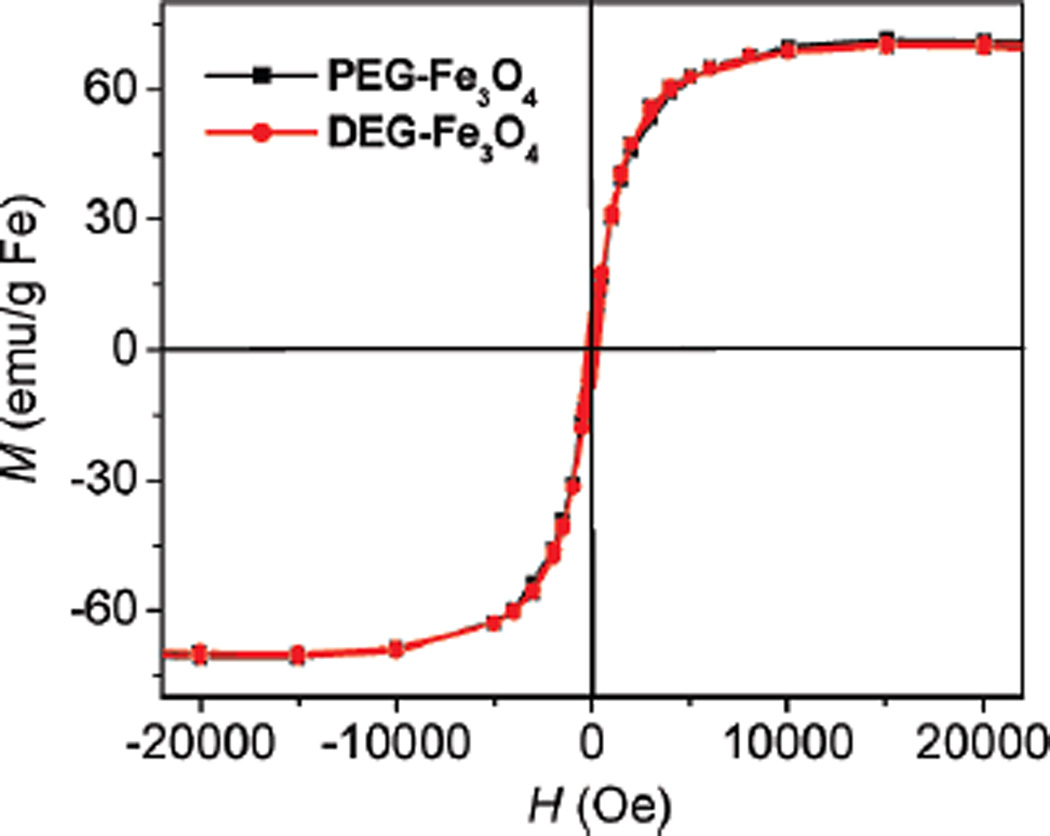
Magnetic properties of these Fe3O4 nanoparticles were measured using a superconducting quantum interference device (SQUID). Magnetization vs applied magnetic field was measured at 250 K for each sample. As shown in Figure 5, both DEG-Fe3O4 and PEG-Fe3O4 exhibit superparamagnetic behavior without magnetic hysteresis and remanence. There are no differences in magnetization between DEG-Fe3O4 and PEG-Fe3O4PEG-Fe3O4, demonstrating that the Fe3O4 core is intact during the surface modification with HOOC-PEG-COOH. The saturation magnetizations of 6 nm DEG-Fe3O4 and 6 nm PEG-Fe3O4 are 71 emu/g Fe.
Figure 5.
Magnetization (M) loops for 6 nm DEG-Fe3O4 and 6 nm PEG-Fe3O4 measured at 250 K.
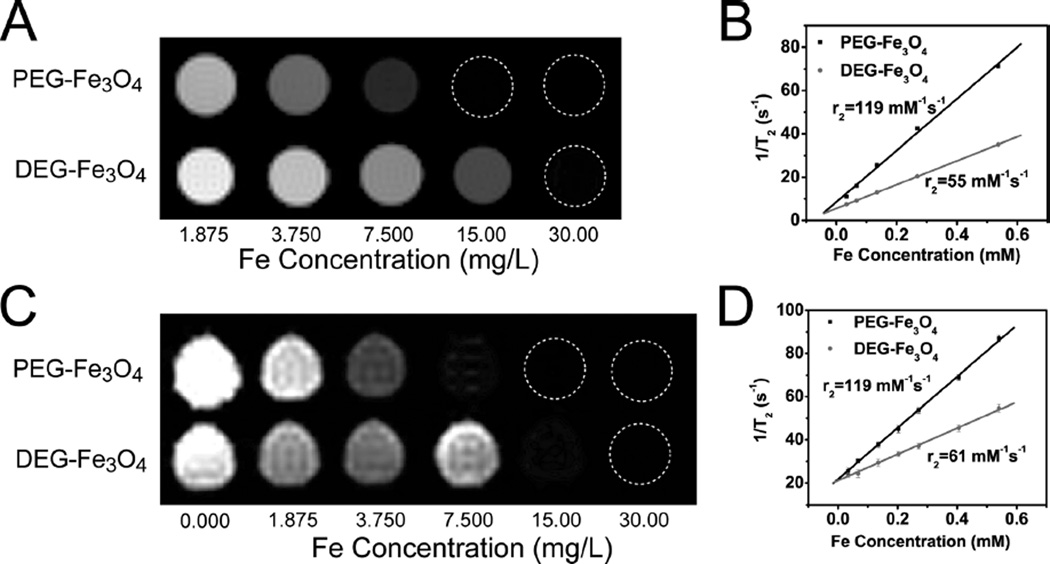
MR contrast agents are evaluated on the basis of their relaxivity or the change in the relaxation rates of water protons in the presence of the agent per unit concentration. MR contrast agents with higher relaxivities can be detected at lower concentrations, improving sensitivity. Figure 6A shows a T2-weighted MR image of 6 nm DEG-Fe3O4 and 6 nm PEG-Fe3O4 at different Fe concentrations (14.1 T, 25 °C). Increasing the concentration of DEG-Fe3O4 or PEG-Fe3O4 led to a large change in signal intensity in the T2-weighted MR image. PEG-Fe3O4 shows a much higher transverse relaxation rate than DEG-Fe3O4. The r2 of the Fe3O4 nanoparticles was determined by calculating the slope of a plot of 1/T2 versus Fe concentration. Figure 6B displays the r2s of 6 nm DEG-Fe3O4 and 6 nm PEG-Fe3O4 (14.1 T, 25 °C). PEG-Fe3O4 has a 116% larger r2 (119 mM−1 s−1) than DEG-Fe3O4 (55 mM−1 s−1), as indicated by the steeper slope in Figure 6B. The MR signal enhancement properties of these Fe3O4 nanoparticles at clinical field strength (3 and 1.41 T) were further investigated. As shown in Figure 6C, a T2-weighted image at 3 T (25 °C) shows the same trend. T2s of 6 nm DEG-Fe3O4 and 6 nm PEG-Fe3O4 at different Fe concentrations were measured on a 1.41 T (60 MHz) relaxometer at 37 °C. As shown in Figure 6D, the r2 of 6 nm DEG-Fe3O4 and 6 nm PEG-Fe3O4 are 61 and 119 mM−1 s−1, respectively. Therefore, the r2 of 6 nm Fe3O4 nanoparticles increases 95% after PEG modification. These relaxivity results are comparable to those measured at 14.1 T (25 °C). It is worth noting that the r2 (119 mM−1 s−1, 1.41 T) of 6 nm PEG-Fe3O4 is higher than 8 nm tri(ethylene glycol)-coated Fe3O4 nanoparticles (82.68 mM−1 s−1, 1.5 T) even though the relaxivity of Fe3O4 nanoparticles decreases accompanying with the decrease of Fe3O4 core size (Table 1).4,20 Similarly, PEG modification of 3, 4, and 5 nm Fe3O4 nanoparticles resulted in r2 increases from 29 to 47, 42 to 69, and 48 to 86 mM−1 s−1, respectively (Supporting Information, Figures S3–5). Compared to a 95% r2 increase, longitudinal relaxivity (r1) weakly decreased (≤20%) after PEG modification. Therefore, r2/r1, an important parameter to estimate the efficiency of T2 contrast agents, increased significantly (≥80%) after PEG modification (Supporting Information, Table S1).
Figure 6.
(A–B) High field strength MRI analysis: (A) T2-weighted MR image of aqueous solutions of 6 nm PEG-Fe3O4 and 6 nm DEG-Fe3O4 at different Fe concentrations at 25 °C and 14.1 T; (B) T2 relaxation rates (1/T2) of 6 nm PEG-Fe3O4 and 6 nm DEG-Fe3O4 at different Fe concentrations, measured at 25 °C and 14.1 T. (C–D) Clinical field strength MRI analysis: (C) T2-weighted MR image of aqueous solutions of 6 nm PEG-Fe3O4 and 6 nm DEG-Fe3O4 at different Fe concentrations, measured at 25 °C and 3.0 T; (D) T2 relaxation rates of 6 nm PEG-Fe3O4 and 6 nm DEG-Fe3O4 at different Fe concentrations, measured at 37 °C and 1.41 T.
The basis of the T2 MR contrast effect is that a magnetic dipole moment is induced in superparamagnetic nanoparticles under an applied magnetic field. When water molecules diffuse into the periphery (outer-sphere) of the induced dipole moment, the magnetic relaxation processes of the water protons are perturbed and the spin–spin relaxation time (T2) is shortened.4 This results in a signal decrease relative to other water protons, and appears as a dark region on a T2-weighted MR image. The effects of particle size and composition on relaxivity have been extensively investigated.4 SQUID results showed that there are no differences in magnetization between DEG-Fe3O4 and PEG-Fe3O4; therefore, the r2 increase after PEG modification is probably induced by the surface modification. The effects of surfactants on relaxivity are not well understood.23,38–40 The effect of the nanoparticle magnetic moment on water is stronger within the coating layer because of its closer proximity to the Fe3O4 core than the surrounding bulk water. It has been demonstrated that the diffusion coefficient of water within a PEG coating is slower than in bulk water.41
On the basis of this finding, computational simulation results showed that as the thickness of the PEG coating is increased, r2 increases due to the increased volume of slowly diffusing water surrounding each nanoparticle.38 PEG-Fe3O4 forms a larger hydrophilic layer than DEG-Fe3O4, as has been shown by DLS. As a result of the larger hydrophilic layer, the r2 of the PEG-Fe3O4 is much higher than that of DEG-Fe3O4, which fits well with the simulation results.
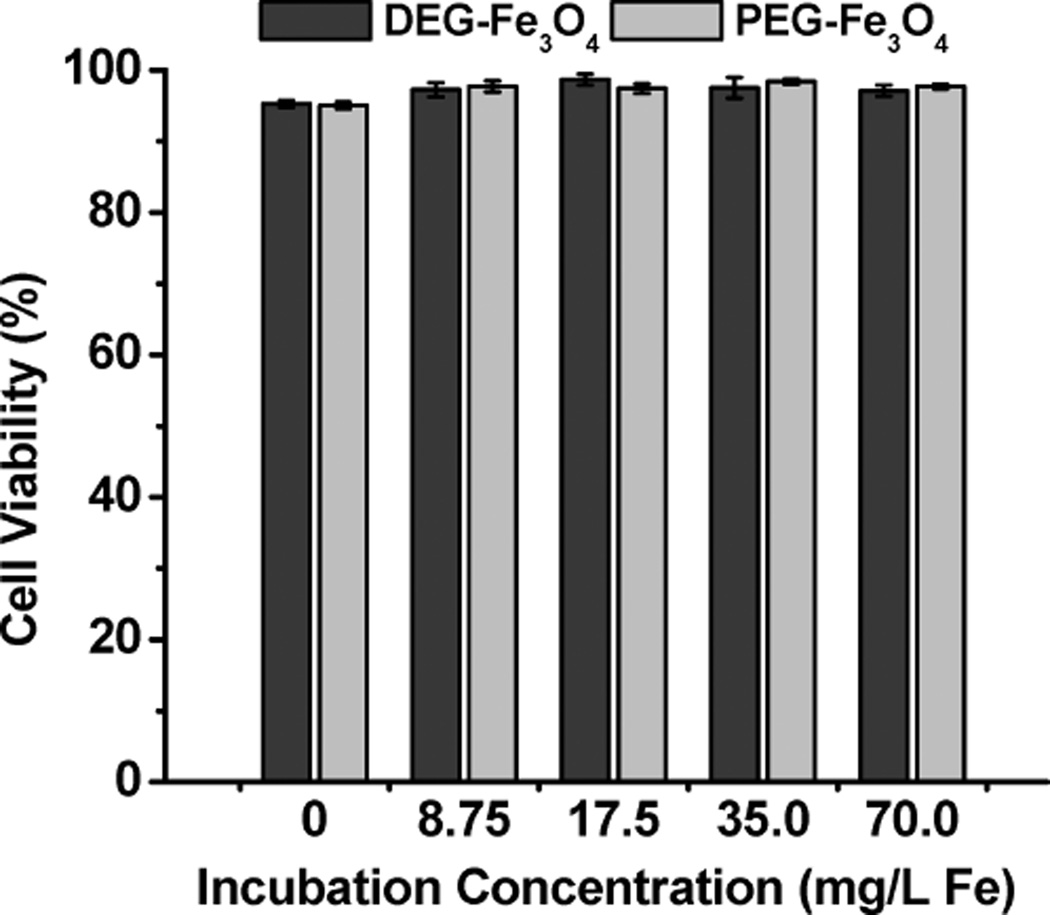
Due to their monodispersity, excellent colloidal stability and high r2, DEG-Fe3O4 and PEG-Fe3O4 are promising candidates for a variety of MR imaging applications. Initial experiments were conducted to determine the effects of these nanoparticles on NIH/3T3 cell viability. Specifically, cells were incubated with 8.75, 17.5, 35.0, or 70.0 mg Fe L−1 of 6 nm DEG-Fe3O4 or 6 nm PEG-Fe3O4 (6 nm nanoparticles were chosen due to their higher r2 values) for 24 h. After nanoparticle incubation, cells were washed twice with DPBS and detached using trypsin. A fraction of the cell suspension was used for cell counting and viability analysis via flow cytometry. NIH/3T3 cell viability was >95% after 24 h incubation with 6 nm DEG-Fe3O4 or 6 nm PEG-Fe3O4 (Figure 7), demonstrating that these Fe3O4 nanoparticles have little effect on NIH/3T3 cell viability. Further experiments using other cell lines and more sensitive molecular approaches to assess toxicity and labeling efficiency are under investigation.
Figure 7.
Cell viability of NIH/3T3 cells after 24 h incubation with 6 nm DEG-Fe3O4 or 6 nm PEG-Fe3O4 at various Fe incubation concentrations.
4. Conclusions
In conclusion, monodisperse, ultrasmall, water-soluble Fe3O4 nanoparticles of varying size were synthesized in DEG via a one-pot reaction. The Fe3O4 nanoparticles show excellent colloidal stability in PBS, FBS, and CBS. Furthermore, the Fe3O4 nanoparticles tolerated high salt concentrations (≤1 M NaCl) and a wide pH range from 5 to 11. PEG modification on the surface of Fe3O4 nanoparticles via a ligand-exchange reaction provided a facile surface modification method for DEG-stabilized nanoparticles and results in up to 95% increase in r2. DLS, SQUID, and relaxivity results indicate that the r2 increase might be due to the increased volume of slowly diffusing water surrounding each nanoparticle. In vitro experiments showed that the DEG- and PEG-coated Fe3O4 nanoparticles have little effect on NIH/3T3 cell viability, indicating that the Fe3O4 nanoparticles have potential as high-performance MR contrast agents for in vitro and in vivo MR imaging experiments.
Supplementary Material
Acknowledgment
We thank Prof. Vinayak P. Dravid and Dr. George H. Chan for helpful discussions. This work was supported by the National Cancer Institute Center for Cancer Nanotechnology Excellence initiative at Northwestern University Award No. U54CA119341 and the National Institute of Biomedical Imaging and Bioengineering Award No. 1R01 EB005866-01. We acknowledge NUANCE and IMSERC at Northwestern University, and the Center for Advanced Magnetic Resonance Imaging at Northwestern University’s Feinberg School of Medicine for use of their instrumentation.
Footnotes
Supporting Information Available: Scheme of synthesis and surface modification of the Fe3O4 nanoparticles, low-magnification TEM image of 6 nm Fe3O4 nanoparticles, colloidal stability tests in NaCl solutions and in several pH, T2 relaxation rates (1/T2) plotted against the Fe concentrations for DEG-Fe3O4 and PEG-Fe3O4 (3, 4, and 5 nm) at 1.41 T and 37 °C and table of DH, r2, r1, and r2/r1 at 1.41 T and 37 °C of DEG-Fe3O4 and PEG-Fe3O4. This material is available free of charge via the Internet at http://pubs.acs.org.
References and Notes
- 1.Jeong U, Teng X, Wang Y, Yang H, Xia Y. Adv. Mater. 2007;19:33. [Google Scholar]
- 2.Gu H, Xu K, Xu C, Xu B. Chem. Commun. 2006:941. doi: 10.1039/b514130c. [DOI] [PubMed] [Google Scholar]
- 3.(a) Aslam M, Schultz EA, Sun T, Meade T, Dravid VP. Cryst. Growth Des. 2007;7:471. doi: 10.1021/cg060656p. [DOI] [PMC free article] [PubMed] [Google Scholar]; (b) Hu F, MacRenaris KW, Waters EA, Schultz-Sikma EA, Eckermann AL, Meade TJ. Chem. Commun. 2009 doi: 10.1039/b916562b. [DOI] [PMC free article] [PubMed] [Google Scholar]
- 4.Jun Y, Lee J, Cheon J. Angew. Chem. Int. Ed. 2008;47:5122. doi: 10.1002/anie.200701674. [DOI] [PubMed] [Google Scholar]
- 5.Hu F, Wei L, Zhou Z, Ran Y, Li Z, Gao M. Adv. Mater. 2006;18:2553. [Google Scholar]
- 6.Weissleder R, Moore A, Mahmood U, Bhorade R, Benveniste H, Chiocca EA, Basilion JP. Nat. Med. 2000;6:351. doi: 10.1038/73219. [DOI] [PubMed] [Google Scholar]
- 7.Veiseh O, Sun C, Gunn J, Kohler N, Gabikian P, Lee D, Bhattarai N, Ellenbogen R, Sze R, Hallahan A, Olson J, Zhang M. Nano Lett. 2005;5:1003. doi: 10.1021/nl0502569. [DOI] [PubMed] [Google Scholar]
- 8.Nasongkla N, Bey E, Ren J, Ai H, Khemtong C, Guthi JS, Chin S, Sherry AD, Boothman DA, Gao J. Nano Lett. 2006;6:2427. doi: 10.1021/nl061412u. [DOI] [PubMed] [Google Scholar]
- 9.Bulte JWM, Kraitchman DL. NMR Biomed. 2004;17:484. doi: 10.1002/nbm.924. [DOI] [PubMed] [Google Scholar]
- 10.Johannsen M, Jordan A, Scholz R, Koch M, Lein M, Deger S, Roigas J, Jung K, Loening S. J. Endourol. 2004;18:495. doi: 10.1089/0892779041271715. [DOI] [PubMed] [Google Scholar]
- 11.Hilger I, Hergt R, Kaiser WA. IEE Proc.-Nanobiotechnol. 2005;152:33. doi: 10.1049/ip-nbt:20055018. [DOI] [PubMed] [Google Scholar]
- 12.Sun S, Zeng H, Robinson DB, Raoux S, Rice PM, Wang SX, Li GX. J. Am. Chem. Soc. 2004;126:273. doi: 10.1021/ja0380852. [DOI] [PubMed] [Google Scholar]
- 13.Jana NR, Chen Y, Peng X. Chem. Mater. 2004;16:3931. [Google Scholar]
- 14.Wu H, Zhu H, Zhuang J, Yang S, Liu C, Cao YC. Angew. Chem. Int. Ed. 2008;47:3730. doi: 10.1002/anie.200800434. [DOI] [PubMed] [Google Scholar]
- 15.Na HB, Lee IS, Seo H, Park YI, Lee JH, Kim S, Hyeon T. Chem. Commun. 2007:5167. doi: 10.1039/b712721a. [DOI] [PubMed] [Google Scholar]
- 16.Qin J, Laurent S, Jo YS, Roch A, Mikhaylova M, Bhujwalla ZM, Muller RN, Muhammed M. Adv. Mater. 2007;19:1874. [Google Scholar]
- 17.Li Z, Chen H, Bao H, Gao M. Chem. Mater. 2004;16:1391. [Google Scholar]
- 18.Li Z, Wei L, Gao M, Lei H. Adv. Mater. 2005;8:1001. [Google Scholar]
- 19.Feldmann C, Jungk H-O. Angew. Chem. Int. Ed. 2001;40:359. doi: 10.1002/1521-3773(20010119)40:2<359::AID-ANIE359>3.0.CO;2-B. [DOI] [PubMed] [Google Scholar]
- 20.Wan J, Cai W, Meng X, Liu E. Chem. Commun. 2007:5004. doi: 10.1039/b712795b. [DOI] [PubMed] [Google Scholar]
- 21.Jia X, Chen D, Jiao X, Zhai S. Chem. Commun. 2009:968. doi: 10.1039/b813524j. [DOI] [PubMed] [Google Scholar]
- 22.Viau G, Ravel F, Acher O, Fiévet-Vincent F, Fiévet F. J. Appl. Phys. 1994;76:6570. [Google Scholar]
- 23.Laurent S, Forge D, Port M, Roch A, Robic C, Elst LV, Muller RN. Chem. Rev. 2008;108:2064. doi: 10.1021/cr068445e. [DOI] [PubMed] [Google Scholar]
- 24.Neuberger T, Schöpf B, Hofmann H, Hofmann M, von Rechenberg B. J. Magn. Mag. Mater. 2005;293:483. [Google Scholar]
- 25.Moghimi SM, Hunter AC, Murray JC. Pharm. Rev. 2001;53:283. [PubMed] [Google Scholar]
- 26.Xie J, Chen K, Lee H, Xu C, Hsu AR, Peng S, Chen X, Sun S. J. Am. Chem. Soc. 2008;130:7542. doi: 10.1021/ja802003h. [DOI] [PMC free article] [PubMed] [Google Scholar]
- 27.Jun Y-W, Huh Y-M, Choi J-S, Lee J-H, Song H-T, Kim S, Yoon S, Kim K-S, Shin J-S, Suh J-S, Cheon J. J. Am. Chem. Soc. 2005;127:5732. doi: 10.1021/ja0422155. [DOI] [PubMed] [Google Scholar]
- 28.Groman EV, Bouchard JC, Reinhardt CP, Vaccaro DE. Bioconjugate Chem. 2007;18:1763. doi: 10.1021/bc070024w. [DOI] [PubMed] [Google Scholar]
- 29.Shen T, Weissleder R, Papisov M, Bogdanov A, Jr, Brady TJ. Magn. Reson. Med. 1993;29:599. doi: 10.1002/mrm.1910290504. [DOI] [PubMed] [Google Scholar]
- 30.Pannu HK, Wang KP, Borman TL, Bluemke DA. J. Magn. Reson. Imaging. 2000;12:899. doi: 10.1002/1522-2586(200012)12:6<899::aid-jmri13>3.0.co;2-r. [DOI] [PubMed] [Google Scholar]
- 31.Deng H, Li X, Peng Q, Wang X, Chen J, Li Y. Angew. Chem. Int. Ed. 2005;44:2782. doi: 10.1002/anie.200462551. [DOI] [PubMed] [Google Scholar]
- 32.Ge J, Hu Y, Biasini M, Beyermann WP, Yin Y. Angew. Chem. Int. Ed. 2007;46:4342. doi: 10.1002/anie.200700197. [DOI] [PubMed] [Google Scholar]
- 33.Déry J-P, Borra EF, Ritcey AM. Chem. Mater. 2008;20:6420. [Google Scholar]
- 34.Herrwerth S, Rosendahl T, Feng C, Fick J, Eck W, Himmelhaus M, Dahint R, Grunze M. Langmuir. 2003;19:1880. [Google Scholar]
- 35.Hu F, Li Z, Tu C, Gao M. J. Colloid Interface Sci. 2007;311:469. doi: 10.1016/j.jcis.2007.03.023. [DOI] [PubMed] [Google Scholar]
- 36.Tartaj P, Morales MP, Veintemillas-Verdaguer S, González-Carreño T, Serna CJ. J. Phys. D: Appl. Phys. 2003;36:R182. [Google Scholar]
- 37.Daou TJ, Grenèche JM, Pourroy G, Buathong S, Derory A, Ulhaq-Bouillet C, Donnio B, Guillon D, Begin-Colin S. Chem. Mater. 2008;20:5869. [Google Scholar]
- 38.LaConte LEW, Nitin N, Zurkiya O, Caruntu D, O’Connor CJ, Hu X, Bao G. J. Magn. Reson. Imaging. 2007;26:1634. doi: 10.1002/jmri.21194. [DOI] [PubMed] [Google Scholar]
- 39.Tromsdorf UI, Bigall NC, Kaul MG, Bruns OT, Nikolic MS, Mollwitz B, Sperling RA, Reimer R, Hohenberg H, Parak WJ, Förster S, Beisiegel U, Adam G, Weller H. Nano Lett. 2007;7:2422. doi: 10.1021/nl071099b. [DOI] [PubMed] [Google Scholar]
- 40.Duan H, Kuang M, Wang X, Wang YA, Mao H, Nie S. J. Phys. Chem. C. 2008;112:8127. [Google Scholar]
- 41.Vergara A, Paduano L, Vitagliano V, Sartorio R. Phys. Chem. Chem. Phys. 1999;1:5377. [Google Scholar]
Associated Data
This section collects any data citations, data availability statements, or supplementary materials included in this article.


