Abstract
In our previous studies, we have introduced model-based "unctional biomarkers"or "hysiomarkers"of cerebral hemodynamics that hold promise for improved diagnosis of early-stage Alzheimer’s disease (AD). The advocated methodology utilizes subject-specific data-based dynamic nonlinear models of cerebral hemodynamics to compute indices (serving as possible diagnostic physiomarkers) that quantify the state of cerebral blood flow autoregulation to pressure-changes (CFAP) and cerebral CO2 vasomotor reactivity (CVMR) in each subject. The model is estimated from beat-to-beat measurements of mean arterial blood pressure, mean cerebral blood flow velocity and end18 tidal CO2, which can be made reliably and non-invasively under resting conditions. In a previous study, it was found that a CVMR index quantifying the impairment in CO2 vasomotor reactivity correlates with clinical indications of early AD, offering the prospect of a potentially useful diagnostic tool. In this paper, we explore the use of the same model-based indices for patients with amnestic Mild Cognitive Impairment (MCI), a preclinical stage of AD, relative to a control subjects and clinical cognitive assessments. It was found that the model-based CVMR values were lower for MCI patients relative to the control subjects.
Introduction
Cognitive impairment in patients with early-stage Alzheimer disease (AD) has been associated with cerebrovascular dysfunction [1–9] and cerebrovascular lesions [10–12]. Thus, quantitative and objective measures of cerebral hemodynamic function may offer useful means for early diagnosis of AD. Patients with amnestic mild cognitive impairment (MCI) have high risk of developiong AD and may represent a transitional stage between normal aging and AD [13]. Thus, measures of cerebrovascular function may be useful in monitoring disease progression and the effects of interventions for prevention and treatments.
The physiological process of cerebral blood flow autoregulation in response to pressure-changes (CFAP) and CO2 vasomotor reactivity (CVMR) have been viewed as two fundamental aspects of cerebral hemodynamic autoregulation [14–33]. To advance the study of these processes, a modeling methodology has been introduced and tested with beat-to-beat hemodynamic data using open-loop analysis [34] and closed-loop analysis [35]. These modeling studies of cerebral hemodynamics explored the potential of model-based "physiomarkers" for improved diagnosis of early-stage AD and discovered that a subject-specific CVMR index attained significantly lower values in AD patients (relative to the normative population of control subjects), suggesting potential diagnostic utility for such indices [36]. Whether such model-based indices can be sensitive and specific "physiomarkers" for improved clinical diagnosis will have to be ascertained through analysis of appropriate and large size clinical data. This paper is part of such a continued effort and presents results from an initial set of MCI patients and normal control subjects. Since this is only a pilot study, definitive conclusions cannot be drawn regarding potential clinical utility before more extensive clinical data are analyzed in the future.
Methods
Experimental Methods
We analyzed time-series data of beat-to-beat averages over each R-R interval of mean arterial blood pressure (MABP), end-tidal CO2 (ETCO2) and mean cerebral blood flow velocity (MCBFV) from 17 control subjects (67.3 ± 7.7 age, 7 men and 10 women) and 22 MCI patients (65.8 ± 6.6 ages, 11 men and 11 women) who participated voluntarily in this study and signed the Informed Consent Form that has been approved by the IRB of the University of Texas Southwestern Medical Center and Presbyterian Hospital of Dallas, where the data were collected at the Institute for Exercise and Environmental Medicine. The diagnosis of amnestic MCI was based on modified Petersen criteria [13]. Subjects were screened to exclude clinical histories of stroke, major medical and psychiatric disorders, unstable heart diseases, uncontrolled hypertension and diabetes mellitus.
Arterial blood pressure was measured continuously and non-invasively with finger photoplethysmography (Finapres) and cerebral blood flow velocity was measured in the middle cerebral artery using a 2 MHz transcranial Doppler (TCD) probe (Multiflow, DWL) placed over the temporal window and fixed at constant angle with a custom-made holder. Heart rate was monitored by electrocardiogram (ECG) and end-tidal CO2 tension was obtained via a nasal cannula using capnography (Criticare Systems). All experiments were performed in a quiet, environmentally controlled laboratory under resting conditions. After at least 20 minutes of supine rest, 6–8 minutes of recordings were made in the supine position for 17 control subjects (CS) and 22 MCI patients (MP). These non-invasive measurements are reliable, safe and comfortable for older subjects.
Data Preprocessing
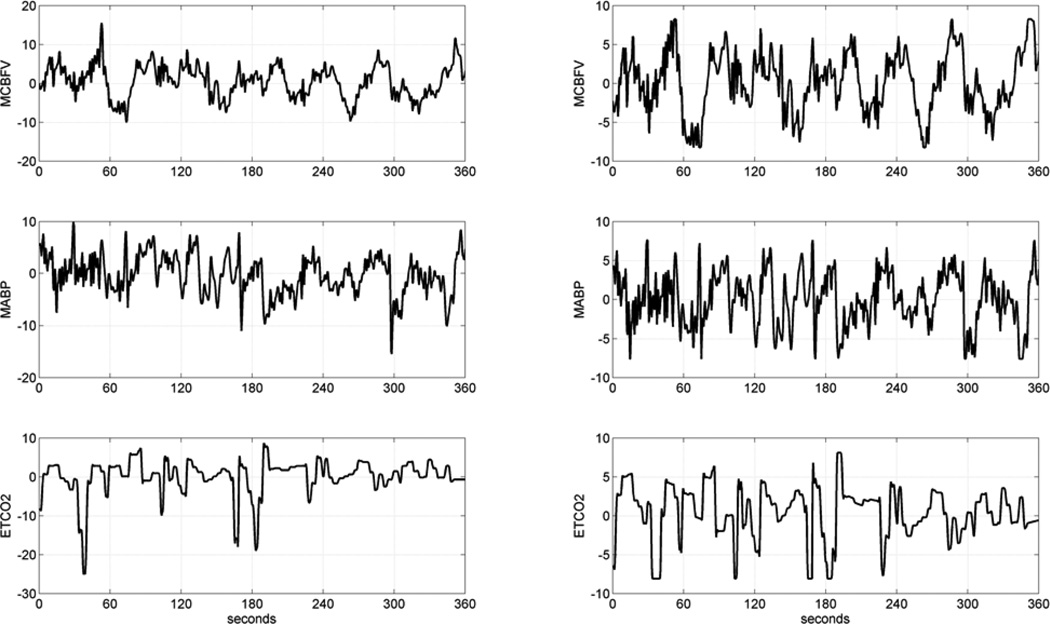
Occasional measurement artifacts in the beat-to-beat time-series data of MABP, ETCO2 and MCBFV were removed by applying a threshold criterion on the maximum change that is physiologically possible from beat to beat in these variables. These beat-to-beat values were re-sampled every 0.5 sec via cubic-spline interpolation and were high-pass filtered (via subtraction of a 2-min moving-average with Hanning window) to remove the constant baseline and very low frequency trends below ~0.01 Hz. The resulting time-series data were clipped at +/− 2 standard deviations to mitigate the effects of occasional outliers. The ETCO2 data were shifted by 3.4 sec to compensate for the latency of the measurement apparatus. Figure 1 shows illustrative time-series data (both raw and pre-processed) for one of the MCI patients over 6 min.
Figure 1.
Illustrative time-series data over 6 min of a typical MCI patient, representing beat-to-beat spontaneous variations of MCBFV (top), MABP (middle) and ETCO2 (bottom). The raw data are on the left column and the pre-processed data are on the right column. The units of the ordinate axis are: cm/sec for MCBFV and mmHg for MABP and ETCO2.
Modeling methods
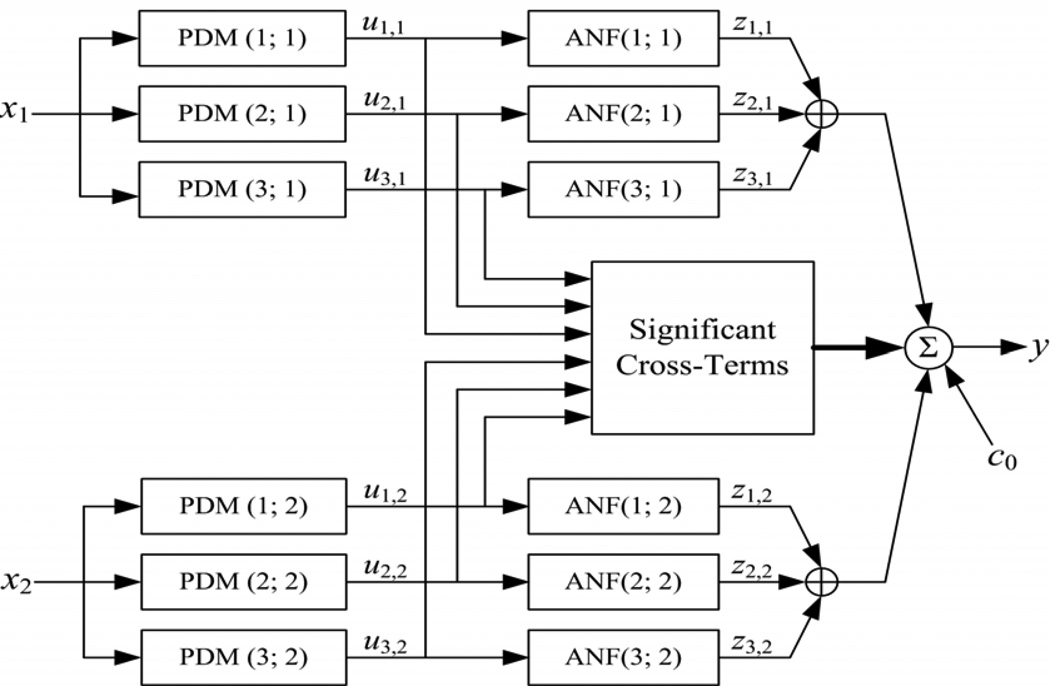
In this study, we employ the concept of Principal Dynamic Modes (PDMs) to obtain compact dynamic nonlinear models of the relationship between two beat-to-beat input signals: MABP and ETCO2, and one output signal: MCBFV. The use of PDMs makes the obtained dynamic nonlinear models compact and allows their accurate estimation from short data-records (6–8 min). The PDMs also facilitate the physiological interpretation of the obtained model [34–38]. We briefly outline below the proposed PDM-based modeling approach, which is also summarized in Appendix I. For the many mathematical and technical details of Volterra-type modeling and related issues, the reader is referred to the monograph [38] and to our recent publications presenting its application to cerebral hemodynamics in the input-output open-loop context [34] and in the closed-loop context [35]. In short, the output of the PDM-based open-loop model is formed by additive signal components that are generated by cascaded operations of convolutions of the input signal with each PDM and nonlinear transformations by the respective Associated Nonlinear Function (ANFs). The resulting signals are summed to form the model output with the addition of cross-terms that represent the multiplicative interactions between PDM outputs (see Figure 2). The mathematical operations involved in this process are summarized in Appendix I, along with the procedure by which the PDMs and the ANFs are obtained from the data.
Figure 2.
The block-diagram of the input-output open-loop PDM-based model with three global PDMs for each input, x1: MABP and x2: ETCO2.The output uj,m(n) of the j-th PDM, pj,m, for the m-th input, xm, is the convolution of the PDM with the respective input: uj,m(n) = conv{pj,m ,xm}. In this application, the ANFs are cubic polynomials: zj,m = fj,m (uj,m) = a1,j,m uj,m+ a2,j,m uj,m2 + a3,j,m uj,m3. The selected cross-terms, {ci,j ui,1(n) uj,2(n)}, have significant correlation with the output y: MCBFV, which is the sum of all ANF output components {zj,m}, the selected significant cross-terms and a constant c0 (taken from [35]).
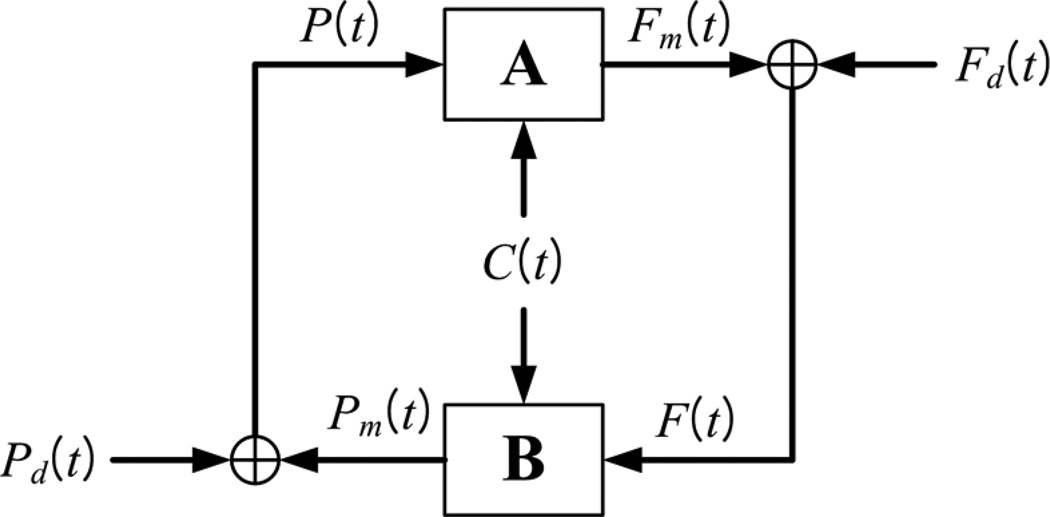
In the closed-loop analysis, we consider two input-output models, A and B, which describe how MCBFV and MABP (viewed as outputs, respectively) are influenced by the other two variables (viewed as the two inputs). A block-diagram for the closed-loop model is shown in Figure 3 and indicates the presence of two putative external (systemic) "disturbances" which are the residuals for each open-loop model prediction. The key mathematical operations and the concepts involved in the closed-loop modeling approach are summarized in Appendix II and expounded in a recent publication [35].
Figure 3.
Block-diagram of the closed-loop PDM-based model, where F(t) denotes the MCBFV data, P(t) denotes the MABP data, C(t) denotes the ETCO2 data, Fm(t) denotes the MCBFV model prediction of system component A and Pm(t) denotes the MABP model prediction of system component B. The signals Fd(t) and Pd(t) are the residuals of the respective model predictions (Fm(t) for A and Pm(t) for B) and they are viewed as systemic cerebral blood flow and pressure "disturbances" driving this closed-loop physiological system (taken from [35]).
The key modeling concept of this approach is that the selected PDMs represent an efficient set of "basis functions" (distinct and characteristic for each system) capable of describing adequately and compactly the system dynamics [38]. Although each subject generally has its own characteristic set of PDMs, "global" PDMs valid for all subjects can be found via a 'fusing' procedure (see Appendix I) that employs Singular Value Decomposition (SVD) of a rectangular matrix containing all PDMs from each subject within the chosen ensemble of reference subjects, weighted by the respective singular values [35]. The obtained global PDMs constitute a common functional basis for representing the system dynamics (kernels) for a given ensemble of subjects/systems (e.g. the 17 control subjects in this study). The ability of the global PDMs to represent the dynamics of the entire ensemble is validated by the predictive accuracy of the global PDM-based model for each subject.
Three global PDMs and cubic ANFs have been found to be adequate for each input of the cerebral hemodynamics system in both subsystems A and B of the closed-loop configuration in Figure 3 [35]. The use of global PDMs keeps the total number of free parameters for each two-input PDM-based model low (between 20 and 25 in this application, depending on the number of selected significant cross-terms which has varied between 1 and 6 in this application). Although the global PDMs are common for all subjects, the estimated ANFs associated with each global PDM are subject-specific and can be used to characterize uniquely the cerebral hemodynamic autoregulation for each subject. This is the basis for the potential utility of the PDM-based modeling approach for clinical diagnosis.
I. Results
The mean (standard deviation (SD)) values of the baseline (average) values of the MCBFV, MABP and ETCO2 time-series data for the two groups of 17 control subjects (CS) and 22 MCI patients (MP) are reported in Table 1, along with the mean (SD) values of the "baseline resistance" and "baseline reactivity" estimates defined as the ratios of MABP/MCBFV and MCBFV/ETCO2 baseline values respectively. These values do not appear to provide differentiation between the CS and the MP groups, as indicated by the computed p-values that are shown in Table 1
Table 1.
Mean (SD) values of the averages of the time-series data (baseline values) and the baseline-ratio resistance and reactivity for the 17 CS and 22 MP.
| Subjects | Baseline Value | Baseline Value | Baseline Value | Baseline-Ratio | Baseline-Ratio |
|---|---|---|---|---|---|
| of MCBFV [cm/sec] |
of MABP [mmHg] |
of ETCO2 [mmHg] |
Resistance [mmHg/cm/sec] |
Reactivity [cm/sec/mmHg] |
|
| Controls: µ (σ) | 54.90 (18.43) | 95.64 (12.99) | 38.48 (3.32) | 1.88 (0.53) | 1.43 (0.45) |
| Patients: µ (σ) | 54.99 (9.72) | 98.86 (12.98) | 38.06 (2.68) | 1.87 (0.50) | 1.45 (0.28) |
| t-statistic/dof | 0.0183/22 | 0.7669/34 | 0.4254/30 | 0.0599/33 | 0.1608/25 |
| two-sided p-values | 0.986 | 0.448 | 0.674 | 0.953 | 0.874 |
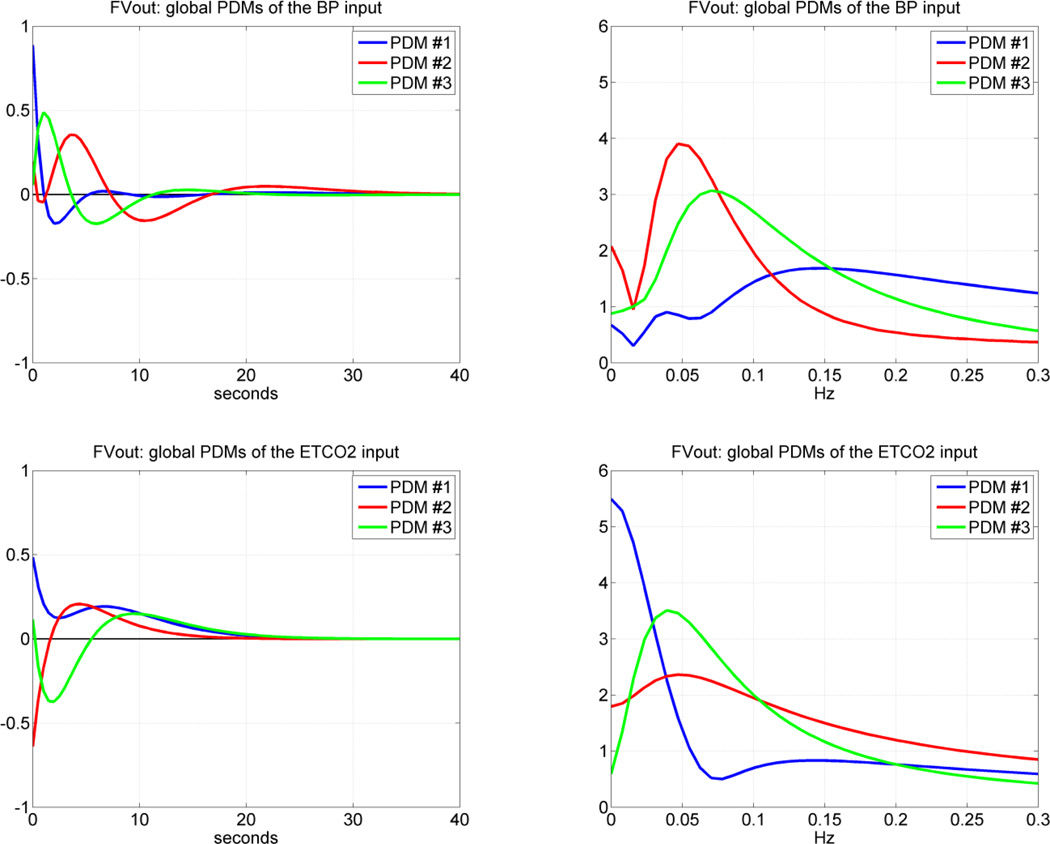
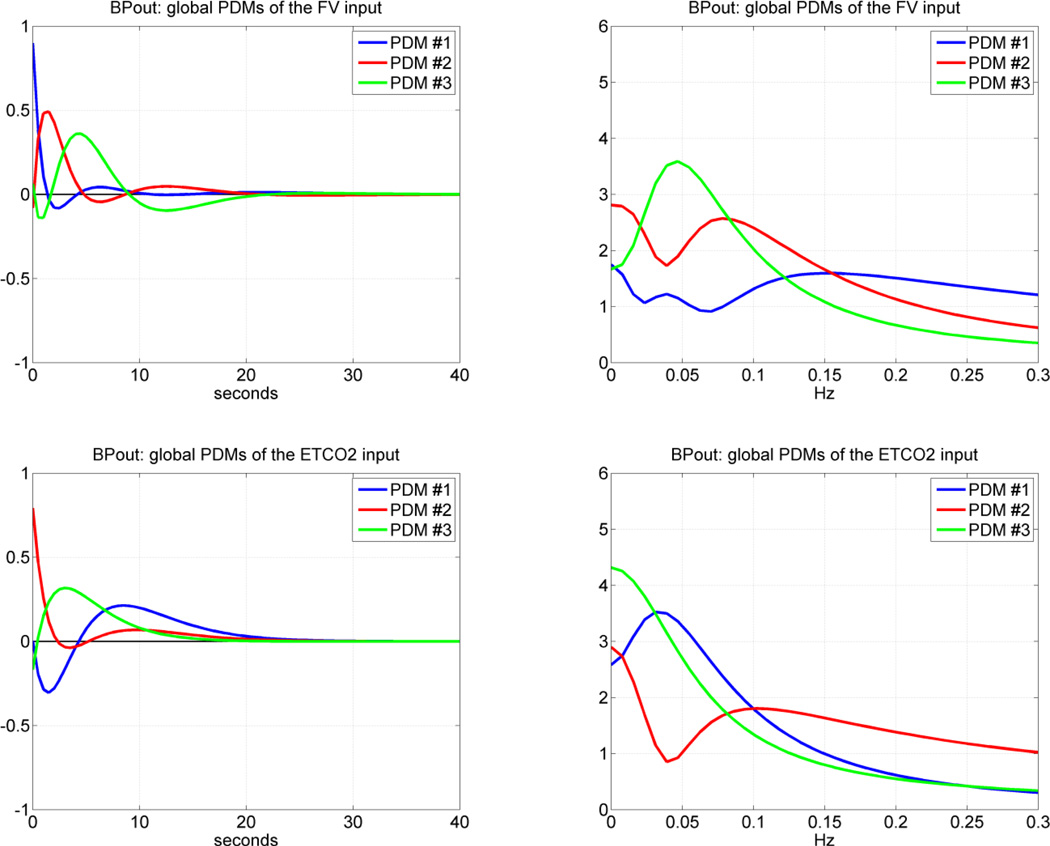
Following the procedure outlined in the Methods section and in Appendix I, we obtained the "global" PDMs from the reference set of 17 CS that are shown in Figure 4 for the subsystem A and in Figure 5 for the subsystem B (in the time and frequency domains). We observe that the global PDMs exhibit distinctive spectral characteristic in the form of resonant peaks and troughs that may attain importance for the interpretation of the PDM-based model and the functional properties of this system (see Discussion). Our previous studies have shown that most of the nonlinear characteristics of the cerebral hemodynamics are exhibited in the frequency range 0.02 – 0.08 Hz [26–29, 34–35] and, therefore, the nonlinearities are expected to be associated primarily with the PDMs which exhibit resonant peaks in that frequency range. The time-domain PDM waveforms indicate that the "memory" of this system is ~ 30 sec (i.e. the effect of a change in the input variables upon the output variable lasts less than 30 sec).
Figure 4.
The three global PDMs for the MABP input (top) and for the ETCO2 input (bottom) of the dual-input subsystem A with output MCBFV. Left panels are time-domain representations. Right panels are frequency-domain representations. The units in the ordinate axis of the left panels (time-domain PDMs) are: cm/sec2/mmHg (i.e. [output units]/{[input units][time units]}).
Figure 5.
The three global PDMs for the MCBFV input (top) and for the ETCO2 input (bottom) of the dual-input subsystem B with output MABP. Left panels are time-domain representations. Right panels are frequency-domain representations. The units in the ordinate axis of the left panels (time-domain PDMs) are: mmHg/cm/sec2 (top) and sec−1 (bottom).
In order to obtain the PDM-based model for each subject, we must estimate the ANF of each global PDM for this subject, as well as the coefficients of the significant cross-terms, following the procedure outlined in Methods. The ANFs are distinct for each subject and can be used to quantify the CFAP and CVMR characteristics of the subject. To examine whether a linear PDM-based model (where the ANFs are of 1st degree) would be adequate, we report in Table 2 the percent Normalized Mean-Square Error (NMSE) of the PDM-based model prediction for both subsystems A and B using a linear model (1st degree ANFs) and a nonlinear model (3rd degree ANFs) of each subject in the groups of 17 CS and 22 MP. The nonlinear model reduces the average prediction NMSE enough to satisfy the Model Order Selection Criterion [38]. The statistical significance of this NMSE reduction is corroborated for both controls and patients by the computed p-values shown in Table 2 for subsystem A and B. Therefore, the PDM-based nonlinear model is deemed appropriate for the CFAP and CVMR processes of cerebral hemodynamics.
Table 2.
Mean (SD) values of percent NMSEs of PDM-based linear and nonlinear model predictions for the 17 CS and 22 MP, and computed p-values for linear vs. nonlinear model of subsystem A and B.
| Subsystem A | Subsystem B | |||
|---|---|---|---|---|
| Control Subjects (CS) |
MCI Patients (MP) | Control Subjects (CS) |
MCI Patients (MP) | |
| Linear Model: µ (σ) | 56.36 (18.53) | 54.46 (16.94) | 65.89 (20.88) | 59.94 (16.74) |
| Nonlinear Model: µ (σ) | 43.24 (14.87) | 43.19 (14.60) | 49.17 (14.70) | 45.89 (11.86) |
| two-sided p-values using all 39 subjects | 0.0014 | 0.0001 | ||
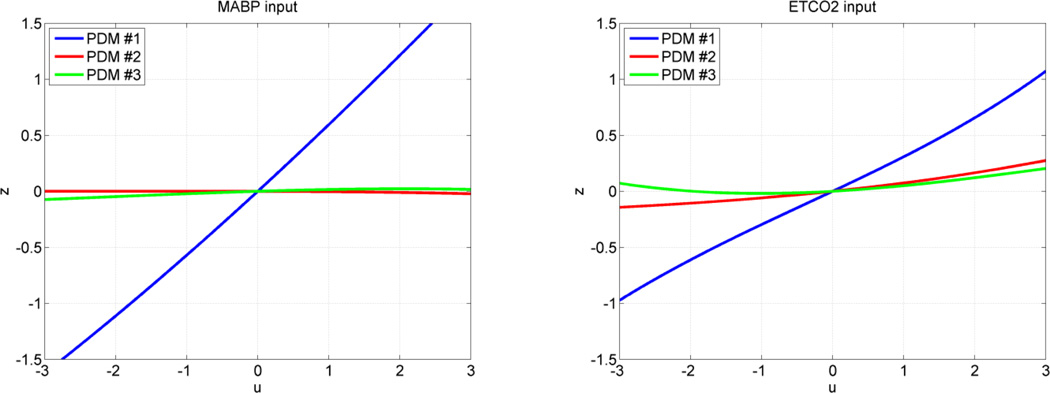
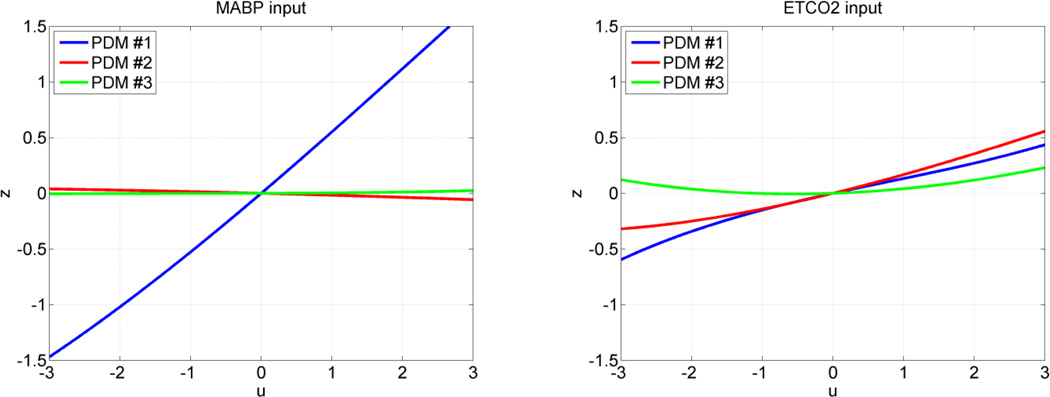
The form of the obtained ANFs is illustrated for the MABP and ETCO2 inputs of subsystem A using the mean coefficient values over all 17 CS in Figure 6 and over all 22 MP in Figure 7. The average ANFs for subsystem >B are omitted in the interest of space. Considerable inter-subject variability in the ANF coefficient estimates was observed, especially for the 2nd and 3rd PDMs of the CO2 input. Therefore, the small slope of the average 2nd and 3rd ANFs of the CO2 input should not be taken to imply that the contributions of these ANFs are insignificant in any single subject, because of this inter-subject variability that may even alter their sign in some subjects. The 2nd and 3rd ANFs of the MABP input do not exhibit this high variability and remain generally small. It is evident in Figures 6 and 7 that the ANF of the 1st PDM for the MABP input is almost rectilinear and dominant over the other two ANFs and exhibits the fastest dynamics, spanning about 5 sec. On the other hand, the dynamics of the system response to CO2 changes, as depicted by the respective PDMs, are generally slower, in agreement with previous physiological observations.
Figure 6.
The three average ANFs of the global PDMs for the MABP input (left) and ETCO2 input (right) in the group of 17 CS. The ANFs correspond to the 1st PDM (blue), 2nd PDM (red) and 3rd PDM (green). The 1st ANF appears dominant, especially for the MABP input.
Figure 7.
The three average ANFs of the global PDMs for the MABP input (left) and ETCO2 input (right) in the group of 22 MP. The ANFs correspond to the 1st PDM (blue), 2nd PDM (red) and 3rd PDM (green). The 1st ANF appears dominant for the MABP input but not for the ETCO2 input.
Of particular importance is the observed reduction in the mean slope of the 1st ANF of the ETCO2 input for the MP relative to the CS (μ = 0.31 and σ = 0.32 for the 17 CS; μ = 0.15 and σ = 0.38 for the 22 MP; yielding a one-sided p-value of 0.094). This finding suggests reduced average dynamic CO2 vasomotor reactivity among the MCI patients – consistent with what has been reported previously for Alzheimer's patients.
The estimated coefficients of the selected significant cross-terms varied between 1 and 6 in these subjects and had a minor contribution to the total output model prediction (on the order of 1–5 %). We note that the maximum number of free parameters in each of the PDM-based models for subsystem A or B is 25 (including the significant cross-terms and a constant). Thus, the total number of free parameters for the closed-loop system does not exceed 50, which satisfies the rule-of-thumb requiring at least 5 times more independent samples to avoid overfitting (300–360 independent beat-to-beat samples are used in this application).
To demonstrate the distinct functional characteristics captured by the PDM-based models of the CS and MP groups of this study, we compute the model predictions of MCBFV for pulse changes in MABP to quantify the CFAP characteristics of each subject or for pulse changes in ETCO2 to quantify the CVMR characteristics of each subject, separately. It is critical to note that the model-predicted response to a pulse change in one input of this dual-input system is computed while the other input is kept at its baseline level (simulated clamping). For the closed-loop model, the considered inputs are imposed externally upon the closed-loop as "systemic disturbances" (see Figure 3) and intra-loop pressure and flow variables are simultaneously induced. To maintain stability of the closed-loop model simulation and avoid aberrant results at the fringes of the nonlinear range, we perform these simulations for input pulses with duration of 30 sec (the observed "memory" of the system) and magnitude equal to one-half standard deviation (SD) of the respective recorded data. The resulting MCBFV model prediction (for the open-loop or closed-loop model) is averaged over the 30 sec duration of the input pulse and divided by the respective pulse magnitude. The results for a positive and a negative pulse (of the same magnitude) are subtracted to yield the "index" for CFAP when the pulse stimulus is MABP, or the CVMR index when the pulse stimulus is ETCO2.
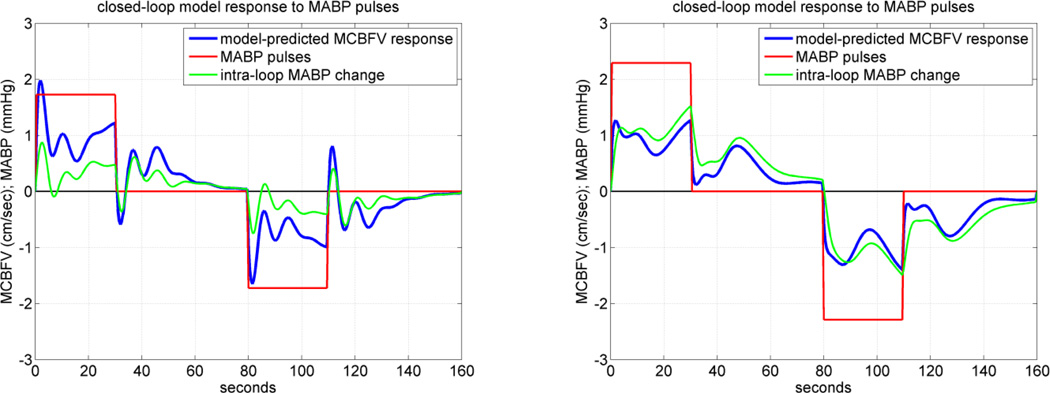
An illustrative example of simulated MCBFV responses to positive and negative MABP pulse stimulus for the closed-loop model is given in Figure 8 for CS #1 (left panel) and MP#1 (right panel), where the positive pulse stimulus is applied over the first 30 sec and the negative pulse stimulus is applied over the interval of 80–110 sec, while the ETCO2 disturbance is kept at zero. To demonstrate the fact that, in the closed-loop model, an intra-loop MABP change is induced by the MABP stimulus which is externally imposed (i.e. the systemic disturbance Pd(t) in Figure 3), we also plot this induced intra-loop MABP change in green. The result indicates that the CS exhibits normal pressure autoregulation, since the model-predicted flow response returns towards the baseline, after a few seconds following an initial peak response (positive for pressure increase, negative for pressure decrease). However, this is not seen in the result for the MP, suggesting possible impairment of pressure autoregulation.
Figure 8.
The closed-loop model-predicted MCBFV response (blue line) for a representative CS (left panel) and MP (right panel) to a positive MABP pulse stimulus over the time-interval 0–30 sec (red line), equal to half SD of the recorded MABP data, and to a negative MABP pulse stimulus of the same magnitude over the time-interval 80–110 sec, while the ETCO2 input is kept at zero. The externally imposed MABP pulse stimulus induces an intra-loop MABP change which is plotted in green. Normal pressure autoregulation is observed for the CS (left) but not for the MP (right) (see text).
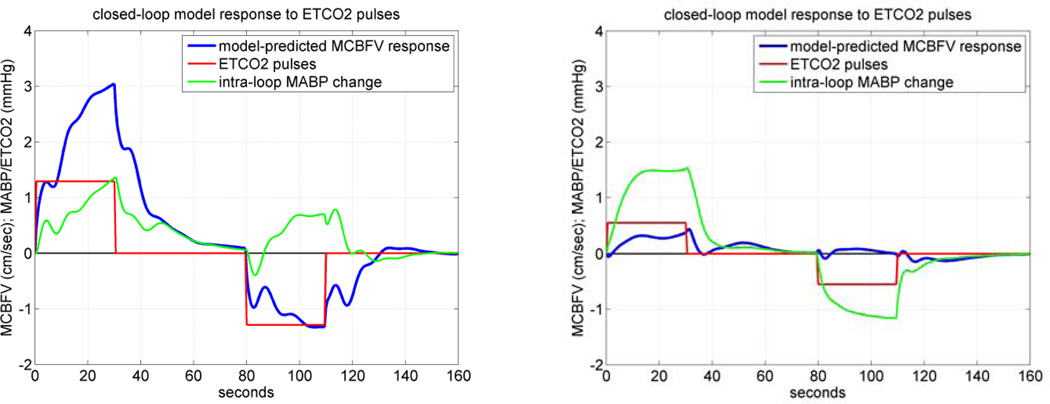
An illustrative example of simulated MCBFV responses to positive and negative ETCO2 pulse stimulus for the closed-loop model is given in Figure 9 for CS #1 (left panel) and MP#1 (right panel), where the positive pulse stimulus is applied over the first 30 sec and the negative pulse stimulus is applied over the interval of 60–90 sec, while the MABP disturbance is kept at zero. To demonstrate the fact that, in the closed-loop model, the ETCO2 stimulus (C(t) in Figure 3) induces an intra-loop MABP change, we also plot the latter in green. These simulated model predictions indicate that the control subject CS#1 exhibits normal vasomotor reactivity with respect to CO2 changes, because the resulting MCBFV response increases or decreases depending on whether the ETCO2 stimulus increases or decreases, respectively. However, this is not the case for the patient MP#1, where the result indicates impairment of CO2 vasomotor reactivity for this MCI patient, since the induced change in MCBFV follows a direction opposite to the imposed change of ETCO2. This is a very stark result with important implications, which, however, was not observed in all MCI patients of this study.
Figure 9.
The closed-loop model-predicted MCBFV response (blue line) for a representative CS (left panel) and MP (right panel) to a positive ETCO2 pulse stimulus over the time-interval 0–30 sec (red line), equal to half SD of the recorded ETCO2 data, and to a negative ETCO2 pulse stimulus of the same magnitude over the time-interval 80–110 sec, while the MABP input is kept at zero. The ETCO2 stimulus induces an intra-loop MABP change which is plotted in green. The model prediction in the CS demonstrates normal CO2 vasomotor reactivity, however, this was not the case for the MCI patient.
These MCBFV simulated responses allow the computation of CFAP and CVMR indices as the difference of time-averages of the two pulse responses over 30 sec, normalized by the magnitude of the respective input pulse. A sigmoidal transformation of the computed differences is applied via the logistic function in order to mitigate the undue influence of outliers on the derived indices.
The mean (SD) values of the computed CFAP and CVMR indices for the two groups of 17 CS and 22 MP are given in Table 3 for closed-loop linear and nonlinear (cubic) analysis. The results indicate a significant reduction of the CVMR index for the nonlinear models (p-value of 0.04) and less significant reduction for the linear models (p-value of 0.07), but no significant change of the CFAP index for either linear or nonlinear models (p-values of 0.90 and 0.77 respectively) in the MP group relative to the CS group (see Discussion).
Table 3.
The mean (SD) values of the computed model-based CFAP and CVMR indices for closed-loop analysis of 17 CS and 22 MPusing linear and nonlinear ANFs.
| CFAP Index (cm/sec/mmHg) | CVMR Index (cm/sec/mmHg) | |||
|---|---|---|---|---|
| Cubic ANFs | Linear ANFs | Cubic ANFs | Linear ANFs | |
| 17 CS | 0.78 (0.72) | 0.87 (0.76) | 2.36 (1.37) | 2.21 (1.44) |
| 22 MP | 0.71 (0.75) | 0.84 (0.62) | 1.06 (2.44) | 1.16 (2.09) |
| t-statistic/dof | 0.30/35 | 0.13/30 | 2.11/34 | 1.85/36 |
| two-sided p-values | 0.77 | 0.90 | 0.04 | 0.07 |
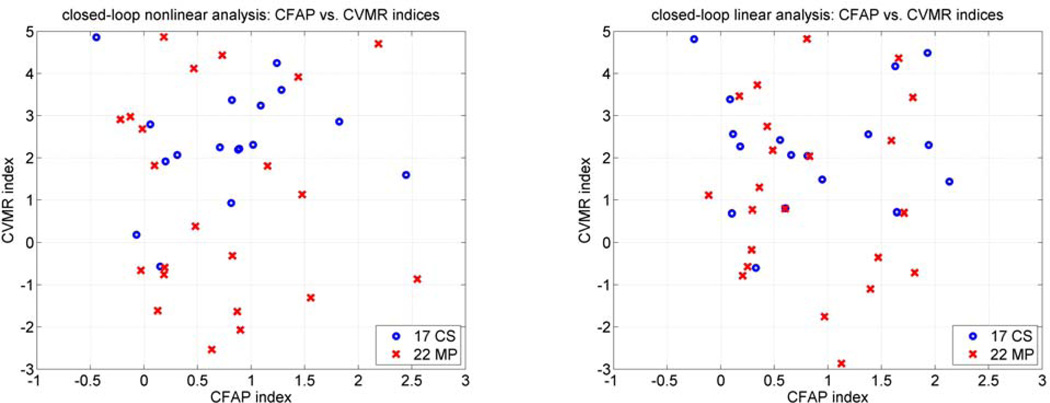
The computed CVMR and CFAP indices from the closed-loop linear and nonlinear models are plotted in Figure 10 for all subjects. The correlation between the CFAP and CVMR index values is weak for both groups of CS and MP (on the order of r = 0.1, for both linear and nonlinear models), suggesting different underlying regulatory mechanisms for the CFAP and CVMR processes.
Figure 10.
Scatter-plots of the computed CVMR and CFAP indices for the 17 CS (blue circles) and 22 MP (red x's) using closed-loop nonlinear (left) and linear (right) analysis.
Discussion & Conclusions
Previous studies have shown that the progression of cognitive impairment in patients with Alzheimer's disease (AD) is associated with impairment of cerebral vasomotor reactivity (CVMR) to hypercapnia [1–2]. This observation has also been made in many conditions of dementia and neurodegenerative disease [3–9]. In addition, there have been indications that cerebral amyloid angiopathy may represent a link between AD and cerebrovascular disease [10–12]. The practical ability to obtain reliable, sensitive, quantitative and objective measures of cerebral vascular dysfunction in a clinical setting will assist efforts for improved diagnosis, prevention and treatment of cerebrovascular and cognitive dysfunction.
This paper proposes a modeling methodology that allows computation of quantitative "physiomarkers" with potential diagnostic value, using non-invasive measurements of beat-to-beat data of Mean Arterial Blood Pressure (MABP), End-Tidal CO2 (ETCO2) and Mean Cerebral Blood Flow Velocity (MCBFV) under resting conditions. The proposed methodology employs the concept of Principal Dynamic Modes (PDMs) to obtain dual-input dynamic nonlinear models of cerebral autoregulation that include the processes of cerebral blood flow autoregulation to pressure (CFAP) and CO2 vasomotor reactivity (CVMR) [34–35]. In recently published work, we have shown that PDM-based models yield quantitative measures of CVMR and CFAP in the form of scalar indices that can be used potentially as diagnostic physiomarkers, since reduced values of the CVMR index were observed consistently in an initial set of AD patients [36]. The present study explores the use of these model-based indices in data collected in 22 MCI patients and 17 control subjects. It was found that the model-ased index values for vasomotor reactivity were lower for the MCI patients relative to the control subjects.
An issue of fundamental importance concerns the physiological plausibility of the proposed (novel) closed-loop model of cerebral hemodynamics. The thrust of this issue is that the main effects captured by the closed-loop model should be physiological in nature and take place over time-scales of several seconds. Plausible physiological mechanisms that can explain such flow-to-pressure effects should logically be triggered by changes in arterial blood flow velocity (or wall shear stress) and have the eventual effect of altering local cerebral perfusion pressure. One such possibility is the intraluminal "biological apparatus" of endothelial cells in the cerebral arteries and arterioles that senses changes in vascular wall shear stress and elicits active responses from cellular (and non-cellular) elements of the lumen, resulting potentially in changes of vessel diameter or vascular wall stiffness or vasomotor tone etc. (see, for instance, references [33–34] for evidence of flow-dependent changes in arteries and arterioles).
The main specific findings of this study are summarized below.
1. PDM-based nonlinear modeling of cerebral hemodynamics reveals valuable information
It was shown that nonlinear models of cerebral hemodynamics (cerebral blood flow autoregulation and CO2 vasomotor reactivity) can be obtained from 6–8 min beat-to-beat data of arterial pressure (MABP), cerebral flow velocity (MCBFV) and end-tidal CO2 (ETCO2) collected in 39 human subjects (22 clinically classified as MCI patients and 17 as control subjects), either in open-loop (see Figure 2) or in closed-loop (see Figure 3). These models are based on three "global" PDMs for each input-output causal relation, which are valid for all subjects. These PDMs exhibit characteristic resonant peaks (see Figures 4 and 5) that may be eventually related to specific physiological mechanisms through future studies. The nonlinear PDM-based models have greater predictive capability than their linear counterparts, resulting in 12–14% reduction of the prediction NMSE on the average (see Table 3). The nonlinearities of this system are subject-specific and found mostly in the effects of CO2 on cerebral hemodynamics. The average 1st ANF of the ETCO2 input has significantly reduced slope for the MP group, relative to the CS group, suggesting impaired vasomotor reactivity.
2. Physiomarkers of potential clinical utility can be derived from dual-input dynamic nonlinear models
The results of this study demonstrate that it is practically feasible to extract a dynamic nonlinear model of the dual-input system of cerebral hemodynamics from beat-to-beat data that can be collected easily and reliably in a clinical context. This model can be used to compute indices that quantify possible impairment of cerebral blood flow autoregulation or CO2 vasomotor reactivity for the purpose of improving clinical diagnosis. The model-predicted response to an input pulse was used for the purpose of computing these indices because it has been traditionally easier to relate physiologically to pulse responses. However, one may reasonably argue that an input waveform resembling spectrally the natural ensemble of inputs would be more appropriate for the purpose of computing the indices. Indications of vasomotor reactivity impairment were found in a recent study of Alzheimer's patients in the form of reduced values of the model-based CO2 vasomotor reactivity (CVMR) index [36]. This finding is consistent with previous reports regarding vasomotor reactivity impairment in Alzheimer's patients [2]. The indications were less clear for the model-based CFAP index in this set of subjects.
3. Closed-loop analysis versus open-loop analysis
On scientific and physiological grounds, we take the view that closed-loop analysis is more appropriate than open-loop analysis because local cerebral perfusion pressure and flow fluctuations are mutually interdependent via the vascular autoregulatory mechanisms that determine the variable cerebrovascular spatio-temporal characteristics. As indicated above, a plausible physiological explanation of the reciprocal pressure-flow relation can be found in flow-dependent mechanisms altering the vessel diameter in response to changes in wall shear stress [40, 41].
It was observed that the induced change in MCBFV in 10 of the 22 MCI patiernts followed an opposite direction to the imposed ETC02 test input (a phenomenon that would not be expected for large changes of ETCO2), suggesting two clusters of MCI patients with regard to this aspect of vasoreactivity. This may have potential clinical implications.
We note also that considerable inter-subject variability was observed, consistent with previous studies. This should not be surprising, given the complexity of this system and the numerous subject-specific attributes that influence its function. It is furthermore noted that the system exhibits considerable nonstationarity (variability over time) as a result of the influence of systemic factors that vary over time (e.g. the effects of the autonomic nervous system or the endocrine system). Because of this intrinsic nonstationarity, cross-validation was not used to evaluate the predictive capability of the models.
In closing, we emphasize that, although the presented initial results are intriguing, a larger population of MCI patients and control subjects must be examined before any definitive conclusions are drawn regarding the potential clinical utility of the proposed physiomarkers. Of particular importance is the question of specificity vs. sensitivity that will allow delineation among various cerebrovascular diseases using the model-based CVMR and CFAP indices. It is also important to explore whether the numerical values of the CVMR and CFAP indices can offer reliable quantitative measures of the stage of the disease in order to be used for assessing and monitoring the effects of treatment and/or medication over time.
Acknowledgements
Funding: This work was supported in part by the Biomedical Simulations Resource at the University of Southern California under NIH/NIBIB grant P41-EB001978 and NIA R01AG033106-01 grant to the UT-SWMC.
APPENDIX I
Basics of PDM-based modeling
The general nonparametric Volterra model is applicable to all finite-memory dynamic nonlinear systems, which covers almost all physiological systems (with the exception of chaotic systems or non-dissipating oscillators) [38]. In the proposed methodology, the modeling task commences with the estimation of a 2nd order Volterra model of the dual-input system of cerebral hemodynamics using Laguerre expansions of the kernels [39]:
| (A1) |
where p(t) denotes the MABP input, x(t) denotes the ETCO2 input, y(t) denotes the mean cerebral blood flow velocity (MCBFV) output and ε (t) denotes possible measurement or modeling errors. The dynamic characteristics of this system/model are described by the kernels: kp, kx, kpp, kxx, kpx, which are estimated using given input-output data: p(t), x(t) and y(t), by means of Laguerre expansions and least-squares fitting of the modified output edquation:
| (A2) |
where {ar} and {cr} are the Laguerre expansion coefficients of the two sets of kernels, and the signals vj(t) and zj(t) are the convolutions of the Laguerre basis function with the respective input. The fact that the Laguerre expansion coefficients enter linearly in the nonlinear input-output model of Equation (A2) allows their estimation via least-squares fitting.
Although the Laguerre expansion technique brings considerable model estimation efficiencies, it does not remove the “curse of dimensionality” associated with the multi-dimensional structure of high-order kernels. In order to overcome this practical limitation, we have introduced the concept of Principal Dynamic Modes (PDM), which aims at identifying an efficient "basis" of functions (distinct and characteristic for each system) that are capable of representing adequately the system dynamics (i.e. provide satisfactory expansions of the kernels). The computation of the PDMs for each input is based on Singular Value Decomposition (SVD) of a rectangular matrix composed of the 1st order kernel estimate (as a column vector) and the 2nd order self-kernel estimate (as a block matrix) weighted by the standard deviation of the respective input [35].
The resulting PDMs form a filter-bank that receives the respective input signal and generates (via convolution) signals that are subsequently transformed by the "Associated Nonlinear Function" (ANFs), which represents the nonlinear characteristics of the system for the respective PDM dynamics, to form additively the system output, as depicted schematically in Figure 2. The employed "global" PDMs represent a common “functional basis” for efficient representation of all kernels of the system for all subjects. These "global" PDMs are obtained via SVD of a rectangular matrix containing the PDMs of all subjects in a selected reference group (17 control subjects in this case). The use of PDMs allows us to write the output Equation (A2) as:
| (A3) |
where {uh} and {wm} are the PDM outputs (i.e. convolutions of the input with the respective PDM) for the MABP and ETCO2 inputs, respectively, and {fh} and {fm} are the ANFs associated with each PDM. The ANFs are typically polynomials (cubic in this application). The "Cross-Terms" in Equation (A3) are pair products of {uh} and {wm} that have significant correlation with the output. The coefficients of the selected Cross-Terms are estimated, along with c0 and the coefficients of the (cubic) ANFs via least-squares regression of Equation (A3).
APPENDIX II
Closed-loop PDM-based modeling
The closed-loop analysis requires the estimation of two open-loop PDM-based models A and B, following the approach described in Appendix I, which are placed in the configuration of Figure 3. The disturbance signals Fd (t) and Pd (t) are computed in each case as the model-prediction residuals and they are viewed as the physiological "drives" of the closed-loop system according to two equivalent closed-loop equations:
| (A4) |
| (A5) |
In the case of discretized data, Equations (A4) and (A5) are tantamount to nonlinear auto-regressive equations in F(t) or P(t) with stochastic coefficients and an exogenous variable C(t).
Footnotes
Publisher's Disclaimer: This is a PDF file of an unedited manuscript that has been accepted for publication. As a service to our customers we are providing this early version of the manuscript. The manuscript will undergo copyediting, typesetting, and review of the resulting proof before it is published in its final citable form. Please note that during the production process errors may be discovered which could affect the content, and all legal disclaimers that apply to the journal pertain.
Competing Interests: No competing interests or conflict of interest exist.
Ethical Approval: Ethical approval was given by the IRB at the UT-Southwestern Medical Center where the data were collected. Informed consent was signed by the subjects.
REFERENCES
- 1.Sellke FW, Seshadri S, Chui HC, Higashida RT, Lindquist R, Nilsson PM, Roman GC, Petersen RC, Schneider JA, Tzourio C, Arnett DK, Bennett D, Iadecola C, Launer LJ, Laurent S, Lopez OL, Nyenhuis D, Gorelick PB, Scuteri A, Black SE, DeCarli C, Greenberg SM. Vascular Contributions to Cognitive Impairment and Dementia: A Statement for Healthcare Professionals from the AHA/ASA. Stroke. 2011;42(9):2672–2713. doi: 10.1161/STR.0b013e3182299496. [DOI] [PMC free article] [PubMed] [Google Scholar]
- 2.Silvestrini M, Pasqualetti P, Baruffaldi R, Bartolini M, Handouk Y, Matteis M, Moffa F, Provinciali L, Vernieri F. Cerebrovascular reactivity and cognitive decline in patients with Alzheimer's disease. Stroke. 2006;37:1010–1015. doi: 10.1161/01.STR.0000206439.62025.97. [DOI] [PubMed] [Google Scholar]
- 3.de la Torre JC. Alzheimer disease as a vascular disorder. Nosological evidence. Stroke. 2002;33:1152–1162. doi: 10.1161/01.str.0000014421.15948.67. [DOI] [PubMed] [Google Scholar]
- 4.Iadecola C. Cerebrovascular effects of amyloid-beta peptides: mechanisms and implications for Alzheimer's dementia. Cell Mol Neurobiol. 2003;23:681–689. doi: 10.1023/A:1025092617651. [DOI] [PMC free article] [PubMed] [Google Scholar]
- 5.Iadecola C, Gorelick PB. Converging pathogenic mechanisms in vascular and neurodegenerative dementia. Stroke. 2003;34:335–337. doi: 10.1161/01.str.0000054050.51530.76. [DOI] [PubMed] [Google Scholar]
- 6.Murray IVJ, Proza JF, Sohrabji F, Lawler JM. Vascular and metabolic dysfunction in Alzheimer's disease: a review. Exp. Biology & Medicine. 2011;236(7):772–782. doi: 10.1258/ebm.2011.010355. [DOI] [PubMed] [Google Scholar]
- 7.Bell RD, Zlokovic BV. Neurovascular mechanisms and blood-brain barrier disorder in Alzheimer's disease. Acta Neuropathol. 2009;118(1):103–113. doi: 10.1007/s00401-009-0522-3. [DOI] [PMC free article] [PubMed] [Google Scholar]
- 8.Nicolakakis N, Hamel E. Neurovascular function in Alzheimer's disease patients and experimental models. J Cereb Blood Flow Metab. 2011;31(6):1354–1370. doi: 10.1038/jcbfm.2011.43. [DOI] [PMC free article] [PubMed] [Google Scholar]
- 9.Tong XK, Nicolakakis N, Kocharyan A, Hamel E. Vascular remodeling versus amyloid beta496 induced oxidative stress in the cerebrovascular dysfunctions associated with Alzheimer's disease. J Neurosci. 2005;25(48):11165–11174. doi: 10.1523/JNEUROSCI.4031-05.2005. [DOI] [PMC free article] [PubMed] [Google Scholar]
- 10.Tantucci C, Bottini P, Fiorani C, Dottorini ML, Santeusanio F, Provinciali L, Sorbini CA, Casucci G. Cerebrovascular reactivity and hypercapnic respiratory drive in diabetic autonomic neuropathy. J Appl Physiol. 2001;90:889–896. doi: 10.1152/jappl.2001.90.3.889. [DOI] [PubMed] [Google Scholar]
- 11.Cupini LM, Diomedi M, Placidi F, Silvestrini M, Giacomini P. Cerebrovascular reactivity and subcortical infarctions. Arch Neurol. 2001;58:577–581. doi: 10.1001/archneur.58.4.577. [DOI] [PubMed] [Google Scholar]
- 12.Schneider JA, Wilson RS, Bienias JL, Evans DA, Bennett DA. Cerebral infarctions and the likelihood of dementia from Alzheimer disease pathology. Neurology. 2004;62:1148–1155. doi: 10.1212/01.wnl.0000118211.78503.f5. [DOI] [PubMed] [Google Scholar]
- 13.Petersen RC, et al. Current concepts in Mild Cognitive Impairment. Arch Neurol. 2001;58(12):1985–1992. doi: 10.1001/archneur.58.12.1985. [DOI] [PubMed] [Google Scholar]
- 14.Aaslid R, Lindegaard KF, Sorteberg W, Nornes H. Cerebral autoregulation dynamics in humans. Stroke. 1989;20:45–52. doi: 10.1161/01.str.20.1.45. [DOI] [PubMed] [Google Scholar]
- 15.Czosnyka M, Piechnik S, Richards H, Kirkpatrick P, Smielewski P, Pickard J. Contribution of mathematical modeling to the interpretation of bedside tests of cerebrovascular autoregulation. J. Neurology, Neurosurgery & Psychiatry. 1997;63:721–731. doi: 10.1136/jnnp.63.6.721. [DOI] [PMC free article] [PubMed] [Google Scholar]
- 16.Czosnyka M, Brady K, Reinhard M, Smielewski P, Steiner L. Monitoring of cerebrovascular autoregulation: facts, myths and missing links. Neurocrit. Care. 2009;10:373–386. doi: 10.1007/s12028-008-9175-7. [DOI] [PubMed] [Google Scholar]
- 17.Giller CA. The frequency-dependent behavior of cerebral autoregulation. Neurosurgery. 1990;27:362–368. doi: 10.1097/00006123-199009000-00004. [DOI] [PubMed] [Google Scholar]
- 18.Giller CA, Mueller M. Linearity and nonlinearity in cerebral hemodynamics. Med. Eng. Phys. 2003;25:633–646. doi: 10.1016/s1350-4533(03)00028-6. [DOI] [PubMed] [Google Scholar]
- 19.Bellapart J, Fraser JF. Transcranial Doppler assessment of cerebral autoregulation. Ultrasound in Medicine & Biology. 2009 doi: 10.1016/j.ultrasmedbio.2009.01.005. [DOI] [PubMed] [Google Scholar]
- 20.Panerai RB, Dawson SL, Potter JF. Linear and nonlinear analysis of human dynamic cerebral autoregulation. Am. J. Physiol. 1999;277:H1089–H1099. doi: 10.1152/ajpheart.1999.277.3.H1089. [DOI] [PubMed] [Google Scholar]
- 21.Panerai RB, Simpson DM, Deverson ST, Mahony P, Hayes P, Evans DH. Multivariate dynamic analysis of cerebral blood flow regulation in humans. IEEE Trans Biomed. Eng. 2000;47:419–423. doi: 10.1109/10.827312. [DOI] [PubMed] [Google Scholar]
- 22.Panerai RB. Cerebral autoregulation: from models to clinical applications. Cardiovasc Eng. 2008;8:42–59. doi: 10.1007/s10558-007-9044-6. [DOI] [PubMed] [Google Scholar]
- 23.van Beek AH, Claassen JA, Rikkert MG, Jansen RW. Cerebral autoregulation: overview of current concepts and methodology with special focus on the elderly. J Cereb Blood Flow Metab. 2008;28:1071–1085. doi: 10.1038/jcbfm.2008.13. [DOI] [PubMed] [Google Scholar]
- 24.Zhang R, Zuckerman JH, Giller CA, Levine BD. Transfer function analysis of dynamic cerebral autoregulation in humans. Am. J. Physiol. 1998;274:233–241. doi: 10.1152/ajpheart.1998.274.1.h233. [DOI] [PubMed] [Google Scholar]
- 25.Zhang R, Zuckerman JH, Iwasaki K, Wilson TE, Crandall CG, Levine BD. Autonomic neural control of dynamic cerebral autoregulation in humans. Circulation. 2002;106:1814–1820. doi: 10.1161/01.cir.0000031798.07790.fe. [DOI] [PubMed] [Google Scholar]
- 26.Mitsis GD, Zhang R, Levine BD, Marmarelis VZ. Modeling of nonlinear physiological systems with fast and slow dynamics II: Application to cerebral autoregulation. Ann. Biomed. Eng. 2002;30:555–565. doi: 10.1114/1.1477448. [DOI] [PubMed] [Google Scholar]
- 27.Mitsis GD, Poulin MJ, Robbins PA, Marmarelis VZ. Nonlinear modeling of the dynamic effects of arterial pressure and CO2 variations on cerebral blood flow in healthy humans. IEEE Trans. on Biomedical Eng. 2004;51:1932–1943. doi: 10.1109/TBME.2004.834272. [DOI] [PubMed] [Google Scholar]
- 28.Mitsis GD, Zhang R, Levine BD, Marmarelis VZ. Cerebral hemodynamics during orthostatic stress assessed by nonlinear modeling. J. Appl. Physiol. 2006;101:354–366. doi: 10.1152/japplphysiol.00548.2005. [DOI] [PubMed] [Google Scholar]
- 29.Mitsis GD, Zhang R, Levine BD, Tzanalaridou E, Katritsis DG, Marmarelis VZ. Nonlinear analysis of autonomic control of cerebral hemodynamics. IEEE Eng. in Medicine & Biology. 2009;28:54–62. doi: 10.1109/MEMB.2009.934908. [DOI] [PMC free article] [PubMed] [Google Scholar]
- 30.van Beek AH, Lagro J, Olde-Rikkert MG, Zhang R, Claassen JA. Oscillations in cerebral blood flow and cortical oxygenation in Alzheimer's disease. Neurobiol Aging. 2012;33(2):428, e21–e31. doi: 10.1016/j.neurobiolaging.2010.11.016. [DOI] [PubMed] [Google Scholar]
- 31.Kiyoshi N, Kazama K, Younkin L, Younkin SG, Carlson GA, Iadecola C. Cerebrovascular autoregulation is profoundly impaired in mice overexpressing amyloid precursor protein. Am J Physiol Heart Circ Physiol. 2002;283:H315–H323. doi: 10.1152/ajpheart.00022.2002. [DOI] [PubMed] [Google Scholar]
- 32.Claassen JA, Diaz-Arrastia R, Martin-Cook K, Levine BD, Zhang R. Altered cerebral hemodynamics in early Alzheimer disease: a pilot study using transcranial Doppler. J Alzheimers Dis. 2009;17(3):621–629. doi: 10.3233/JAD-2009-1079. [DOI] [PMC free article] [PubMed] [Google Scholar]
- 33.Claassen JA, Zhang R. Cerebral autoregulation in Alzheimer's disease. J Cereb Blood Flow Metab. 2011;31(7):1572–1577. doi: 10.1038/jcbfm.2011.69. [DOI] [PMC free article] [PubMed] [Google Scholar]
- 34.Marmarelis VZ, Shin DC, Zhang R. Linear and nonlinear modeling of cerebral flow autoregulation using Principal Dynamic Modes. Open Biomedical Eng. Journal. 2012;6:42–55. doi: 10.2174/1874230001206010042. 2012. [DOI] [PMC free article] [PubMed] [Google Scholar]
- 35.Marmarelis VZ, Shin DC, Orme ME, Zhang R. Closed-loop dynamic modeling of cerebral hemodynamics. Ann. Biomed. Eng. (in press) doi: 10.1007/s10439-012-0736-8. [DOI] [PMC free article] [PubMed] [Google Scholar]
- 36.Marmarelis VZ, Shin DC, Orme ME, Diaz-Arrastia R, Zhang R. Model-based quantification of cerebral vasomotor reactivity and its use for improved diagnosis of Alzheimer's disease and MCI. Proc. 34th Intern. IEEE-EMBS Conf.; San Diego. 2012. Paper 431. [Google Scholar]
- 37.Marmarelis VZ. Modeling methodology for nonlinear physiological systems. Ann. Biomed. Eng. 1997;25:239–251. doi: 10.1007/BF02648038. [DOI] [PubMed] [Google Scholar]
- 38.Marmarelis VZ. Nonlinear Dynamic Modeling of Physiological Systems. Wiley-Interscience & IEEE Press; 2004. [Google Scholar]
- 39.Marmarelis VZ. Identification of nonlinear biological systems using Laguerre expansions of kernels. Ann. Biomed. Eng. 1993;21:573–589. doi: 10.1007/BF02368639. 1993. [DOI] [PubMed] [Google Scholar]
- 40.Al C, Ngai AC, HR Winn. Modulation of cerebral arteriolar diameter by intraluminal flow and pressure. Circulation Research. 1995;77:832–840. doi: 10.1161/01.res.77.4.832. [DOI] [PubMed] [Google Scholar]
- 41.Bryan RM, Marrelli SP, Steenberg ML, Schildmeyer LA, Johnson TD. Effects of luminal shear stress on cerebral arteries and arterioles. Am. J. Physiol. Heart Circ. Physiol. 2001;280:H2011–H2022. doi: 10.1152/ajpheart.2001.280.5.H2011. [DOI] [PubMed] [Google Scholar]
- 42.Marmarelis PZ, Marmarelis VZ. Analysis of Physiological Systems: The White-Noise Approach. Plenum, New York: 1978. Russian translation, Mir Press, Moscow, 1981; Chinese translation, Academy of Sciences Press, Beijing, 1990. [Google Scholar]


