Abstract
Significant research effort has been expended on investigating methods to non-invasively characterize gastrointestinal electrical activity. Despite the clinical success of the 12-lead electrocardiograms (ECG) and the emerging success of inverse methods for characterizing electrical activity of the heart and brain, similar methods have not been successfully transferred to the gastrointestinal field.
The normal human stomach generates rhythmic electrical impulses, known as slow waves, that propagate within the stomach at a frequency of 3 cycles per minute. Disturbances in this activity are known to result in disorders in the motility patterns of the stomach. However, there is still limited understanding regarding the basic characteristics of the electrical propagation in the stomach. Contrary to existing beliefs, recent results from high resolution recordings of gastric electrical activity have shown that multiple waves, complete with depolarization and repolarization fronts, can be simultaneously present at any given time in the human stomach. In addition, it has been shown that there are marked variations in the amplitude and velocities in different regions in the stomach. In human recordings, the antrum had slow waves with significantly higher amplitudes and velocities than the corpus.
Due to the presence of multiple slow wave events, single and multiple dipole-type inverse methods are not appropriate and distributed source models must therefore be considered. Furthermore, gastric electrical waves move significantly slower than electrical waves in the heart, and it is currently difficult to obtain structural images of the stomach at the same time as surface electrical or magnetic gastric recordings are made. This further complicates the application of inverse procedures for gastric electrical imaging.
I. INTRODUCTION
The stomach generates rhythmic electrical impulses, known as slow waves, that initiate mechanical contractions. Slow wave dysrhythmias are believed to contribute to dysmotility symptoms such as gastroparesis [6]. The ability to non-invasively characterize this slow wave activity would be clinically beneficial to guide new diagnostic and therapeutic strategies.
Gastric slow waves can be non-invasively detected using cutaneous electrodes on the body surface, giving rise to what has been termed the electrogastrogram (EGG). The corresponding magnetic fields have also been measured external to the body in what is known as a magnetogastrogram (MGG) [3]. Despite the wide spread clinical acceptance of the standard 12-lead electrocardiogram (ECG), to date, the use of EGGs and MGGs has largely been restricted to research studies. In the cardiac field the ECG can be used to draw direct relationships between the signals measured noninvasively and the underlying events that are occurring in the myocardium. This clinical assessment is essentially the solution to a simple ‘inverse problem’. In addition, the use of inverse techniques to non-invasively characterize cardiac electrical activity is a fruitful research field beginning to gain clinical acceptance [7], [13]. The use of inverse techniques to image electrical activity within the brain is also progressing [10]. However, to date, only a few studies have attempted to use inverse methods to characterize gastric electrical activity, and all have met with limited success [1], [8], [4].
It is commonly agreed that humans have a normal slow wave frequency of approximately 3 cpm (cycles per minute) [15], [12]. The slow wave is believed to initiate on the greater curvature in the corpus region and propagates towards the pylorus with increasing velocity and amplitude [14]. However, until recently, the description of gastric slow wave activity has largely been based upon in vitro isolated muscle strips or sparse electrode recordings on the stomach (~4 sites) [15], [14]. By contrast, cardiac electrophysiology studies now routinely make use of high-resolution electrode platforms (employing 10s to 100s of electrodes) [5]. Recently, the adaptation of the high resolution mapping technologies to study the stomach has allowed more accurate descriptions of gastric slow wave activity [16], [9], [17].
It has traditionally been assumed that the gastric slow wave reaches the terminal antrum just as the next wave begins in the proximal stomach [11], [12]. As a result of this view, the majority of numerical simulations used to simulate slow wave activity and to calculate the resultant far field bioelectromagnetic fields have used a single dipole or a single band of dipoles to represent each slow wave cycle [11], [2]. However, recent experimental measurements in animal models have shown the presence of multiple simultaneous waves in the stomach. For example, one canine study has shown the presence of 3–5 waves in the stomach at one time [17].
In this study we present multi-electrode serosal measurements from human subjects during open-abdominal surgery. Slow wave characteristics such as velocity, amplitude and frequency were calculated. Using these tools, multiple active slow waves and marked regional variations in slow wave characteristics have now been revealed in the human stomach. We discuss the implications of these findings upon inverse methods that may be used in an attempt to noninvasively characterize gastric slow wave activity.
II. METHODS
Gastric slow wave activity was obtained from human subjects undergoing open-abdominal surgery for non-gastric disorders. Signals were acquired for approximately 15 minutes at the commencement of the surgery. Ethical approval and informed consent was obtained for all subjects.
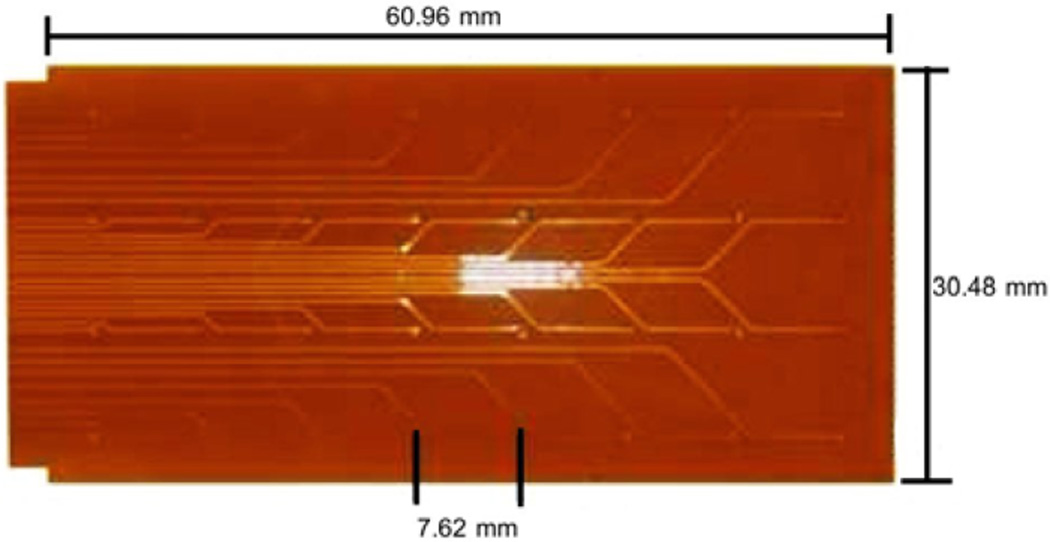
Custom designed flexible printed circuit board (PCB) electrodes [9] were used to record serosal electrical activity. Each PCB platform (see Fig. 1) consisted of an array of 4×8 electrodes with an inter-electrode spacing of 7.62 mm. Up to 6 PCB electrodes (192 electrodes with an area of 96 cm2) were tessellated over the anterior gastric serosa. The PCB electrodes were held in place with warm saline soaked gauze packs. Electrical activity was acquired using an optically isolated ActiveTwo mapping system (Biosemi, The Netherlands).
Fig. 1.
Flexible printed circuit board electrode platform. The platform has 32 electrodes arranged in a 8×4 configuration. Multiple platforms can be tessellated together allowing activity from larger areas to be mapped.
Signals were filtered using a Butterworth low pass 10 Hz filter. Analysis was conducted on 2–3 minute recording periods deemed to be free from artifacts. Activation times from a sequence of 3–4 slow waves were manually defined. The criteria used was a point of sudden negative deflection in the signal with an appropriate lag in time between neighboring electrodes indicating a propagating wave front. From these activation times isochrones at 2 s intervals were used to determine patterns of propagation. Due to the fine spatial resolution of the HR maps, regional variations in the amplitude and velocity were able to be quantified.
III. RESULTS
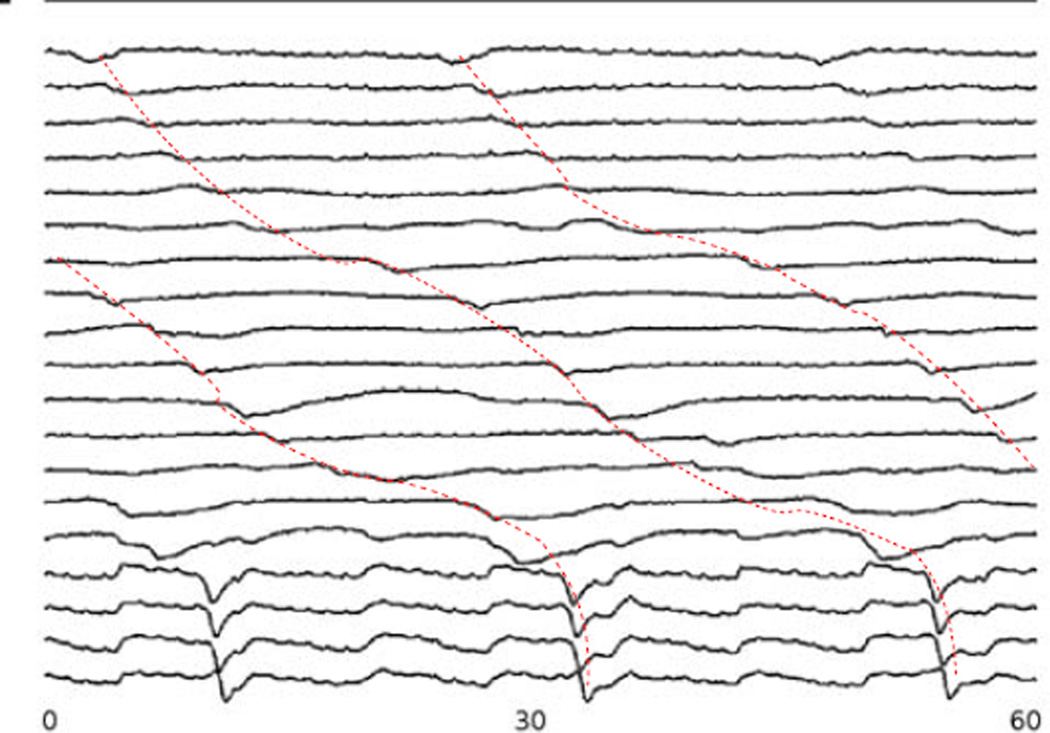
Recordings were obtained from 3 subjects undergoing open-abdominal surgery. The PCB platforms covered approximately one-third of the anterior surface of the stomach. Serosal electrograms recorded from one set of PCB electrodes are shown in Fig. 2. The signals showed consistent propagation down the longitudinal axis of the stomach (dotted lines). However, there were distinct differences between the corpus and antrum of the stomach. A marked increase in propagation velocity was seen in signals obtained from the antrum (corresponding to the lower 4 signals in Fig. 2).
Fig. 2.
Signals from gastric serosal recordings for a period of 60 s. The signals show propagation down the longitudinal axis of the stomach (as indicated by the dotted red line) as well as the presence of 2–3 simultaneous waves at a given instance in time. Locations of the electrodes are shown in Fig. 3 via the marked electrodes along with the activation pattern of one slow wave.
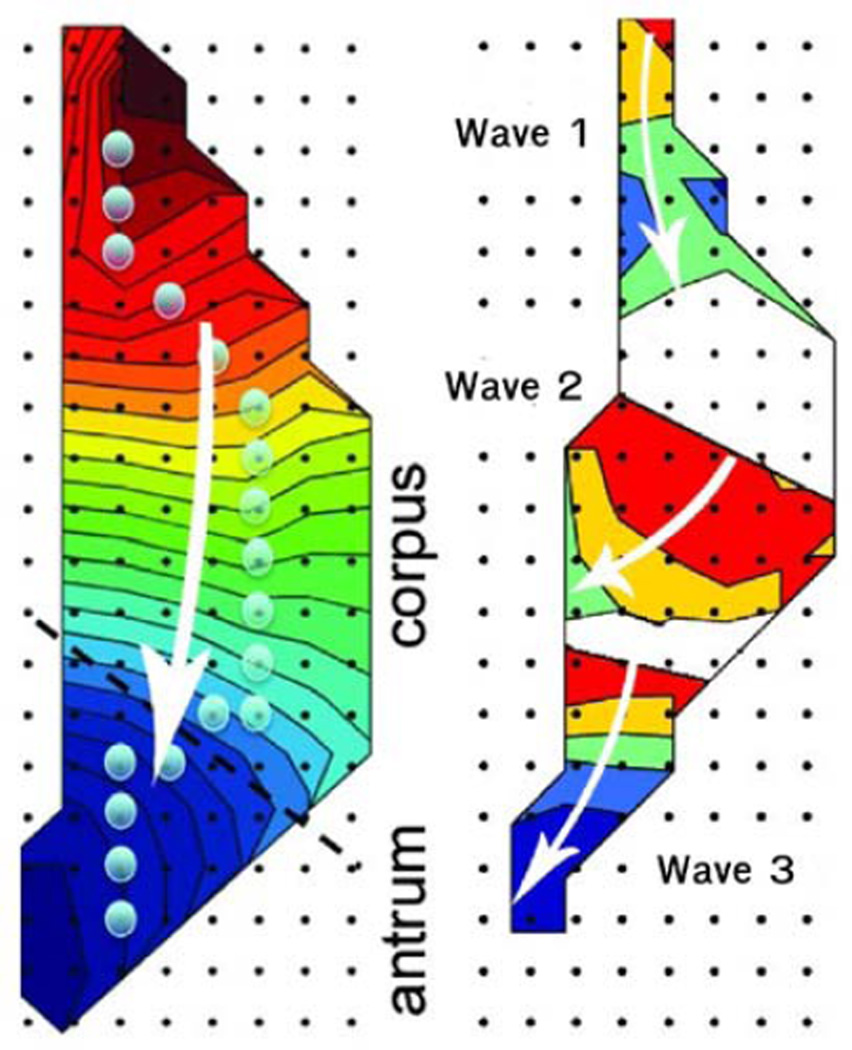
Spatial mapping of the activation patterns (isochrones of 2 s intervals) of one slow wave showed consistent aboral propagation (Fig. 3 left). In this figure, the white arrow shows the direction of the propagation and the proximity of the contours provides an indication of velocity. By mapping the activity at one point in time (Fig. 3 right) the presence of three waves can be seen in the mapped region. At all times, 2–3 distinct slow waves were found to be simultaneously active along the longitudinal axis of the stomach within the mapped region.
Fig. 3.
Spatial maps of the slow wave as measured by the PCB electrodes. Shown is (left) an activation profile for a single wave and (right) the relative position of 3 simultaneous waves in the stomach. The white arrows illustrate the direction of the slow wave propagation. Each contour line shows the propagation over 2 s and the proximity of the contour lines give an indication of velocity. Regions with no contours correspond to areas where the electrodes recorded no activity.
The slow wave frequencies, amplitudes and velocities for different regions of the stomach are summarized in Tab. I). HR recordings revealed a consistent slow wave frequency of approximately 2.8 cpm over the entire stomach (p=0.4). However, amplitude and velocity were significantly different in the corpus and antral regions. The amplitude of the signals in the antrum was approximately double the size of the corpus (1.0 vs. 0.4 mV) (p < 0.001) while the velocity in the antrum was significantly greater than the corpus (7.4 vs. 2.8 mm.s−1) (p < 0.001).
TABLE I.
Slow Wave Characteristics From HR Recordings
| Corpus | Antrum | |
|---|---|---|
| Frequency (cpm) | 2.83 ± 0.15 | 2.85 ± 0.18 |
| Amplitude (mV) | 0.30 ± 0.01 | 0.75 ± 0.22 |
| Velocity (mm.s−1) | 2.8 ± 0.1 | 7.4 ± 1.1 |
IV. DISCUSSION AND FUTURE WORK
A. Discussion
While studies conducted in vitro using tissues isolated from the stomach provide useful information about the characteristics of gastric slow wave activity, they have been shown not to provide an accurate representation of in vivo activity of the whole stomach [19]. In the past, many in vivo studies have used a small number of sparse electrodes, providing insufficient spatial details of slow waves. As a result, to date, regional variations in the slow wave characteristics have not been accurately defined.
The use of high resolution (HR) mapping improves on existing methods and allows a more accurate description of slow wave activity in the intact organ. The HR electrodes, although limited to the invasive setting of open-abdominal surgery, provide an accurate and detailed description of slow wave propagation. Results presented here demonstrate the presence of multiple simultaneous slow wave events as well as significant regional variations in the gastric slow wave activity.
The ability to successfully apply inverse methods to characterize gastric slow wave activity faces a number of challenges. To date, the underlying activity in the stomach has been insufficiently understood and simple source methods (e.g., dipoles) were applied in situations where they were not ideally suited. Our new knowledge of gastric slow wave activity illustrates the significant challenges one faces when attempting to apply inverse methods. As the velocity of gastric slow wave activity is significantly slower than cardiac electrical activity the depolarization and repolarization fronts are simultaneously present in the musculature. Furthermore, the use of HR mapping has shown that multiple gastric slow waves are simultaneously present in the musculature. The mapped region in Fig. 3 shows the presence of 3 simultaneous waves. This corresponds to 3 depolarization and 3 repolarization fronts, or at least 6 distinct ‘sources’. As a result, EGG and MGG recordings cannot be directly related back to a single slow wave event (as has traditionally been done with cardiac ECGs). In addition, the choice of a single dipole source as used in the few gastric inverse studies published to date, may not provide an accurate presentation of the true underlying electrical events [1], [8], [4]. Distributed source models, capable of representing multiple wave fronts, must therefore be considered. To reliably apply such models, accurate geometry of the models are also required. At present, it is difficult to obtain structural images of the stomach at the same time as surface electrical or magnetic gastric recordings are made.
B. Future Work
Additional studies using HR mapping in both humans and animal models need to be conducted to confirm and more accurately quantify the regional variations in gastric slow wave characteristics. The use of less invasive measurements such as laparoscopic and new endoscopic devices is anticipated to assist with obtaining recordings from human subjects [18]. Due to the presence of multiple slow waves in the stomach, detailed mathematical models will be necessary to fully understand the relationship between the slow wave activity and far-field measurements. It may be necessary to simply correlate certain key features (e.g., frequencies and patterns) of the measured EGG and MGG signals with known electrical disturbances in the stomach rather than attempt to use model-based inverse methods as has been previously investigated in the cardiac field.
ACKNOWLEDGMENTS
The authors gratefully acknowledge the discussions with Prof. L. Alan Bradshaw from Vanderbilt University.
This work was supported in part by grants from the NIH (R01 DK64775), NZ Health Research Council, NZ Society of Gastroenterology and a University of Auckland Doctoral Scholarship.
Contributor Information
Leo K. Cheng, Email: l.cheng@auckland.ac.nz, Auckland Bioengineering Institute, The University of Auckland, New Zealand.
Greg O’Grady, Email: gog@ps.gen.nz, Auckland Bioengineering Institute and the Department of Surgery, The University of Auckland, New Zealand.
Peng Du, Email: peng.du@auckland.ac.nz, Auckland Bioengineering Institute, The University of Auckland, New Zealand.
John U. Egbuji, Email: j.egbuji@auckland.ac.nz, Auckland Bioengineering Institute and the Department of Surgery, The University of Auckland, New Zealand.
John A. Windsor, Email: j.windsor@auckland.ac.nz, Department of Surgery, The University of Auckland, New Zealand.
Andrew J. Pullan, Email: a.pullan@auckland.ac.nz, Department of Engineering Science and the Auckland Bioengineering Institute, Auckland, New Zealand and with the Department of Surgery, Vanderbilt University, Nashville, TN, USA.
References
- 1.Allescher HD, Abraham-Fuchs K, Dunkel RE, Classen M. Biomagnetic 3-dimensional spatial and temporal characterization of electrical activity of human stomach. Dig Dis Sci. 1998 Apr;43(4):683–693. doi: 10.1023/a:1018852208687. [DOI] [PubMed] [Google Scholar]
- 2.Bradshaw LA, Myers A, Wikswo JP, Richards WO. A spatio-temporal dipole simulation of gastrointestinal magnetic fields. IEEE Trans Biomed Eng. 2003 Jul;50(7):836–847. doi: 10.1109/TBME.2003.813549. [DOI] [PubMed] [Google Scholar]
- 3.Bradshaw LA, Irimia A, Sims JA, Gallucci MR, Palmer RL, Richards WO. Biomagnetic characterization of spatiotemporal parameters of the gastric slow wave. Neurogastroenterol Motil. 2006 Aug;18(8):619–631. doi: 10.1111/j.1365-2982.2006.00794.x. [DOI] [PubMed] [Google Scholar]
- 4.Bradshaw LA, Cheng LK, Richards WO, Pullan AJ. Surface current density mapping for identification of gastric slow wave propagation. IEEE Trans Biomed Eng. 2009 Aug;56(8):2131–2139. doi: 10.1109/TBME.2009.2021576. [DOI] [PMC free article] [PubMed] [Google Scholar]
- 5.Chen PS, Cha YM, Peters BB, Chen LS. Effects of myocardial fiber orientation on the electrical induction of ventricular fibrillation. Am. J. Physiol. 1993;264:H1760–H1773. doi: 10.1152/ajpheart.1993.264.6.H1760. [DOI] [PubMed] [Google Scholar]
- 6.Chen JD, Schirmer BD, McCallum RW. Serosal and cutaneous recordings of gastric myoelectrical activity in patients with gastroparesis. Am. J. Physiol. 1994;266:G90–G98. doi: 10.1152/ajpgi.1994.266.1.G90. [DOI] [PubMed] [Google Scholar]
- 7.Cheng LK, Sands GB, French RL, Withy SJ, Wong SP, Legget ME, Smith WM, Pullan AJ. Rapid construction of a patient-specific torso model from 3D ultrasound for non-invasive imaging of cardiac electrophysiology. Med Biol Eng Comput. 2005 May;43(3):325–330. doi: 10.1007/BF02345808. [DOI] [PubMed] [Google Scholar]
- 8.Cheng LK, Buist ML, Richards WO, Bradshaw LA, Pullan AJ. Noninvasive localization of gastric electrical activity. Int. J. Bioelectromagnetism. 2005;7:1–4. [Google Scholar]
- 9.Du P, O’Grady G, Egbuji JU, Lammers WJ, Budgett D, Nielsen P, Windsor JA, Pullan AJ, Cheng LK. High-resolution mapping of in vivo gastrointestinal slow wave activity using flexible printed circuit board electrodes: methodology and validation. Ann Biomed Eng. 2009 Apr;37(4):839–846. doi: 10.1007/s10439-009-9654-9. [DOI] [PMC free article] [PubMed] [Google Scholar]
- 10.Ebersole JS. New applications of EEG/MEG in epilepsy evaluation. Epilepsy Res Suppl. 1996;2005;11:227–237. [PubMed] [Google Scholar]
- 11.Familoni BO, Abell TL, Bowes KL. A model of gastric electrical activity in health and disease. IEEE Trans Biomed Eng. 1995;42:647–657. doi: 10.1109/10.391163. [DOI] [PubMed] [Google Scholar]
- 12.Koch KL, Stern RM, editors. Handbook of Electrogastrography. New York: Oxford University Press; 2004. [Google Scholar]
- 13.Ghosh S, Rhee EK, Avari JN, Woodard PK, Rudy Y. Cardiac memory in patients with Wolff-Parkinson-White syndrome: noninvasive imaging of activation and repolarization before and after catheter ablation. Circulation. 2008;118:907–915. doi: 10.1161/CIRCULATIONAHA.108.781658. [DOI] [PMC free article] [PubMed] [Google Scholar]
- 14.Kelly KA, Code CF. Canine gastric pacemaker. Am J Physiol. 1971 Jan;220(1):112–118. doi: 10.1152/ajplegacy.1971.220.1.112. [DOI] [PubMed] [Google Scholar]
- 15.Kwong NK, Brown BH, Whittaker GE, Duthie HL. Electrical activity of the gastric antrum in man. Br J Surg. 1970;57:913–916. doi: 10.1002/bjs.1800571211. [DOI] [PubMed] [Google Scholar]
- 16.Lammers WJ, Stephen B, Slack JR, Dhanasekaran S. Anisotropic propagation in the small intestine. Neurogastroenterol Motil. 2002 Aug;14(4):357–364. doi: 10.1046/j.1365-2982.2002.00340.x. [DOI] [PubMed] [Google Scholar]
- 17.Lammers WJ, Ver Donck L, Stephen B, Smets D, Schuurkes JA. Origin and propagation of the slow wave in the canine stomach: the outlines of a gastric conduction system. Am J Physiol Gastrointest Liver Physiol. 2009 Jun;296(6):G1200–G1210. doi: 10.1152/ajpgi.90581.2008. [DOI] [PubMed] [Google Scholar]
- 18.O’Grady G, Du P, Egbuji JU, Lammers WJ, Wahab A, Pullan AJ, Cheng LK, Windsor JA. A novel laparoscopic device for the measurement of gastrointestinal slow-wave activity. Surg Endosc. 2009 Dec;23(12):2842–2848. doi: 10.1007/s00464-009-0515-2. [DOI] [PMC free article] [PubMed] [Google Scholar]
- 19.Yin J, Chen JD. Roles of interstitial cells of Cajal in regulating gastrointestinal motility: in vitro versus in vivo studies. J. Cell Mol. Med. 2008;12:1118–1129. doi: 10.1111/j.1582-4934.2008.00352.x. [DOI] [PMC free article] [PubMed] [Google Scholar]


