

ABSTRACT
Changes in the CD-1 mouse uterine transcriptome during proestrus and estrus were investigated to help elucidate mechanisms of uterine tissue remodeling during the estrus cycle and their regulation by estrogen and progesterone in preparation of the uterus for pregnancy. Mice were staged beginning at 6 weeks of age, and uterine horns were harvested after monitoring two estrus cycles. Microarray analysis of whole uterine horn RNA identified 2428 genes differentially expressed in estrus compared to proestrus, indicating there is extensive remodeling of mouse uterus during the estrus cycle, affecting ∼10% of all protein-encoding genes. Many (∼50%) of these genes showed the same differential expression in independent analyses of isolated uterine lumenal epithelial cells. Changes in gene expression associated with structural alterations of the uterus included remodeling of the extracellular matrix, changes in cell keratins and adhesion molecules, activation of mitosis and changes in major histocompatibility complex class II (MHCII) presentation, complement and coagulation cascades, and cytochrome P450 expression. Signaling pathways regulated during the estrus cycle, involving ligand-gated channels, Wnt and hedgehog signaling, and transcription factors with poorly understood roles in reproductive tissues, included several genes and gene networks that have been implicated in pathological states. Many of the molecular pathways and biological functions represented by the genes differentially expressed from proestrus to estrus are also altered during the human menstrual cycle, although not necessarily at the corresponding phases of the cycle. These findings establish a baseline for further studies in the mouse model to dissect mechanisms involved in uterine tissue response to endocrine disruptors and the development of reproductive tract diseases.
Keywords: endometrium, estrus, mouse gene expression, proestrus, transcriptome, uterus
Around 10% of genes are regulated in proestrus/estrus in mouse uterus including genes responsible for remodeling of the extracellular matrix, for mitosis, for Wnt and hedgehog signaling, for the coagulation cascade as well as keratins, adhesion molecules, complement, and P450s.
INTRODUCTION
The uterus undergoes profound remodeling during the course of the menstrual and estrus cycles [1]. This remodeling may be disrupted by hormonal imbalances, pathogen exposure, and environmental stresses, including exposure to environmental estrogens early in life, leading to the development of disease. Thus, it is important to elucidate endogenous hormone-regulated gene expression pathways associated with uterine tissue remodeling during the menstrual/estrus cycle. Transcriptomic profiles have been characterized in normal human endometrium in relation to endometrial receptivity, focusing on the “window of implantation,” which begins on Day 19 or 20 of the menstrual cycle and lasts 4–5 days [2]. Phase-specific changes in endometrial gene expression affect apoptosis, inflammation, signal transduction, transcription, and DNA repair [3–5]. In addition, the expression of metalloproteinases (MMPs) increases toward the late-secretory phase [4] and decreases in the late proliferative phase [5]. The proliferative phase affects cellular proliferation and differentiation, extracellular matrix remodeling, angiogenesis, and vasculogenesis [5, 6]. Genes related to adhesion and ion channels are also highly expressed at this phase [5].
The mouse uterus is widely used as a model for the study of steroid hormone signaling, reproductive toxicology, endometriosis, uterine cancer, and the molecular mechanisms of implantation. The uterus undergoes many hormone-driven morphological and functional changes during the estrus cycle (rodents) and menstrual cycle (humans) in preparation for embryo implantation. The murine estrus cycle lasts 4–5 days and includes four distinct stages, diestrus, proestrus, estrus, and metaestrus, with ovulation and mating receptivity occurring in estrus. Estrogen peaked at approximately 1100 h on the day of proestrus, followed later that evening by a surge in progesterone, luteinizing hormone (LH), and follicle-stimulating hormone (FSH). Ovulation occurred at ∼0400 h during estrus on the next day [7]. Major changes in uterine gene expression may occur during the estrus cycle; however, our current knowledge of these changes is limited. The most complete assessment identified 61 mouse genes showing differential expression in estrus compared to diestrus, including several immune function, proteinase, and cell cycle genes [6]. Other studies examined changes in the expression of individual genes during the estrus cycle [8–12], including circadian clock genes [10] and genes associated with implantation [8].
Here we characterized on a global scale changes in the mouse uterine transcriptome during estrus and proestrus. We identified large numbers of differentially regulated genes that gave novel biological insight into the functional and morphological changes that occur in the cycling mouse uterus. We found that many of the changes of molecular pathways and biological functions that characterize the transition from proestrus to estrus are also altered during human menstrual cycle, although not necessarily at the corresponding phases of the cycle. These findings are expected to enhance the utility of mouse uterus as a model of human reproductive health and disease and will serve as an important resource for future investigations of uterine tissue physiology, as well as the pathophysiological effects associated with environmental stressors, pathogens, and hormonal disruptors associated with the development of reproductive dysfunction.
MATERIALS AND METHODS
Animals and Tissues
All animal studies were performed using approved institutional protocols and federal guidelines. CD-1 mice were purchased from Charles River Laboratories (Wilmington, MA) and bred in the Boston University Laboratory for Animal Care facility. Mice were maintained in polysulfone cages and fed a low phytoestrogen diet (Teklad 2920x; Harlan Laboratories, Indianapolis, IN) and spring water (Poland Springs, Poland, ME) throughout the study. Dams were allowed to deliver naturally, and pups were weaned and separated by sex on Postnatal Day 21, where Postnatal Day 1 indicates the day of birth. Starting on Postnatal Day 42, female offspring were monitored for reproductive stage cycle for two consecutive cycles, as follows: every morning between 800 and 1000 h, a flat small spatula was used to gently swipe the inner edge of the vaginal opening. The tissue swipe was smeared on to a glass slide, sprayed with a cytology spray fixative (Safetex; Andwin Scientific; Woodland Hills, CA), and stained with the Papanicolaou staining system (Accustain Papanicolaou staining system; procedure no. HT40; Sigma Aldrich Corp., St. Louis, MO). Estrus cycle stages were determined based on vaginal cytology [13]. Mice were euthanized by cervical dislocation between 1300 and 1600 h on the day of proestrus or estrus, and uterine horns were collected. Uterine horn swelling intrinsic to proestrus was used as an additional indicator to validate estrus cycle stage assignments at the time of dissection. Uterine horns were homogenized in Trizol reagent (Ambion, Carlsbad, CA) and frozen at −80°C prior to RNA isolation. To validate our observations of transcriptome changes in the whole uterine horns during the transition from proestrus to estrus, we analyzed gene expression changes in lumenal epithelium of uterine horns. Epithelial cells were isolated by enzymatic digestion as described previously [14] with modifications. Briefly, uterine horns from 3–5 mice at the same stage of estrus cycle were slit lengthwise and incubated in 3 ml of 1% trypsin (Sigma) in sterile Hanks balanced salt solution without Ca2+, Mg2+, and phenol red (Gibco; Life Technologies, Grand Island, NY) for 1 h at 37°C. After vortexing for 10 sec at no. 5 setting, the supernatant was collected and centrifuged for 10 min at 3000 × g. The cell pellet was resuspended in TRIzol reagent and frozen at −80°C.
RNA Isolation and Microarray Analysis
RNA was isolated using TRIzol reagent and quantified using a NanoDrop 1000 instrument (Thermo Fisher Scientific, Wilmington, DE). RNA quality was assessed using a Bioanalyzer (Agilent Technologies, Santa Clara, CA). All samples had RNA integrity values >8.0. Samples were pooled for microarray analysis to give an average expression of genes in proestrus or estrus across individuals and litters, as follows. Six litters were used to generate two pools of whole uterine tissue for estrus and two pools of whole uterine tissue for proestrus, in which estrus pool 1 and proestrus pool 1 consisted of mice from the same three litters and estrus pool 2 and proestrus pool 2 consisted of mice from the other three litters. Each pool was composed of whole uterine tissue RNA from n = 4–6 individual mice. Seven litters were used to generate two pools of uterine lumenal epithelial cells at estrus and two pools of uterine lumenal epithelial cells at proestrus. Each pool consisted of lumenal epithelial RNA isolated from n = 4–5 individual mice and n = 3–4 individual litters.
Labeling, hybridization, scanning, and initial microarray analysis were conducted at the Wayne State University Microarray facility as detailed elsewhere [15]. Briefly, Alexa 555 and Alexa 647 dyes were used for labeling, and samples were hybridized with whole mouse microarrays (mouse array platform GE 4x44K version 2, catalog no. G4846A; platform GPL10333; Agilent). A dye swap was included for each estrus cycle stage comparison. Linear and locally weighted scatter plot smoothing (LOWESS) normalization were performed for each microarray using Feature Extraction software (Agilent). Feature Extraction analysis also calculates the variation of pixel intensity for each feature (spot) on the array. These error measurements were input to the Rosetta error model, which provides a gene-specific estimate of error by incorporating two elements, a technology-specific estimate of error and an error estimate derived from replicate arrays [16]. The technology-specific component uses an intensity-dependent model of error derived from numerous self-self hybridizations. By including the technology-specific estimate, the Rosetta error model minimizes false positives that result from underestimation of error when a small number of replicate arrays are available, thus increasing the statistical power. For two-color microarrays, the Rosetta error model derives a log-ratio error estimate from the individual error estimates of each sample (color) used in the co-hybridization. Then, for each feature, an average log ratio and associated P value are obtained from replicate measurements (arrays) using the Rosetta error model error-weighted averaging method. The average ratio is then calculated by weighting the ratio from each sample inversely proportional to the variance of that sample. This produces an averaged ratio with the smallest possible error. Validation with spike-in experiments has demonstrated that the Rosetta error model has superior accuracy in detecting and quantifying relative gene expression compared to other statistical methods commonly used in microarray analysis [17]. Direct experimental validation is provided in the present study for 14 differentially regulated genes, where quantitative PCR (qPCR) analysis of n = 8–11 individuals per group gave results fully consistent with those obtained by microarray analysis (Table 1, Fig. 1, Supplemental Fig. S1; all Supplemental Data are available online at www.biolreprod.org). Genes meeting the following criteria were considered differentially regulated between estrus and proestrus: absolute fold-change (|fold-change|) >2, P < 0.005, and “well above background” in both arrays for estrus (in the case of estrus upregulated genes) or proestrus (in the case of proestrus upregulated genes) or both, as specified in the Feature Extraction files (Agilent). Duplicate (redundant) microarray probes were identified and removed as described previously [15]. The complete list of regulated genes are provided in Supplemental Tables S1 and S2. The number of genes showing >2-fold differential expression was 2966 in whole uterine horns and 2950 in lumenal epithelium. Thus, the number of genes expected to meet the >2-fold change criteria and the significance threshold of P < 0.005 by chance was 0.005 × 2966 genes for whole uterine horn microarrays and 0.005 × 2950 genes for lumenal epithelium microarrays or approximately 15 genes in each set. The actual number of genes that met these fold change and P value thresholds was 2428 in whole uterine horns and 2251 in lumenal epithelium, corresponding to apparent false discovery rates (FDR) of 15/2428 = 0.62% and 15/2,251 = 0.67%, respectively. Microarray data are available for download from the Gene Expression Omnibus website (www.ncbi.nlm.nih.gov/geo/) as series GSE43064 and GSE46814.
TABLE 1.
qPCR validation of microarray data for whole uterine tissue: estrus:proestrus expression ratios.
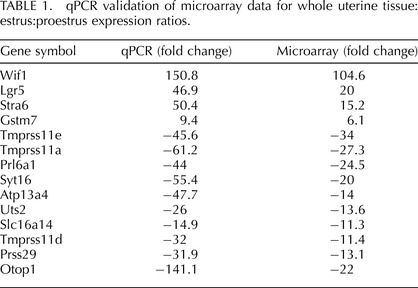
FIG. 1.
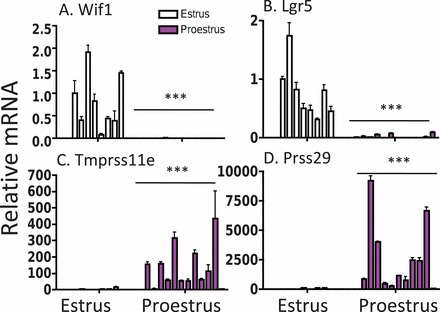
Examples of qPCR validation of genes up-regulated in estrus (A, B) or down-regulated in estrus (C, D) relative to proestrus in individuals used to construct microarray pools. Each bar represents uterine tissue from an individual mouse, with the data displayed as means ± SD for three repeated quantifications of RNA extracted from an individual uterus. The sets of all estrus (n = 8) and proestrus (n = 12) individuals were compared using a t-test; *** P < 0.001.
Validation by qPCR
Total RNA extracted from uterine horns of individual mice was treated with RQ1 DNase (Promega, Madison, WI) and reverse transcribed using a high capacity cDNA reverse transcription kit (Applied Biosystems, Foster City, CA). Primers were designed using Primer Express version 2.0 (Applied Biosystems) and are listed in Supplemental Table S3. Triplicate 5-μl real-time PCR mixtures, each containing Power SYBR Green PCR Master Mix (Applied Biosystems), qPCR primers, and cDNA template were loaded onto a 384-well plate and run through 40 cycles on an ABS 7900HT sequence detection system (Applied Biosystems). Data were analyzed using the manufacturer's SDS software version 3.0. Relative quantification was determined using the ΔΔCt method [18] with normalization to 18S RNA. A standard t-test was used for comparison of expression levels in estrus and proestrus. If variances between the two groups were statistically different, as determined by an F-test, then a Mann-Whitney nonparametric t-test was applied. ΔCt values were used when comparing groups of samples [19]. Samples with undetermined Ct values for all 3 technical triplicates, indicating no or very little expression, were assigned a Ct value of 40.
DAVID, Ingenuity Pathway Analysis, and Gene Set Enrichment Analysis
Genes meeting our criteria for differential expression between estrus and proestrus were subject to Database for Annotation, Visualization and Integrated Discovery (DAVID) analysis (DAVID bioinformatics resources version 6.7) [20] and Ingenuity Pathway Analysis (IPA; Ingenuity Systems, www.ingenuity.com) for cluster and enrichment analysis. Two lists of genes were used for this analysis: 1) whole uterine horn genes differentially expressed in estrus versus proestrus >2-fold at P < 0.005, and 2) the subset of this list which showed the same direction of differential expression in uterine lumenal epithelium at P < 0.005, with no minimum fold change. Agilent microarray annotations were used as a reference list against which the P value of each GO term was calculated. The set of enriched annotation terms was determined using DAVID functional annotation chart with the threshold of minimum gene counts belonging to an annotation term set at 50. An Expression Analysis Systematic Explorer (EASE) score ≤ 0.05 and a false discovery rate ≤ 10% were used to indicate significant enrichment (whole uterine horns, Supplemental Table S4; lumenal epithelium, Supplemental Table S5). Clusters of functionally related genes were determined using DAVID gene functional classification tool on the basis of their annotation term co-occurrence (whole uterine horns, Supplemental Table S6; lumenal epithelium, Supplemental Table S7). DAVID Functional Annotation Clustering was used to cluster annotations having similar gene members (whole uterine horns, Supplemental Table S8; lumenal epithelium, Supplemental Table S9). The stringency was set to “high” in both analyses.
IPA core analysis was carried out using the top 800 differentially regulated genes in estrus versus proestrus to fall within the recommended limit of IPA for gene numbers. Agilent microarray gene annotations were used as a reference set for data analysis, and the analysis was run against all mammalian tissues and cell lines. Canonical pathways identified by IPA as significantly associated with differentially expressed genes are shown in Supplemental Table S10 and Supplemental Figure S2 for whole uterine horns and in Supplemental Table S11 for lumenal epithelium. The top networks generated by IPA (P < 10−9) are shown in Supplemental Table S12 and Supplemental Figure S3 for whole uterine horns and in Supplemental Table S13 for lumenal epithelium. Gene set enrichment analysis (GSEA) [21] was used to investigate whether the microarray datasets showed enrichment for any of 3272 curated C2 gene sets (available at www.broadinstitute.org/gsea/index.jsp) collected from online pathway databases, from publications in PubMed, and from knowledge of domain experts. Cutoff values were set at a false discovery rate of ≤0.05 and normalized enrichment score of ≥2. Significantly enriched data sets are shown in Supplemental Table S14 for whole uterine horns and in Supplemental Table S15 for lumenal epithelium.
RESULTS
Microarray Analysis and qPCR Validation
A total of 2428 genes were differentially regulated in whole uterine horns during estrus compared to proestrus (see Supplemental Table S1), with 1127 genes significantly upregulated and 1301 genes significantly downregulated in estrus compared to proestrus (>2-fold change, P < 0.005). Fifty-six of the differentially regulated genes showed large (>10-fold) differences in expression between estrus and proestrus. qPCR analysis of 14 of the differentially regulated genes validated the microarray results in a large set (n = 20) of individual mice (Table 1, Fig. 1, Supplemental Fig. S1). A total of 1212 genes of the 2428 genes showing differential regulation in whole uterine tissue were also differentially expressed (P < 0.005) in the same manner in uterine lumenal epithelium (see Supplemental Table S16).
DAVID and IPA Analysis of Differentially Regulated Genes
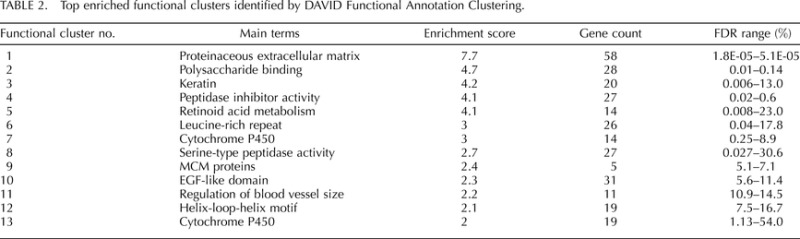
The primary annotation terms enriched in whole uterus at estrus versus proestrus included signal peptide, glycoprotein, extracellular matrix, developmental protein, calcium ion binding, and cell adhesion (see DAVID functional annotation analysis in Supplemental Table S4). Gene clusters (gene groups) identified using the DAVID gene functional classification tool included serine protease inhibitors (cluster 3), collagens (cluster 5), Wnt signaling pathway (cluster 6), peptidase activity (clusters 7 and 9), epidermal growth factor (EGF) (cluster 10), chemokines (cluster 11), MHCII (cluster 13), ion channel and transport (clusters 12, 14, 16), keratins (cluster 15), ATP-binding cassette transporters (cluster 17), cytochromes P450 (Cyp; cluster 18), mini-chromosome maintenance (MCM) proteins (cluster 23) (Supplemental Table S6). Clusters of annotation terms with enrichment scores ≥2 are shown in Table 2. The following enriched categories were validated for the subset of differentially expressed genes that were regulated in the same direction in isolated lumenal epithelial cells (Supplemental Tables S5, S7, and S9): signal peptide, glycoprotein, extracellular region, MCM proteins, cytochrome P450, peptidase activity, serine protease inhibitors, collagen, retinoid acid metabolism, antigen presenting, keratin, ion channels, and Wnt signaling pathway.
TABLE 2.
Top enriched functional clusters identified by DAVID Functional Annotation Clustering.
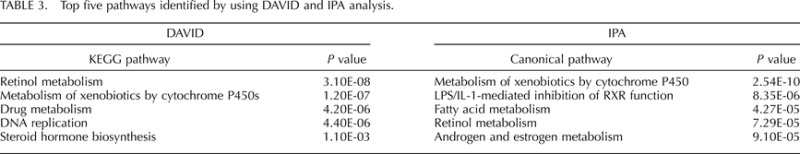
The top five Kyoto Encyclopedia of Genes and Genomes (KEGG) pathways and the top five IPA canonical pathways enriched in whole uterus are presented in Table 3. These pathways include steroid and fatty acid metabolism catalyzed by Cyp and other enzymes. The top five networks generated by IPA (score of ≥25) are presented in Supplemental Figure S3. These networks are described as follows: 1) cell morphology, cellular assembly and organization, nervous system development, and function; 2) cancer, cellular movement, and reproductive system development and function; 3) cellular development, connective tissue development and function, skeletal and muscular system development, and function; 4) cellular growth and proliferation, tissue development, and cell morphology; and 5) cell-to-cell signaling and interaction, hematological system development and function, and immune cell trafficking. Top networks constructed from the estrus versus proestrus differential genes validated for epithelial cells include similar descriptors: cell cycle, cell morphology, cellular movement, assembly and organization, cell, tissue, organ, and organism development, cell signaling, cell-mediated immune response, and cancer (Supplemental Table S13).
TABLE 3.
Top five pathways identified by using DAVID and IPA analysis.
IPA transcription factor analysis identified 10 transcription factors (absolute regulation z-score [|regulation z-score |] >2) in whole uterus that may contribute to the gene expression changes observed in our experimental dataset (Table 4), as determined by changes in expression of each transcription factor's target genes. Three of the transcription factors (E2f1, Nr1i3, Hnf4a) themselves showed >2-fold differential regulation in our data set. Four of the 10 transcription factors (E2f1, Hnf4a, Smarcb1, and Hnf1a) also had a |regulation z-score| >2 and/or were regulated >2-fold in lumenal epithelium of uterine horns (Supplemental Table S17). The relationship of the 10 transcription factors to each other and to their regulated gene targets is shown in Figure 2.
TABLE 4.
Transcription factors predicted by IPA analysis to contribute to differential gene expression in estrus versus proestrus.
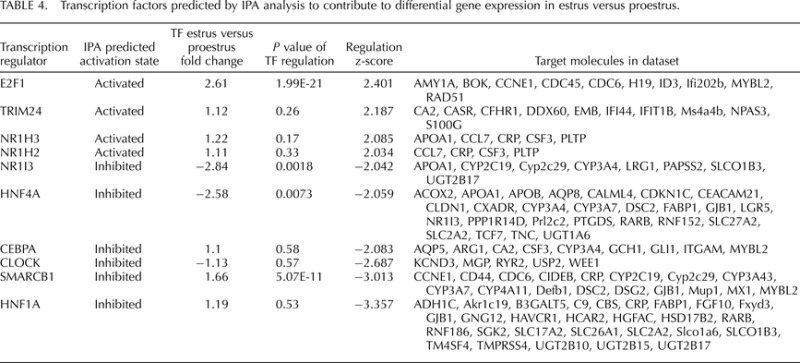
FIG. 2.
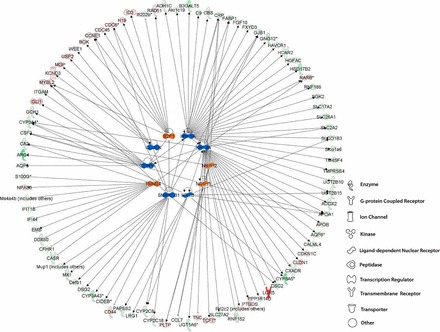
Gene network constructed by IPA (Ingenuity Systems) and including transcription factors (Table 4) (inner circle), targets of which were enriched with regulated genes (outer circle). Transcription factors are shown in orange if their predicted effect on corresponding targets is activation and in blue if inhibition. Genes upregulated in estrus versus proestrus are in shown in red and downregulated in green.
Gene set enrichment analysis.
Whole uterine tissue and isolated lumenal epithelium showed significant enrichment for 101 and 423 data sets from the C2 curated GSEA databases, respectively (Supplemental Table S14 and S15). Enriched gene sets that represent pathways from curated databases (KEGG, Biocarta, and Reactome) are shown in Supplemental Tables S18 and S19. The largest group of enriched pathways relates to cell division. The genes in these cell division pathways are upregulated in estrus versus proestrus. Other curated pathways upregulated in estrus in whole uterine tissue are the Wnt and hedgehog signaling pathways, while complement and coagulation-related pathways and steroid metabolism are upregulated in proestrus. The Wnt pathway is also enriched in epithelial cells. Many of the other gene sets retrieved by GSEA relate to cancer, which can be explained by the up regulation of genes related to cell division in estrus. As an example, one of the top enriched gene sets (normalized enrichment score = 2.45 for whole uterine tissue and 3.62 for isolated lumenal epithelium) is comprised of 134 genes upregulated in patients with aggressive cervical carcinoma [22], 74 of which contribute to the high enrichment score (Fig. 3). The 134 genes comprising this data set relate to the terms cell cycle, nuclear division, M phase of mitotic cycle, regulation of cell cycle, DNA replication and chromosome cycle [22].
FIG. 3.
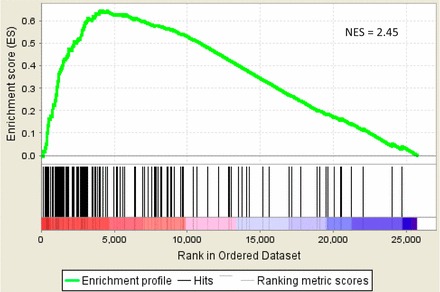
Example of a cancer-related gene set enriched in GSEA: the gene set, consisting of 134 genes upregulated in aggressive cervical carcinoma [22], is enriched in the set of genes upregulated in estrus compared to proestrus with a normalized enrichment score = 2.45. Genes are ordered along the x-axis in order of descending estrus:proestrus expression ratio.
DISCUSSION
The present genome-wide microarray study shows that the remodeling of uterine tissue during the transition from proestrus to estrus is widespread, involving the differential regulation of 2428 genes and affecting ∼10% of all protein-coding genes. These gene expression changes were associated with molecular pathways and gene networks that describe uterine tissue remodeling and other processes required for preparation of the uterus for embryonic implantation, as discussed below, and as highlighted by the gene groups presented in Supplemental Table S20. Moreover, ∼50% of these genes were also differentially expressed in the same direction in uterine lumenal epithelium. Given these estrus cycle-dependent changes in gene expression, it is essential to control for the stage of the estrus cycle when investigating the effects of xenoestrogen exposure on biological outcomes related to uterine function and gene expression.
Genes Affecting Uterine Morphology, Architecture, and Tissue Remodeling
Our findings indicate that the uterine extracellular matrix (ECM) undergoes substantial rearrangement between proestrus and estrus. Similarly, the endometrial connective tissue matrix undergoes major remodeling during the menstrual cycle [23], in particular during the proliferative phase of the cycle [24]. Collagen, a major component that provides strength and shape to the uterine ECM [25], was enriched in the DAVID gene functional classification. Five collagen genes were upregulated in whole uterine tissue in estrus compared to proestrus, while ten others were downregulated (Supplemental Table S20A). Collagen content is known to differ in human uterus during pregnancy and later during the postpartum involution [26]. Collagen content increases up to 8–fold at term compared with the nonpregnant state and undergoes rapid resorption following parturition. Different collagen types have distinct spatiotemporal expression patterns during decidualization and pregnancy in rodents [27, 28].
Dynamic changes in the uterine extracellular architecture are regulated in part by MMPs, matrix-degrading serine proteinases, and their inhibitors [23]. We found that the top differentially regulated functional clusters included many proteases and protease inhibitors (Supplemental Table S20B, S20C), consistent with the regulation of mouse uterine proteases and their inhibitors during the estrus cycle and pregnancy [29]. The MMP genes 3, 8, 10, 11, and 12 were upregulated in estrus, while three serine proteinases (Prss46, Tmprss5 and Tmprss9) were upregulated and nine were downregulated (Prss genes 23, 28, and 29 and Tmprss genes 4, 11a, 11bnl, 11d, 11e, and 13). The Tmprss genes 11a, 11b, and 11e belong to the type II transmembrane serine protease family implicated in cancer [30]. The serine protease cluster includes kallikrein 1 and several related peptidases, all of which were downregulated in estrus relative to proestrus (Supplemental Table S20B). Kallikrein 1 is downregulated in estrus relative to diestrus [6] and is increased by estrogen treatment [31]. Consistent with this, kallikrein 1 was upregulated in proestrus, i.e., when estrogen levels are high. Correspondingly, during the menstrual cycle in humans, MMP3 and MMP10 increase during the late-secretory phase, peak at menstruation and then decrease in the late proliferative phase [5].
The serine protease inhibitor cluster was highly enriched in the set of differentially regulated genes (Table 2). Individual genes were upregulated (Serpinb7, Serpinb11, Sepine2, Spink2, Spink8, Spink12, Spinlw1) or downregulated (Serpina4-psl, Serpina6, Serpina9, Serpinb1a, Serpinb1c, Serpinb5, Spink3, and Spink13) in estrus compared to proestrus. Spink3 may play an important role in implantation, as indicated by its association with stromal cell decidualization [5]. Serpine2 and Serpinb7 are expressed primarily in the lumenal and glandular epithelium of the uterus [29, 32]. Serpine2, a plasminogen activator inhibitor involved in tissue remodeling in mouse uterus, is highly expressed during the estrus cycle and pregnancy [29]. Serpine2 is upregulated during implantation and may be involved in tissue remodeling during implantation [29]. Serpinb7 is expressed in uterine tissue and may play a role in regulation of epithelial proliferation [32]. Serpinb7 expression is suppressed by estrogen treatment [32], consistent with our finding that Serpinb7 expression is low in proestrus (i.e., at the time of the surge in estrogen levels).
Another change in uterine structural gene expression identified here involves keratins and occurs during the transition from proestrus to estrus. Many keratin genes were differentially regulated in estrus (Supplemental Table S20D). Keratins participate in cornification of the epithelium, which is a universal mechanism for formation of an epithelial barrier against the environment in vertebrates [33]. The decreased expression of many keratin genes in estrus is likely due to the decreased number of cornified epithelial cells in the uterine lumenal lining at estrus and may be a functional analog of the desquamation that takes place during menstruation in humans [24]. Cornification of the vaginal epithelium is estrogen regulated [34] and is a common response to xenoestrogen exposure [35]. Keratins are likely involved in formation of an epithelial barrier in preparation for implantation all along the Müllerian duct. Estrogen exposure induces estrogen receptor-α dependent uterine expression of genes related to keratinization (Krt6a, Krt13, Krt19, Sfn, Sprr1a, Tgfbi, Tgm2) in the late phase response, i.e., 24 hr after estrogen stimulation [38]. We observed downregulation of 6 of these genes in mouse uterus at estrus, both in whole uterine horns and in the lumenal epithelium data sets, although the differential regulation was less than 2-fold in epithelial cells.
Cell Adhesion Genes
Implantation involves stable adhesion of the embryo to the epithelium; however, the molecular mechanisms of this interaction are poorly understood. Presently, we identified many cell adhesion molecules that are regulated in estrus, in preparation for implantation [36] (Supplemental Table S20E). Cadherins, which mediate cell–cell interactions by calcium-dependent binding [37], catenins, which regulate cadherin activity [38], and several related molecules were upregulated (Cdh2, Ctnnd2, Dact1, Pcdh20), and one protocadherin (Pcdh17) and other members of the cadherin superfamily, were also downregulated in estrus (Dsc2, Dsg2, Dsg3). Calcitonins regulate surface cadherins [39] and integrins [40] by increasing intracellular calcium. Two calcitonin-related peptides (Calca, Calcb) were downregulated, while calcitonin receptor (Ramp1) was upregulated during estrus. Several mucin genes that play a role in embryo implantation [36] were downregulated in our data set (Muc4, Muc13, Muc20). Integrins mediate the attachment of cells to each other or to the ECM. Three integrins were downregulated (Itga1, Itga6, Itgam), and one was upregulated (Itgax) in estrus compared to proestrus. Members of the immunoglobulin superfamily are cell-cell receptors involved in cell adhesion [41]. Four members of this family were downregulated (Alcam, Ceacam, Dscam, Tcam1) and one was upregulated (Madcam1). Another cell adhesion molecule, Trophinin (Tro), was upregulated, although it is not absolutely required during early implantation [42]. Cd164 was downregulated and Cd44 was upregulated in estrus. These glycoproteins may play a role during embryo attachment based on their localization on the apical surface of lumenal epithelial, glandular and stromal cells [36]. Two galectins belonging to a family of calcium-independent β-galactoside-binding proteins were upregulated (Lgals1, Lgals3) and one was downregulated (Lgals9). These proteins may act by cross-linking carbohydrate chains on the cell surface and the ECM [43]. Cycle-dependent expression of galectins was observed in human endometrial stromal cells (Lgals1) and in epithelial cells (Lgals3) [44]. Thus, many adhesion molecules important for successful implantation are regulated in the course of the estrus cycle.
Cell Proliferation
Tissue remodeling during the proestrus-estrus transition is accompanied by extensive cell proliferation, as indicated by the enrichment of many pathways and annotation terms related to DNA replication and cell division (Table 3, Supplemental Tables S18 and S19). For example, many MCM proteins were upregulated in estrus. These proteins help initiate DNA replication and are also involved in replication elongation [45]. Coordinated activation of mitotic pathways is also reflected in the enrichment in GSEA analysis of gene sets related to different cancer types. The involvement of the same genes in uterine tissue remodeling during the reproductive cycle and in cancer pathogenesis implies that a normal cycling uterine tissue may switch to a carcinogenic state by disruption of hormonal regulation. This suggests that a better understanding of reproductive tissue tumors may come from studies of the interactions of stressors with mechanisms of menstrual/estrus cycling. In humans, genes involved in cell proliferation, including MCM proteins, peak during the proliferative stage of the menstrual cycle [24].
Chemokines and Immune Cells
DAVID gene functional classification identified a cluster containing C-C and C-X-C motif chemokines, which were either upregulated (Cxcl14, Cxcl15, Ccl17, Ccl19, Ccl21a, Ccl21b) or downregulated in estrus (Ccl7, Ccl11, Ccl12, Cxcl17) (Supplemental Table S20F). Ccl17 and Ccl19 display chemotactic activity for T and B lymphocytes, and their up regulation in estrus is associated with increased lymphocyte attraction. Conversely, three potent monocyte chemoattractants, Ccl7, Ccl12 and Cxcl17 [46–48], have higher levels of expression in proestrus, indicating a relative decrease in monocyte attraction in estrus. In the human menstrual cycle, monocyte attraction peaks during mid-secretory phase [24]. The changes in chemokine expression in mouse correspond to known dynamics of leukocytes in the cycling uterus. In mice, macrophage density is lowest at diestrus, when estrogen drops to its lowest level and increases to comprise 20% of the stromal cells at proestrus under the influence of estrogen [49]. The monocyte population may differentiate into tropic macrophages, which are involved in morphogenesis and tissue regeneration, or to macrophages with immunological functions [50]. The direction of differentiation is determined by the balance of cytokines [51], of which the ratio of the two colony-stimulating factors Csf1 and Csf2 is pivotal in regulating the transition between immunosuppressive and immunostimulatory phenotypes [52]: Csf1 locally blocks the maturation of dendritic cells, so that they are unable to present antigens, and promotes the development of trophic macrophages, whereas Csf2 directs macrophages towards more cytotoxic and antigen-presenting phenotypes. In our dataset Csf2 was upregulated and Csf1 was downregulated in estrus compared to proestrus, although the differential expression of both genes was <2-fold. This suggests that macrophage differentiation switches to a more immunostimulatory phenotype during estrus. This observation is supported by the up regulation in estrus of eight MHCII genes (Supplemental Table S20F), suggesting an increase in antigen-presenting cells in the uterus during estrus, consistent with an earlier report in rat uterus [53]. Antigen-presenting cells are under estrogen control as seen in ovariectomized rats treated with estradiol, which stimulates epithelial cells and inhibits stromal cells antigen presentation [54]. In humans, MHC genes are upregulated during the late secretory phase of the menstrual cycle [24].
Complement and Coagulation Cascade
Many genes of the complement and coagulation cascade have a lower level of expression in estrus than in proestrus (Supplemental Table S18). Estradiol stimulates the synthesis of C3, whereas simultaneous or delayed administration of progesterone inhibits its synthesis [55], consistent with our finding that C3 is elevated in proestrus compared to estrus. Conceivably, other complement and coagulation cascade genes may be regulated in a similar manner. Interestingly, C3 is responsive to xenoestrogens and is used as a biomarker of xenoestrogen exposure [56]. Assuming the entire cascade has a similar mechanism of hormonal control in the uterus, xenoestrogens may lead to disruption of this pathway. Activation of the blood coagulation cascade and the innate immune response occur during mid and late-secretory phase of the menstrual cycle in humans [24].
Metabolic Genes
Many Cyp genes are differentially regulated during estrus compared to proestrus: 5 are upregulated and 20 are downregulated (Supplemental Table S20G). These Cyp gene alterations affect several pathways and functional clusters (Table 2, Table 3). The down regulation of Cyp7a1, Cyp8b1, and Cyp39a1, as well as other genes, contributes to the downregulation of steroid and bile acid metabolism in estrus (Supplemental Table S18), although down-regulation of Cyp7a1 and Cyp8b1 was <2-fold. The canonical pathway of androgen and estrogen metabolism was also suppressed (Table 3), due in part to decreased expression in estrus of several glucuronosyltransferases, hydroxysteroid dehydrogenases, dehydrogenase/reductase (Dhrs9), and arylsulfatase (Arsi) (Supplemental Table S20G). In contrast, Cyp genes active in steroid hormone biosynthesis (Cyp11a1, Cyp11b1) were elevated. Cyp11a1 is regulated by LH [57], and its activation may be due to the peak in LH secretion the first night of estrus [58]. Fatty acid metabolism was also inactivated in estrus, reflecting the down regulation of genes from the Cyp2, Cyp3 and especially Cyp4 families. Cyp26a1, which catalyzes retinol metabolism and is upregulated in estrus relative to proestrus, is important for implantation, as a reduction in its expression has been associated with a decreased rate of pregnancy and fewer implantation sites in mice [59]. Metabolically active genes are predominant during the early and mid-secretory stages of the human menstrual cycle, with steroid biosynthesis genes peaking during the late secretory phase [24].
Ion Channels
DAVID analysis identified several ligand-gated ion channels as enriched, many of which are active in synaptic signaling in the nervous system. These include ionotropic glutamate receptors subunits: AMPA receptor subunit Gria3 (downregulated), kainate receptor subunits (Grik3, up; Grik4, downregulated) and NMDA receptor subunit Grin2c (upregulated). Also upregulated in estrus were receptors for nicotinic acetylcholine (Chrna4, Chrna6, Chrnb1, Chrnb3), GABA (Gabra4, Gabrb3), and glycine (Glrb) (Supplemental Table S20H). AMPA receptors are primary found in the myometrium, and endometrial glands in rat and in the myometrium in Macaca fascicularis, whereas NMDA receptors are more specific to the endometrial glands in rats and widespread in the uterus of macaque [60]. The role of nicotinic acetylcholine receptors in uterine physiology is suggested by the beneficial role of nicotine in the pathological process of endometriosis as was shown by the inverse correlation of cigarette smoking and the risk of having endometriosis [61].
Signaling Molecules and Transcriptional Regulators in Estrus versus Proestrus
Regulation of uterine cyclicity is under the tight control of ovarian estrogen and progesterone; however, the cascade of events triggered by these hormones and the transcription factors that mediate steroid hormone signals during the estrus cycle are only partly understood. Here, we identified several transcription factors whose gene targets were differentially regulated in estrus versus proestrus. The most significantly enriched signaling clusters were Wnt signaling and Hedgehog signaling (Supplemental Table S18). IPA identified another set of 10 transcription factors, whose putative targets were differentially expressed in estrus versus proestrus (Table 4). Of these, E2f1, Hnf4a, Nr1i3 deserve special attention as they themselves were regulated in the direction predicted from the analysis of their target genes. Finally, a group of 19 helix-loop-helix containing transcription factors were differentially regulated (Table 2; Supplemental Table S20I).
Wnt Signaling
Wnt signaling was activated in estrus versus proestrus uterus (Fig. 4), with 9 members of the Wnt family upregulated. Six Fzd genes, which are extracellular surface Wnt receptors that mediate intracellular signal transduction, were also upregulated (Supplemental Table S20J). Wnt/β-catenin signaling is important for regulation of endometrial proliferation and differentiation [62]. Moreover, several downstream Wnt/β-catenin targets are regulated by estrogen and progesterone [63]. Wnt/β-catenin signaling changes during the menstrual cycle [64] and helps prepare the endometrium for embryo implantation [65]. In mice, three Wnt family members (Wnt4, Wnt5a, and Wnt7a) have been identified in the female reproductive tract [66]. Null mutation of these genes or alteration of their expression by endocrine disruptors impacts prenatal and postnatal development of the Müllerian duct [67]. Wnt4-null mice fail to form Müllerian ducts and die at birth as a result of numerous defects [68]. Wnt5a is expressed throughout the uterine mesenchyme, whereas Wnt7a is expressed only in endometrial lumenal epithelium [69]. Altered expression of Wnt genes has been implicated in different pathological states in the reproductive system. For example, neonatal exposure to the xenoestrogen diethylstilbestrol disrupts endometrial gland development and is associated with suppression of 5 genes [70]. Activated Wnt/β-catenin signaling is often found in endometrial cancer [71]. According to one hypothesis, estrogen signaling that is either enhanced or unopposed by progesterone may permanently activate Wnt/β-catenin signaling leading to endometrial hyperplasia and cancer [72]. Activation of Wnt signaling is a characteristic of the menstruation phase in cycling human uterus [24].
FIG. 4.
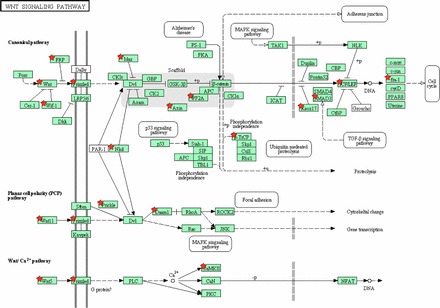
Activation of the Wnt signaling pathway in mouse uterus in estrus versus proestrus. Upregulated genes are marked by red stars.
Hedgehog Signaling
Another estrus cycle-dependent developmental pathway identified is hedgehog signaling (Fig. 5). Indian hedgehog (Ihh) and desert hedgehog (Dhh) but not sonic hedgehog (Shh) were upregulated in estrus compared to proestrus, as were several other hedgehog pathway genes (Supplemental Table S20K). This up regulation is indicative of the uterus being in a proliferative state in estrus. Ihh expression in the lumenal and glandular epithelium of the uterus increases in response to progesterone receptor signaling [73] and studies using transgenic mice showed that hedgehog signaling is essential for implantation [74]. The role of hedgehog signaling in the regulation of the reproductive cycle and the mechanisms of its interplay with other developmental pathways are only partially understood. The hedgehog pathway interplays with Wnt and Hoxa signaling during rodent Müllerian duct development, with hyperactivation of hedgehog signaling leading to abnormal development of the female reproductive tract, altered levels of Hoxa13 and Wnt5a expression, and an aberrant inflammatory response to mating [75].
FIG. 5.
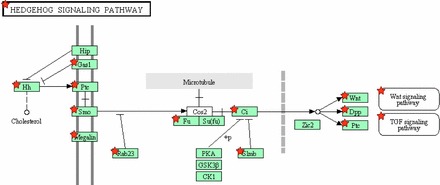
Activation of Hedgehog signaling pathway in mouse uterus in estrus versus proestrus. Upregulated genes are marked by red stars.
Transcription Factors With Poorly Known Role in Uterine Physiology
Little is known about the role in uterine physiology of several differentially expressed transcription factors identified by IPA. Although E2f1 is a known cell cycle regulator [76], its role in the health and disease of the female reproductive system is just beginning to emerge. E2f1 is overexpressed in cervical cancer [77] and E2f1 response elements are enriched in promoters of genes that are differentially expressed in proliferative versus mid-secretory phase and in early secretory versus mid-secretory phase of the menstrual cycle, suggesting a role for E2f1 in preparation of the endometrium for embryo implantation [78]. Hnf1a, a transcription factor required for expression of many liver-specific genes, is also expressed in mouse uterus and oviduct [79]. In humans, mutation of the related transcription factor Hnf1b is associated with rudimentary uterus (Müllerian aplasia) [80]. Cebpa activates P450 aromatase activity, which is characteristic of endometriotic stromal cells but not eutopic endometrium and catalyzes estrogen biosynthesis [81]. Clock is a major component of the mammalian circadian clock [82]; mutation of Clock disrupts estrus cyclicity and interferes with the maintenance of pregnancy, although dysregulation of cyclicity likely occurs at the hypothalamic level [10].
Three other differentially regulated transcription factors identified by IPA (Hnf4a, Smarcb1, and Trim24) have no known targets in the uterus. Hnf4a controls expression of many hepatic genes, and has been implicated in the development of different organs. Smarcb1 is part of a complex that relieves repressive chromatin structures, allowing the transcriptional machinery to access its targets more effectively by sliding and/or ejection of nucleosomes [83]. Trim24 mediates transcriptional control by interaction with the activation function-2 region of several nuclear receptors, including estrogen, retinoic acid, and vitamin D3 receptors. Trim24 can act as a corepressor with retinoic acid and vitamin D receptors, and as coactivator for the estrogen receptor [84] and shows female-biased expression in mouse liver [85].
Nr1h2 (LXRB), Nr1h3 (LXRA), and Nr1i3 (CAR), encode ligand-activated transcription factors of the nuclear receptor superfamily. These proteins bind to DNA as heterodimers with retinoid X receptor (RXR) and regulate the transcription of target genes. CAR targets are primarily involved in hepatic and intestinal drug metabolism and bilirubin clearance, and include cytochrome P450 family members. LXRA and LXRB are key regulators of macrophage function, controlling transcriptional programs involved in lipid homeostasis and inflammation. LXRA is inducible by oxidized forms of cholesterol and intermediate products of the cholesterol biosynthetic pathway and is highly expressed in select tissues, whereas LXRB is ubiquitously expressed [86]. LXRB is required for proper induction of uterine contractions and may play a role in the regulation of cholesterol homeostasis by limiting cholesteryl ester levels as a mechanism for protection of the uterus against cholesterol accumulation [87].
This study provides a global view of gene expression in mouse uterus during estrus and proestrus, and shows that (at least) 14 genes are validated as useful markers to differentiate estrus from proestrus. The mouse uterus was shown to undergo a remarkable tissue remodeling during the course of the estrus cycle, involving significant changes in the expression of at least 10% of all known protein-coding genes, with many of the differentially regulated genes validated in independent analyses carried out in isolated uterine lumenal epithelial cells. Several of the genes and gene networks identified have been implicated in pathological states, including response to xenoestrogen exposure, endometriosis, and cancer, and may help elucidate cancer and other diseases of the reproductive tract as a result of cycle disturbance. Finally, many of the pathways and biological functions that are altered in mouse uterus during the transition from proestrus to estrus also show significant changes in expression during the human menstrual cycle, although not necessarily at the corresponding phases of the cycle. Proestrus combines some features of the early (increased metabolism), mid (increased metabolism, monocyte attraction, and innate immunity) and late (blood coagulation cascade) secretory phases, while estrus encompasses a mosaic of molecular changes characteristic of late secretory phase (activation of MHC, steroid biosynthesis), the menstrual phase (increased expression of MMP proteins, decreased keratins, activated Wnt signaling), and the proliferative phase (enriched ECM remodeling, and cell proliferation, including up-regulation of MCM genes). These differences between the estrus and menstrual cycles should be considered when using the mouse as a model for studies of human reproductive health and disease.
Supplementary Material
ACKNOWLEDGMENT
The authors thank Gracia Bonilla and Harold Gomez for assistance with qPCR validation.
Footnotes
Supported in part by National Institutes of Health Challenge Grant RC1-ES018332 to D.J.W.
These authors contributed equally to this work.
REFERENCES
- Tabibzadeh S. The signals and molecular pathways involved in human menstruation, a unique process of tissue destruction and remodelling. Mol Hum Reprod 1996; 2: 77 92. [DOI] [PubMed] [Google Scholar]
- Ruiz-Alonso M, Blesa D, Simon C. The genomics of the human endometrium. Biochim Biophys Acta 2012; 1822: 1931 1942. [DOI] [PubMed] [Google Scholar]
- Ponnampalam AP, Weston GC, Trajstman AC, Susil B, Rogers PA. Molecular classification of human endometrial cycle stages by transcriptional profiling. Mol Hum Reprod 2004; 10: 879 893. [DOI] [PubMed] [Google Scholar]
- Critchley HO, Robertson KA, Forster T, Henderson TA, Williams AR, Ghazal P. Gene expression profiling of mid to late secretory phase endometrial biopsies from women with menstrual complaint. Am J Obstet Gynecol 2006; 195: 406.e1 406.e16. [DOI] [PubMed] [Google Scholar]
- Punyadeera C, Dassen H, Klomp J, Dunselman G, Kamps R, Dijcks F, Ederveen A, de Goeij A, Groothuis P. Oestrogen-modulated gene expression in the human endometrium. Cell Mol Life Sci 2005; 62: 239 250. [DOI] [PMC free article] [PubMed] [Google Scholar]
- Tan YF, Li FX, Piao YS, Sun XY, Wang YL. Global gene profiling analysis of mouse uterus during the oestrous cycle. Reproduction 2003; 126: 171 182. [DOI] [PubMed] [Google Scholar]
- Knobil E, Neill JD. The Physiology of Reproduction. New York: Elsevier; 2006. [Google Scholar]
- Lee DS. Yanagimoto Ueta Y, Xuan X, Igarashi I, Fujisaki K, Sugimoto C, Toyoda Y, Suzuki H. Expression patterns of the implantation-associated genes in the uterus during the estrous cycle in mice. J Reprod Dev 2005; 51: 787 798. [DOI] [PubMed] [Google Scholar]
- Lee GS, Jeung EB. Uterine TRPV6 expression during the estrous cycle and pregnancy in a mouse model. Am J Physiol Endocrinol Metab 2007; 293: E132 138. [DOI] [PubMed] [Google Scholar]
- Nakamura TJ, Sellix MT, Kudo T, Nakao N, Yoshimura T, Ebihara S, Colwell CS, Block GD. Influence of the estrous cycle on clock gene expression in reproductive tissues: effects of fluctuating ovarian steroid hormone levels. Steroids 2010; 75: 203 212. [DOI] [PMC free article] [PubMed] [Google Scholar]
- Salgado RM, Capelo LP, Favaro RR, Glazier JD, Aplin JD, Zorn TM. Hormone-regulated expression and distribution of versican in mouse uterine tissues. Reprod Biol Endocrinol 2009; 7: 60. [DOI] [PMC free article] [PubMed] [Google Scholar]
- Tan YF, Sun XY, Li FX, Tang S, Piao YS, Wang YL. Gene expression pattern and hormonal regulation of small proline-rich protein 2 family members in the female mouse reproductive system during the estrous cycle and pregnancy. Reprod Nutr Dev 2006; 46: 641 655. [DOI] [PubMed] [Google Scholar]
- Caligioni CS. Assessing reproductive status/stages in mice. Curr Protoc Neurosci 2009; 48: A.4I.1 A.4I.8. [DOI] [PMC free article] [PubMed] [Google Scholar]
- Glasser SR, Julian J, Decker GL, Tang JP, Carson DD. Development of morphological and functional polarity in primary cultures of immature rat uterine epithelial cells. J Cell Biol 1988; 107: 2409 2423. [DOI] [PMC free article] [PubMed] [Google Scholar]
- Conforto TL, Waxman DJ. Sex-specific mouse liver gene expression: genome-wide analysis of developmental changes from pre-pubertal period to young adulthood. Biol Sex Differ 2012; 3: 9. [DOI] [PMC free article] [PubMed] [Google Scholar]
- Weng L, Dai H, Zhan Y, He Y, Stepaniants SB, Bassett DE. Rosetta error model for gene expression analysis. Bioinformatics 2006; 22: 1111 1121. [DOI] [PubMed] [Google Scholar]
- Rajagopalan D. A comparison of statistical methods for analysis of high density oligonucleotide array data. Bioinformatics 2003; 19: 1469 1476. [DOI] [PubMed] [Google Scholar]
- Livak KJ, Schmittgen TD. Analysis of relative gene expression data using real-time quantitative PCR and the 2(-delta delta C(T)) method. Methods 2001; 25: 402 408. [DOI] [PubMed] [Google Scholar]
- Yuan JS, Reed A, Chen F, Stewart CN Jr. Statistical analysis of real-time PCR data. BMC Bioinformatics 2006; 7: 85. [DOI] [PMC free article] [PubMed] [Google Scholar]
- Huang da W, Sherman BT, Lempicki RA. Systematic and integrative analysis of large gene lists using DAVID bioinformatics resources. Nat Protoc 2009; 4: 44 57. [DOI] [PubMed] [Google Scholar]
- Subramanian A, Tamayo P, Mootha VK, Mukherjee S, Ebert BL, Gillette MA, Paulovich A, Pomeroy SL, Golub TR, Lander ES, Mesirov JP. Gene set enrichment analysis: a knowledge-based approach for interpreting genome-wide expression profiles. Proc Natl Acad Sci U S A 2005; 102: 15545 15550. [DOI] [PMC free article] [PubMed] [Google Scholar]
- Rosty C, Sheffer M, Tsafrir D, Stransky N, Tsafrir I, Peter M, de Cremoux P, de La Rochefordiere A, Salmon R, Dorval T, Thiery JP, Couturier J, et al. Identification of a proliferation gene cluster associated with HPV E6/E7 expression level and viral DNA load in invasive cervical carcinoma. Oncogene 2005; 24: 7094 7104. [DOI] [PubMed] [Google Scholar]
- Curry TE Jr, Osteen KG. The matrix metalloproteinase system: changes, regulation, and impact throughout the ovarian and uterine reproductive cycle. Endocr Rev 2003; 24: 428 465. [DOI] [PubMed] [Google Scholar]
- Ruiz-Alonso M, Blesa D, Simon C. The genomics of the human endometrium. Biochimica Biophysica Acta 2012; 1822: 1931 1942. [DOI] [PubMed] [Google Scholar]
- Diao H, Aplin JD, Xiao S, Chun J, Li Z, Chen S, Ye X. Altered spatiotemporal expression of collagen types I, III, IV, and VI in Lpar3-deficient peri-implantation mouse uterus. Biol Reprod 2011; 84: 255 265. [DOI] [PMC free article] [PubMed] [Google Scholar]
- Morrione TG, Seifter S. Alteration in the collagen content of the human uterus during pregnancy and post partum involution. J Exp Med 1962; 115: 357 365. [DOI] [PMC free article] [PubMed] [Google Scholar]
- Hurst PR, Palmay RD, Myers DB. Localization and synthesis of collagen types III and V during remodelling and decidualization in rat uterus. Reprod Fertil Dev 1997; 9: 403 409. [DOI] [PubMed] [Google Scholar]
- Spiess K, Teodoro WR, Zorn TM. Distribution of collagen types I, III, and V in pregnant mouse endometrium. Connect Tissue Res 2007; 48: 99 108. [DOI] [PubMed] [Google Scholar]
- Chern SR, Li SH, Lu CH, Chen EI. Spatiotemporal expression of the serine protease inhibitor, SERPINE2, in the mouse placenta and uterus during the estrous cycle, pregnancy, and lactation. Reprod Biol Endocrinol 2010; 8: 127. [DOI] [PMC free article] [PubMed] [Google Scholar]
- Choi SY, Bertram S, Glowacka I, Park YW, Pohlmann S. Type II transmembrane serine proteases in cancer and viral infections. Trends Mol Med 2009; 15: 303 312. [DOI] [PubMed] [Google Scholar]
- Rajapakse S, Yamano N, Ogiwara K, Hirata K, Takahashi S, Takahashi T. Estrogen-dependent expression of the tissue kallikrein gene (Klk1) in the mouse uterus and its implications for endometrial tissue growth. Mol Reprod Dev 2007; 74: 1053 1063. [DOI] [PubMed] [Google Scholar]
- Zhang X, Hoang E, Nothnick WB. Estrogen-induced uterine abnormalities in TIMP-1 deficient mice are associated with elevated plasmin activity and reduced expression of the novel uterine plasmin protease inhibitor serpinb7. Mol Reprod Dev 2009; 76: 160 172. [DOI] [PMC free article] [PubMed] [Google Scholar]
- Zeeuwen PL. Epidermal differentiation: the role of proteases and their inhibitors. Eur J Cell Biol 2004; 83: 761 773. [DOI] [PubMed] [Google Scholar]
- Buchanan DL, Kurita T, Taylor JA, Lubahn DB, Cunha GR, Cooke PS. Role of stromal and epithelial estrogen receptors in vaginal epithelial proliferation, stratification, and cornification. Endocrinology 1998; 139: 4345 4352. [DOI] [PubMed] [Google Scholar]
- Kirigaya A, Hayashi S, Iguchi T, Sato T. Developmental effects of ethinylestradiol on reproductive organs of female mice. In Vivo 2006; 20: 867 873. [PubMed] [Google Scholar]
- Singh H, Aplin JD. Adhesion molecules in endometrial epithelium: tissue integrity and embryo implantation. J Anat 2009; 215: 3 13. [DOI] [PMC free article] [PubMed] [Google Scholar]
- Stemmler MP. Cadherins in development and cancer. Mol Biosyst 2008; 4: 835 850. [DOI] [PubMed] [Google Scholar]
- Rosales C, O'Brien V, Kornberg L, Juliano R. Signal transduction by cell adhesion receptors. Biochim Biophys Acta 1995; 1242: 77 98. [DOI] [PubMed] [Google Scholar]
- Li Q, Bagchi MK, Bagchi IC. Identification of a signaling pathway involving progesterone receptor, calcitonin, and tissue tranglutaminase in Ishikawa endometrial cells. Endocrinology 2006; 147: 2147 2154. [DOI] [PubMed] [Google Scholar]
- Wang J, Rout UK, Bagchi IC, Armant DR. Expression of calcitonin receptors in mouse preimplantation embryos and their function in the regulation of blastocyst differentiation by calcitonin. Development 1998; 125: 4293 4302. [DOI] [PubMed] [Google Scholar]
- Aricescu AR, Jones EY. Immunoglobulin superfamily cell adhesion molecules: zippers and signals. Curr Opin Cell Biol 2007; 19: 543 550. [DOI] [PubMed] [Google Scholar]
- Fukuda MN, Sugihara K. An integrated view of L-selectin and trophinin function in human embryo implantation. J Obstet Gynaecol Res 2008; 34: 129 136. [DOI] [PMC free article] [PubMed] [Google Scholar]
- Rabinovich GA, Toscano MA, Jackson SS, Vasta GR. Functions of cell surface galectin-glycoprotein lattices. Curr Opin Struct Biol 2007; 17: 513 520. [DOI] [PMC free article] [PubMed] [Google Scholar]
- von Wolff M, Wang X, Gabius HJ, Strowitzki T. Galectin fingerprinting in human endometrium and decidua during the menstrual cycle and in early gestation. Mol Hum Reprod 2005; 11: 189 194. [DOI] [PubMed] [Google Scholar]
- Forsburg SL. Eukaryotic MCM proteins: beyond replication initiation. Microbiol Mol Biol Rev 2004; 68: 109 131. [DOI] [PMC free article] [PubMed] [Google Scholar]
- Rull A, Camps J, Alonso-Villaverde C, Joven J. Insulin resistance, inflammation, and obesity: role of monocyte chemoattractant protein-1 (or CCL2) in the regulation of metabolism. Mediators Inflamm 2010; 2010: 326580. [DOI] [PMC free article] [PubMed] [Google Scholar]
- Pisabarro MT, Leung B, Kwong M, Corpuz R, Frantz GD, Chiang N, Vandlen R, Diehl LJ, Skelton N, Kim HS, Eaton D, Schmidt KN. Cutting edge: novel human dendritic cell- and monocyte-attracting chemokine-like protein identified by fold recognition methods. J Immunol 2006; 176: 2069 2073. [DOI] [PubMed] [Google Scholar]
- Tsui P, Das A, Whitaker B, Tornetta M, Stowell N, Kesavan P, Kaiser E, Lacy ER, Yan L, Snyder LA, Sweet R. Generation, characterization and biological activity of CCL2 (MCP-1/JE) and CCL12 (MCP-5) specific antibodies. Hum Antibodies 2007; 16: 117 125. [PubMed] [Google Scholar]
- Hunt JS, Robertson SA. Uterine macrophages and environmental programming for pregnancy success. J Reprod Immunol 1996; 32: 1 25. [DOI] [PubMed] [Google Scholar]
- Tonello A, Poli G. Tubal ectopic pregnancy: macrophages under the microscope. Hum Reprod 2007; 22: 2577 2584. [DOI] [PubMed] [Google Scholar]
- Zou W. Immunosuppressive networks in the tumour environment and their therapeutic relevance. Nat Rev Cancer 2005; 5: 263 274. [DOI] [PubMed] [Google Scholar]
- Dranoff G. Cytokines in cancer pathogenesis and cancer therapy. Nat Rev Cancer 2004; 4: 11 22. [DOI] [PubMed] [Google Scholar]
- Head JR, Gaede SD. Ia antigen expression in the rat uterus. J Reprod Immunol 1986; 9: 137 153. [DOI] [PubMed] [Google Scholar]
- Wira CR, Rossoll RM. Antigen-presenting cells in the female reproductive tract: influence of the estrous cycle on antigen presentation by uterine epithelial and stromal cells. Endocrinology 1995; 136: 4526 4534. [DOI] [PubMed] [Google Scholar]
- Hasty LA, Lambris JD, Lessey BA, Pruksananonda K, Lyttle CR. Hormonal regulation of complement components and receptors throughout the menstrual cycle. Am J Obstet Gynecol 1994; 170: 168 175. [DOI] [PubMed] [Google Scholar]
- Diel P, Schulz T, Smolnikar K, Strunck E, Vollmer G, Michna H. Ability of xeno- and phytoestrogens to modulate expression of estrogen-sensitive genes in rat uterus: estrogenicity profiles and uterotropic activity. J Steroid Biochem Mol Biol 2000; 73: 1 10. [DOI] [PubMed] [Google Scholar]
- Lavoie HA, King SR. Transcriptional regulation of steroidogenic genes: STARD1, CYP11A1 and HSD3B. Exp Biol Med (Maywood) 2009; 234: 880 907. [DOI] [PubMed] [Google Scholar]
- Goldman JM, Murr AS, Cooper RL. The rodent estrous cycle: characterization of vaginal cytology and its utility in toxicological studies. Birth Defects Res B Dev Reprod Toxicol 2007; 80: 84 97. [DOI] [PubMed] [Google Scholar]
- Han BC, Xia HF, Sun J, Yang Y, Peng JP. Retinoic acid-metabolizing enzyme cytochrome P450 26a1 (cyp26a1) is essential for implantation: functional study of its role in early pregnancy. J Cell Physiol 2010; 223: 471 479. [DOI] [PubMed] [Google Scholar]
- Gill S, Barker M, Pulido O. Neuroexcitatory targets in the female reproductive system of the nonhuman primate (Macaca fascicularis). Toxicol Pathol 2008; 36: 478 484. [DOI] [PubMed] [Google Scholar]
- Wu Y, Wang LP, Pan JQ. Nicotinic acetylcholine receptor agonists may be a novel therapy for endometriosis. Med Hypotheses 2011; 77: 745 747. [DOI] [PubMed] [Google Scholar]
- van der Horst PH, Wang Y, van der Zee M, Burger CW, Blok LJ. Interaction between sex hormones and WNT/beta-catenin signal transduction in endometrial physiology and disease. Mol Cell Endocrinol 2012; 358: 176 184. [DOI] [PubMed] [Google Scholar]
- Wang Y, Hanifi-Moghaddam P, Hanekamp EE, Kloosterboer HJ, Franken P, Veldscholte J, van Doorn HC, Ewing PC, Kim JJ, Grootegoed JA, Burger CW, Fodde R, et al. Progesterone inhibition of Wnt/beta-catenin signaling in normal endometrium and endometrial cancer. Clin Cancer Res 2009; 15: 5784 5793. [DOI] [PubMed] [Google Scholar]
- Nei H, Saito T, Yamasaki H, Mizumoto H, Ito E, Kudo R. Nuclear localization of beta-catenin in normal and carcinogenic endometrium. Mol Carcinog 1999; 25: 207 218. [PubMed] [Google Scholar]
- Kao LC, Tulac S, Lobo S, Imani B, Yang JP, Germeyer A, Osteen K, Taylor RN, Lessey BA, Giudice LC. Global gene profiling in human endometrium during the window of implantation. Endocrinology 2002; 143: 2119 2138. [DOI] [PubMed] [Google Scholar]
- Miller C, Pavlova A, Sassoon DA. Differential expression patterns of Wnt genes in the murine female reproductive tract during development and the estrous cycle. Mech Dev 1998; 76: 91 99. [DOI] [PubMed] [Google Scholar]
- Kobayashi A, Behringer RR. Developmental genetics of the female reproductive tract in mammals. Nat Rev Genet 2003; 4: 969 980. [DOI] [PubMed] [Google Scholar]
- Vainio S, Heikkila M, Kispert A, Chin N, McMahon AP. Female development in mammals is regulated by Wnt-4 signalling. Nature 1999; 397: 405 409. [DOI] [PubMed] [Google Scholar]
- Mericskay M, Kitajewski J, Sassoon D. Wnt5a is required for proper epithelial-mesenchymal interactions in the uterus. Development 2004; 131: 2061 2072. [DOI] [PubMed] [Google Scholar]
- Hayashi K, Yoshioka S, Reardon SN, Rucker EB 3rd, Spencer TE, DeMayo FJ, Lydon JP, MacLean JA 2nd. WNTs in the neonatal mouse uterus: potential regulation of endometrial gland development. Biol Reprod 2010; 84: 308 319. [DOI] [PMC free article] [PubMed] [Google Scholar]
- Fukuchi T, Sakamoto M, Tsuda H, Maruyama K, Nozawa S, Hirohashi S. Beta-catenin mutation in carcinoma of the uterine endometrium. Cancer Res 1998; 58: 3526 3528. [PubMed] [Google Scholar]
- Wang Y, van der Zee M, Fodde R, Blok LJ. Wnt/Beta-catenin and sex hormone signaling in endometrial homeostasis and cancer. Oncotarget 2011; 1: 674 684. [DOI] [PMC free article] [PubMed] [Google Scholar]
- Simon L, Spiewak KA, Ekman GC, Kim J, Lydon JP, Bagchi MK, Bagchi IC, DeMayo FJ, Cooke PS. Stromal progesterone receptors mediate induction of Indian Hedgehog (IHH) in uterine epithelium and its downstream targets in uterine stroma. Endocrinology 2009; 150: 3871 3876. [DOI] [PMC free article] [PubMed] [Google Scholar]
- Harman RM, Cowan RG, Ren Y, Quirk SM. Reduced signaling through the hedgehog pathway in the uterine stroma causes deferred implantation and embryonic loss. Reproduction 2011; 141: 665 674. [DOI] [PubMed] [Google Scholar]
- Migone FF, Ren Y, Cowan RG, Harman RM, Nikitin AY, Quirk SM. Dominant activation of the hedgehog signaling pathway alters development of the female reproductive tract. Genesis 2012; 50: 28 40. [DOI] [PubMed] [Google Scholar]
- Polager S, Ginsberg D. p53 and E2f: partners in life and death. Nat Rev Cancer 2009; 9: 738 748. [DOI] [PubMed] [Google Scholar]
- Narayan G, Murty VV. Integrative genomic approaches in cervical cancer: implications for molecular pathogenesis. Future Oncol 2010; 6: 1643 1652. [DOI] [PMC free article] [PubMed] [Google Scholar]
- Tapia A, Vilos C, Marin JC, Croxatto HB, Devoto L. Bioinformatic detection of E47, E2F1 and SREBP1 transcription factors as potential regulators of genes associated to acquisition of endometrial receptivity. Reprod Biol Endocrinol 2011; 9: 14. [DOI] [PMC free article] [PubMed] [Google Scholar]
- Reber M, Cereghini S. Variant hepatocyte nuclear factor 1 expression in the mouse genital tract. Mech Dev 2001; 100: 75 78. [DOI] [PubMed] [Google Scholar]
- Lindner TH, Njolstad PR, Horikawa Y, Bostad L, Bell GI, Sovik O. A novel syndrome of diabetes mellitus, renal dysfunction and genital malformation associated with a partial deletion of the pseudo-POU domain of hepatocyte nuclear factor-1beta. Hum Mol Genet 1999; 8: 2001 2008. [DOI] [PubMed] [Google Scholar]
- Yang S, Fang Z, Suzuki T, Sasano H, Zhou J, Gurates B, Tamura M, Ferrer K, Bulun S. Regulation of aromatase P450 expression in endometriotic and endometrial stromal cells by CCAAT/enhancer binding proteins (C/EBPs): decreased C/EBPbeta in endometriosis is associated with overexpression of aromatase. J Clin Endocrinol Metab 2002; 87: 2336 2345. [DOI] [PubMed] [Google Scholar]
- Olcese J. Circadian aspects of mammalian parturition: a review. Mol Cell Endocrinol 2011; 349: 62 67. [DOI] [PubMed] [Google Scholar]
- Wilson BG, Roberts CW. SWI/SNF nucleosome remodellers and cancer. Nat Rev Cancer 2011; 11: 481 492. [DOI] [PubMed] [Google Scholar]
- Herquel B, Ouararhni K, Davidson I. The TIF1alpha-related TRIM cofactors couple chromatin modifications to transcriptional regulation, signaling and tumor suppression. Transcription 2012; 2: 231 236. [DOI] [PMC free article] [PubMed] [Google Scholar]
- Laz EV, Holloway MG, Chen CS, Waxman DJ. Characterization of three growth hormone-responsive transcription factors preferentially expressed in adult female liver. Endocrinology 2007; 148: 3327 3337. [DOI] [PMC free article] [PubMed] [Google Scholar]
- Korf H, Vander Beken S, Romano M, Steffensen KR, Stijlemans B, Gustafsson JA, Grooten J, Huygen K. Liver X receptors contribute to the protective immune response against Mycobacterium tuberculosis in mice. J Clin Invest 2009; 119: 1626 1637. [DOI] [PMC free article] [PubMed] [Google Scholar]
- Mouzat K, Prod'homme M, Volle DH, Sion B, Dechelotte P, Gauthier K, Vanacker JM, Lobaccaro JM. Oxysterol nuclear receptor LXRbeta regulates cholesterol homeostasis and contractile function in mouse uterus. J Biol Chem 2007; 282: 4693 4701. [DOI] [PubMed] [Google Scholar]
Associated Data
This section collects any data citations, data availability statements, or supplementary materials included in this article.