

ABSTRACT
Fetoplacental endothelial cells are exposed to oxygen levels ranging from 2% to 8% in vivo. However, little is known regarding endothelial function within this range of oxygen because most laboratories use ambient air (21% O2) as a standard culture condition (SCN). We asked whether human umbilical artery endothelial cells (HUAECs) that were steadily exposed to the physiological chronic normoxia (PCN, 3% O2) for ∼20–25 days differed in their proliferative and migratory responses to FGF2 and VEGFA as well as in their global gene expression compared with those in the SCN. We observed that PCN enhanced FGF2- and VEGFA-stimulated cell proliferation and migration. In oxygen reversal experiments (i.e., when PCN cells were exposed to SCN for 24 h and vice versa), we found that preexposure to 21% O2 decreased the migratory ability, but not the proliferative ability, of the PCN-HUAECs in response to FGF2 and VEGFA. These PCN-enhanced cellular responses were associated with increased protein levels of HIF1A and NOS3, but not FGFR1, VEGFR1, and VEGFR2. Microarray analysis demonstrated that PCN up-regulated 74 genes and down-regulated 86, 14 of which were directly regulated by hypoxia-inducible factors as evaluated using in silico analysis. Gene function analysis further indicated that the PCN-regulated genes were highly related to cell proliferation and migration, consistent with the results from our functional assays. Given that PCN significantly alters cellular responses to FGF2 and VEGFA as well as transcription in HUAECs, it is likely that we may need to reexamine the current cellular and molecular mechanisms controlling fetoplacental endothelial functions, which were largely derived from endothelial models established under ambient O2.
Keywords: angiogenesis, artery endothelial cells, growth factors, physiological chronic low oxygen, transcriptome
Chronic low oxygen enhances human endothelial cell proliferation and migration and alters gene expression.
INTRODUCTION
Human pregnancy is associated with dramatic increases in fetoplacental blood flows, which are directly correlated with fetal growth and survival as well as neonatal birth weights and survivability [1, 2]. These increases in placental blood flows primarily result from angiogenesis, vasodilation, and vascular remodeling, and vascular endothelial cells play a central role in all of these processes [3–5]. Placental endothelial cells live in lower O2 environments (∼2%–8% O2 or 15–60 mmHg pO2, ∼2% O2 at ≤8–10 wk of gestation, ∼8% O2 between 8 to 10 wk, and ∼6% O2 at the end of the third trimester) relative to ambient O2 (∼21% or 160 mmHg pO2 at sea level) or mean arterial O2 (∼13% or 100 mmHg pO2 at sea level) [6]. These physiological chronic low O2 levels are believed to be critical for maintaining normal vascular growth and function to support the growing placenta and fetus [7–9]. In contrast, many diseases associated with endothelial dysfunction such as preeclampsia and atherosclerosis-induced chronic ischemia are often accompanied by an even lower pO2 [10–13]. Our current understanding on cellular and molecular mechanisms controlling human fetoplacental endothelial functions, however, is largely derived from umbilical vein endothelial cell models, most of which were established under ambient O2. This ambient O2 level obviously does not closely mimic the environment in which these cells reside in vivo [6]. Thus, establishing fetoplacental endothelial cell models, particularly from artery cells, under the physiological chronic low O2 is of great significance for investigating cellular and molecular mechanisms because information derived from these artery cell models will improve our understanding of fetoplacental endothelial function in physiopathological states.
In addition to O2, various growth factors such as fibroblast growth factor 2 (FGF2) and vascular endothelial growth factor A (VEGFA) also closely mediate endothelial function via activation of their high affinity receptors and downstream signaling cascades [5, 14–16]. Numerous studies have demonstrated that exposing endothelial cells established under ambient O2 to low O2 levels (∼2%–5% O2; 4–120 h) promotes endothelial proliferation and migration [17–20], primarily through elevating the expression of growth factors and their receptors such as VEGFA and VEGFA receptor 2 (VEGFR2) [10, 11].
Recently, we have reported that in human umbilical vein endothelial cells (HUVECs), physiological chronic normoxia (3% O2 for 20–25 days) robustly alters transcriptional profiles and cellular responses compared with those in ambient O2 [21]. However, little is known regarding the physiological normoxia (2%–13% O2) [10, 11] regulation of transcription and the subsequent response to FGF2 and VEGFA in human fetoplacental artery endothelial cells. The investigation of fetoplacental artery endothelial cells is of particular significance because endothelial cells with different origins are extremely heterogeneous in their transcriptional profiles [22], which may lead to distinct cellular morphologies and responses to the same stimuli (e.g., low O2 and growth factors) [5, 23, 24]. For example, placental growth factors-1 and -2 (PlGF-1 and PlGF-2) effectively stimulated cell proliferation in human placental microvascular endothelial cells, but not in HUVECs, while VEGFA and FGF2 similarly induce the proliferation of human placental microvascular endothelial cells and HUVECs [25]. In addition, it has also been shown that hypoxia (1% O2, 24 h) enhances expression and activity of endothelial nitric oxide synthase (NOS3) in aortic endothelial cells [26], whereas hypoxia decreases the total NOS3 protein levels and activity in coronary artery endothelial cells [27]. Thus, assessing cell responses to low O2 and growth factors in endothelial cells of different origins is critical for our better understanding of endothelial and vascular physiology.
Compared with their counterparts HUVECs, human umbilical artery endothelial cells (HUAECs) in vivo are also constantly exposed to O2 that are lower than the ambient O2 level during pregnancy. At term, the O2 level is ∼2.0% (range: 1.1%–2.9%) in the umbilical cord artery, which is lower than the ∼3.5% O2 (range: 2.4%–4.6%) in the umbilical cord vein [28]. To explore the role of physiological chronic low O2 in HUAECs, in this study, we examined the cell proliferation and migration in responses to FGF2 and VEGFA in HUAECs that were expanded continuously under standard cell culture normoxia (21% O2) or under physiological chronic normoxia (3% O2 for ∼20–25 days). We also examined and compared the transcriptional profiles of these HUAECs using microarray analysis.
MATERIALS AND METHODS
An additional methods section is available in the Supplemental Materials and Methods (all the Supplemental Data are available online at www.biolreprod.org).
Reagent and Chemicals
Unless stated otherwise, the reagents and chemicals were purchase from Sigma-Aldrich.
Endothelial Cultures
Human umbilical cords from normal term pregnant patients with no medical complications were collected immediately (≤1 h) after Cesarean section as previously described [21]. The cord collection protocol was approved by the Institutional Review Board of Meriter Hospital and the Health Sciences Institutional Review Boards, University of Wisconsin-Madison. HUAECs were isolated using a standard collagenase enzyme digestion, expanded, and characterized as previously described [20, 21]. Immediately after isolation, cells obtained from the same artery were split equally, cultured, and expanded steadily under standard cell culture normoxia (37°C, 5% CO2, 95% air; designated as SCN) or physiological chronic normoxia (37°C, 5% CO2, 3% O2, 92% N2; designated as PCN) for up to 25 days. The cells were cultured in RPMI 1640 medium (Invitrogen) supplemented with 10% fetal bovine serum (HyClone), 1% penicillin/streptomycin (HyClone), 100 mg/L heparin (EMD Millipore), and 37.5 mg/L endothelial cell growth supplement (Millipore). For the PCN culture and treatments, the media were prepurged with N2 and equilibrated in a hypoxia incubator before being added to the cells. The dissolved O2 in the media was monitored using a dissolved oxygen meter (Mettler Toledo). PCN was also confirmed by determining the cellular protein levels as following: hypoxia inducible factor 1, alpha subunit (HIF1A); BCL2/adenovirus E1B 19 kDa interacting protein 3 (BNIP3); and solute carrier family 2 (facilitated glucose transporter), member 3 (SLC2A3; also termed glucose transporter 3, i.e., GLUT3).
After 3–4 days of culture, the cells were sorted by flow cytometry based on their expression of platelet/endothelial cell adhesion molecule 1 (PECAM 1, also known as CD31). The cell purity was also examined by uptake of 10 μg/ml 1,1′-dioctadecyl-3,3,3′,3′-tetramethyl-indocarbocyanine perchlorate (DiI-Ac-LDL; Biomedical Technologies). At passage one, the cells were subjected to the capillarylike tube formation assay to further confirm their endothelial phenotype. Only the cell preparations in which ≥96% of the cells were positive for CD31, exhibited DiI-Ac-LDL uptake, and were capable of forming capillarylike tube structures were utilized in this study. The cells at passage three (∼15 days after isolation) were used for the microarray study, while cells at passages four to five (∼20–25 days after isolation) were used for all the other studies.
Paired SCN and PCN HUAECs, derived from the same artery were used for all the conducted experiments. All the 3% O2 experiments were performed in a heated oxygen-controlled glove box (Coy Laboratory Products), and the media were prepurged with N2 and equilibrated to 3% O2 before being added to the cells.
Cell Surface Area and Diameter Measurements
The cell surface area and diameter were determined as previously described [21]. Briefly, cells (100 000 cells/well) were seeded in a six-well plate and cultured for 16 h to allow cell attachment. To measure the cell surface area, attached cells at a nonconfluent state were incubated with 1 μM 5-chloromethylfluorescein diacetate (Cell Tracker Green; Invitrogen) at 37°C for 45 min. After washing, the cells were examined under a microscope and cell images were recorded. The cell surface area of each individual cell was analyzed using MetaMorph software (Molecular Devices). To measure the diameter of viable cells, the attached cells were lifted up by trypsin digestion, resuspended in PBS, and stained with trypan blue. The mean cell diameter was determined using an automated cell counter (Countess; Invitrogen).
Cell Proliferation and Migration Assays
A cell proliferation assay was performed using a bromodeoxyuridine (BrdU) kit (EMD Millipore) as previously described [21, 29]. The cells seeded in 96-well plates (8000 cells/well) were cultured for 16 h. After 8 h of serum starvation, the cells were treated with 0, 1, 10, or 100 ng/ml of FGF2 or VEGFA for 16 h, labeled with BrdU for 8 h, and then fixed and probed with anti-BrdU antibody. The signals were detected using a microplate reader (Synergy HT Multi-Mode; BioTek). Cell migration was evaluated using a 24-multiwell FluoroBlok transwell insert system (BD Biosciences) [21, 30]. After 8 h of serum starvation, cells were seeded into inserts, followed by adding 0, 10, or 100 ng/ml of FGF2 or VEGFA in the bottom wells. After 16 h of incubation, calcein acetoxymethyl ester, a fluorescent dye (final concentration 0.5 μg/ml; Invitrogen) was added to the bottom wells and incubated for 30 min. Migrated cells were recorded (four randomly chosen fields/well, average 52 cells/field in the control) under a Nikon inverted microscope (10× objective) connected to a charge-coupled device camera. The cell numbers were counted using Metamorph image analysis software (Molecular Devices). These doses of FGF2 and VEGFA were chosen based on our previous studies on human placental artery endothelial cells [20] and HUVECs [21]. These doses of FGF2 or VEGFA also appear to fall within the range of their physiological concentrations, although the reports on the physiological concentrations of FGF2 and VEGFA in the umbilical artery are limited. For example, Hill et al. [31] have reported that the FGF2 concentration in cord blood at term is ∼2 ng/ml as measured by radioimmunoassay [32], while VEGFA concentration is ∼10 ng/ml [31] or 1.4 ng/ml using the enzyme-linked immunosorbent assay [33]. However, other investigators have observed much low levels of unbound FGF2 (39.75 ± 19.87 pg/ml) and VEGFA (422.83 ± 386.10 pg/ml) in the umbilical artery serum at term as measured using the enzyme-linked immunosorbent assay kit [34]. Thus, the FGF2 and VEGFA levels in the cord blood might be highly variable, possibly depending on the measurement method [35]. To determine the sustainability/reversibility of the SCN- or PCN-programmed cell proliferation and migration, the SCN and PCN cells were cultured under 21% and 3% O2 until reaching confluence and were then switched to 3% and 21% O2 (note: the O2 levels were reversed), respectively, for 1 day, followed by treatments with 10 ng/ml FGF2 and VEGFA and the BrdU and migration assays. All the 3% O2 experiments were conducted in the hypoxic chamber with media preequilibrated to 3% O2.
Microarray Analysis
Microarray hybridization and data analysis were conducted as previously described [21]. Total RNA was extracted from six pairs of cell preparations of SCN and PCN HUAECs (total 12) at 80% confluence using an RNeasy Mini Kit (Qiagen) in conjunction with a Qiagen shredder following the manufacturer's instructions [21, 36]. The total RNA was quantified using a Nanodrop ND-100 spectrophotometer (Nanodrop Technologies). The microarray facility at the University of Wisconsin Biotech Center confirmed the quality and integrity of the RNA using an Agilent RNA6000 NanoChip in the Agilent 2100 Bioanalyzer (Agilent Technologies). Only high-quality RNA samples with an integrity number ∼9.9 (for a range 1–10, 10 is completely intact RNA) were subjected to further microarray analysis. Complementary RNA was synthesized, labeled, and fragmented using the MessageAmp II-biotin enhanced kit (Ambion). Fragmented cRNA (10 μg/sample) was hybridized to Affymetrix U133 plus 2.0 microarray chips (Affymetrix). The chips were processed on Affymetrix GC450 Fluidics station. Data were extracted from GC3000 G7 scanned images using Affymetrix Expression Console software version 1.4. Microarray hybridization and postprocessing were conducted by experienced staff at the Biotech Center. To assess the quality of the entire assay and data analysis, routine quality controls were conducted according to standard Affymetrix protocols, which include visual array inspection, 3′/5′ glyceraldehyde-3-phosphate dehydrogenase (GAPDH) and β-actin ratios, percent present calls, B2 signal, intensity of poly-A RNA and hybridization controls, and background and noise values. A scaling factor was used to correct for variations between gene chips. The signal ratio of 3′ probe sets to 5′ probe sets of genes were calibrated by normalizing to the signal ratio of GAPDH and β-actin.
The microarray data were logged in Gene Expression Omnibus at National Center for Biotechnology Information (GEO access # GSE49958 at www.ncbi.nlm.nih.gov/geo).
Microarray Data Analyses
These data were normalized with Robust Multi-Array Analysis as previously described [21]. EBarrays [37] was applied to identify differentially expressed (DE) genes. Specifically, a gene was identified as a DE gene if its posterior probability of differential expression as assessed by EBarrays exceeded 0.99. This threshold was chosen to set the posterior expected false discovery rate to 1%. A second filter was applied to ensure that the transcripts were expressed at a detectable level. In particular, an up-regulated gene was selected only if all the probe sets in its corresponding condition were deemed present as characterized using the present/absent calls provided by Affymetrix postprocessing software (Microarray Suite Version 5.0).
Hierarchical clustering of the microarray data was performed using the MeV with Pearson correlation [38]. The DE genes were then uploaded to the Ingenuity Pathway Analysis using a manually curated relationship from the literature (www.ingenuity.com).
Quantitative PCR
Quantitative PCR (qPCR) was conducted as previously described [21]. The first strand cDNA was synthesized by SuperScript II reverse transcriptase (Invitrogen) with T7-oligo (dT) 24 primers. Quantitative PCR was performed with SYBR Green I Master (Roche) and primers (Supplemental Table S1) in a Light Cycler 480 (Roche). All the samples were run in triplicate. Negative controls (no template control and no enzyme control) were included in every set of amplification. β-Actin and TATA box binding proteins selected by BestKeeper software [39] were used for normalization. RE-ST2005 software [39, 40] was applied to determine the relative fold change. To determine whether there were statistically significant difference, RE-ST2005 calculated the probability of the alternate hypothesis that the difference between the sample and control groups was only due to chance by performing 50 000 random reallocations of the sample (PCN) and control (SCN) data.
Western Blot Analysis
Western blot analysis was performed as previously described [20, 21]. The cells were lysed by sonication in buffer (50 mM HEPES, 0.1 M NaCl, 10 mM ethylenediaminetetraacetic acid, 4 mM sodium pyrophosphate, 10 mM sodium fluoride, 2 mM sodium orthovanadate [pH 7.5], 1 mM phenylmethylsulfonylfluoride, 1% Triton X-100, 5 μg/ml leupeptin, and 5 μg/ml aprotinin). After centrifugation, the protein concentrations of the supernatant were determined with bovine serum albumin (fraction V) as the standard. The protein samples (20 μg) were separated on SDS-PAGE gels and electrically transferred to polyvinylidene fluoride membranes. The membranes were immunoblotted with the antibody against different targets (Supplemental Table S2). The proteins were visualized using enhanced chemiluminescence reagents (Amersham Biosciences) followed by exposure to chemiluminescence films. The signals were detected using enhanced chemiluminescence or enhanced chemiluminescence-plus reagents (Amersham Biosciences) and recorded using an Epson Perfection 4990 Photo Scanner [21, 29].
Statistical Analyses for All the Studies Other than Microarray Analysis
Data were analyzed using one way analysis of variance, (SigmaStat; Jandel Co.). When an F test was significant, the data were compared with their respective control by Bonferroni multiple comparisons or Student t-test.
RESULTS
Characterization of HUAECs
Several approaches were taken to validate the endothelial phenotype and purity of the HUAECs. We observed that both SCN and PCN HUAECs exhibited a typical cobblestone morphology at confluence, showed uptake of DiI-Ac-LDL (≥99%), expressed CD31 (≥95%) (not shown), and formed capillarylike tube structures (Supplemental Fig. S1A), confirming the establishment of a highly pure population of HUAECs.
Cell Surface Area and Diameter Measurements
The mean cell surface area of an attached PCN cell (637 ± 35 μm2) was significantly (P < 0.05) smaller than that of a SCN cell (853 ± 57 μm2); however, the mean diameter of a single cell in suspension was similar between the SCN and PCN HUAECs (13.9 vs. 14.0 μm; Supplemental Fig. S1, B and C). These data suggest that although the mean volumes of single PCN and SCN cells are comparable, the attached SCN cells are more spread out in the cell culture on the polystyrene surface. This finding also clearly indicates the morphological adaptations of the endothelial cells to the different O2 levels.
Cell Proliferation and Migration
To determine the role of PCN in artery endothelial function, cell proliferation and migration assays were performed. We observed that FGF2 and VEGFA promoted (P < 0.05) SCN and PCN cell proliferation (Fig. 1, A and B). Importantly, PCN further enhanced (P < 0.05) the FGF2- and VEGFA-stimulated cell proliferation up to 2-fold (Fig. 1, A and B). To test where an acute O2 fluctuation could affect endothelial proliferation, PCN and SCN cells were reversely cultured in 20% and 3% O2, respectively, for 1 day. Interestingly, preexposure of SCN cells to 3% O2 for 1 day slightly but not significantly enhanced the FGF2-stimulated cell proliferation; however this exposure significantly (P < 0.05) promoted the VEGFA- stimulated cell proliferation (by ∼0.6-fold; Fig. 1, C and D). In contrast, preexposure of PCN cells to 21% O2 for 1 day did not alter either the FGF2- or VEGFA-stimulated cell proliferation (Fig. 1, C and D).
FIG. 1.
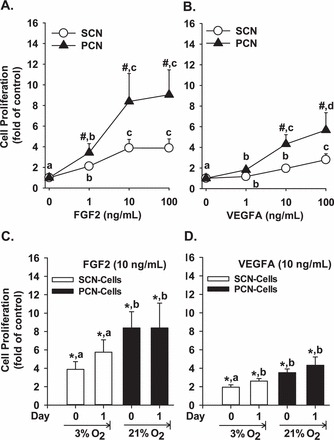
FGF2- and VEGFA-stimulated SCN and PCN cell proliferation. A, B) SCN and PCN cells were cultured in 21% and 3% O2, respectively. C, D) SCN and PCN cells were preincubated in 3% and 21% O2, respectively, for 24 h (note: the O2 levels were reversed). After serum starvation, cells were treated with 10 ng/ml of FGF2 and VEGFA followed by the BrdU proliferation assays. Data are expressed as the means ± SEM fold change of the no growth factor control. #Differ from SCN at each corresponding dose (P < 0.05). *Differ from the corresponding no growth factor control. a,b,c,d Means with different letters differ from each other in SCN or PCN cells (A–D) (P < 0.05); n = 6 pairs of cell preparations.
Both FGF2 and VEGFA also stimulated (P < 0.05) the SCN and PCN cell migration, while PCN further promoted (P < 0.05) the FGF2- (1.4- and 1.5-fold of SCN for 10 and 100 ng/ml of FGF2, respectively) and VEGFA-induced (3.3- and 2.7-fold of SCN for 10 and 100 ng/ml of VEGFA) cell migration (Fig. 2 and Supplemental Fig. S2). Preculturing SCN cells in 3% O2 for 1 day further promoted (P < 0.05) the FGF2-stimulated SCN cell migration (0.6-fold) and VEGFA-stimulated SCN cell migration (0.5-fold), while preculturing PCN cells in 21% O2 attenuated (P < 0.05) the FGF2-stimulated PCN cell migration (0.8-fold) and VEGFA-stimulated PCN cell migration (1.1-fold) (Fig. 2, C and D).
FIG. 2.
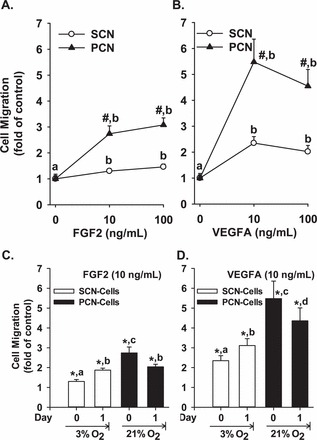
FGF2- and VEGFA-stimulated SCN and PCN cell migration. A, B) SCN and PCN cells were cultured in 21% and 3% O2 respectively. C, D) SCN and PCN cells were preincubated in 3% and 21% O2, respectively, for 24 h (note: the O2 levels were reversed). After serum starvation, cells were treated with FGF2 and VEGFA, followed by the migration assays. Data are expressed as the means ± SEM fold change of the no growth factor control. #Differ from SCN at each corresponding dose (P < 0.05). *Differ from the corresponding no growth factor control. a,b,c,d Means with different letters differ from each other in SCN or PCN cells (A–D) (P < 0.05); n = 6 pairs of cell preparations.
These results clearly show that PCN indeed enhances cell proliferation and migration in response to FGF2 and VEGFA and that such O2-programmed effects are relatively stable, particularly for cell proliferation. HUAECs proliferation is more sensitive to FGF2 than to VEGFA (Fig. 1), whereas HUAECs migration is more sensitive to VEGFA than to FGF2 (Fig. 2 and Supplemental Fig. S2). For example, FGF2 increased the PCN cell proliferation by ∼8.4-fold, whereas VEGFA did so by only ∼3.5-fold. Conversely, VEGFA induced a 5.5-fold increase in PCN cell migration, whereas while FGF2 caused only a 2.7-fold elevation.
Microarray Analysis
To examine whether PCN changes the global gene expression profiles of HUAECs relative to those in SCN, microarray analysis was conducted. Two-dimensional hierarchical clustering of DE genes and individual cell preparations demonstrated that the expression signatures were similar among the different cell preparations within each culture condition, but the expression signatures varied greatly between SCN and PCN HUAECs (Fig. 3A). Compared with SCN, PCN up-regulated 74 genes and down-regulated 86 (Tables 1 and Supplemental Table S3). Ingenuity pathway analysis (IPA) for these DE genes revealed a prominent enrichment of genes relevant to cellular movement, development, cellular growth and proliferation, cell death and survival, and cell morphology (Fig. 3B and Supplemental Table S4). These data indicate that PCN robustly alters global gene profiles, shifting the equilibrium in cellular function. For instance, IPA demonstrated that PCN enhanced cell viability but inhibited cellular sprouting as predicated by the positive and negative z-score, respectively (Supplemental Table S4). Literature mining by IPA further predicted that out of a total of 160 DE genes, 14 genes (8.8%) were regulated by hypoxia inducible factors (HIF) (Fig. 3C). Thus, PCN induces dramatic changes in the HUAECs transcriptional profiles compared with those in SCN, and these changes are highly relevant to several critical cell functions (e.g., cell proliferation and migration). Furthermore, the majority of these PCN-induced DE genes in HUAECs are not directly regulated by HIF.
FIG. 3.
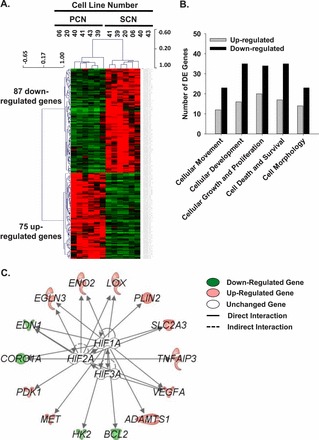
Microarray analyses of PCN-regulated genes relative to SCN. A) Unsupervised two-dimensional hierarchical clustering (Pearson correlation) of the probe sets. B) Ingenuity pathway analysis of the cellular functions of PCN-induced DE genes relative to SCN. C) Literature mining of DE genes regulated by HIF. ADAMTS1: ADAM metallopeptidase with thrombospondin type 1 motif, 1; BCL2: B-cell CLL/lymphoma 2; CORO1A: coronin, actin binding protein, 1A; EDN1: endothelin 1; EGLN3: egl nine homolog 3 (Caenorhabditis elegans); ENO2: enolase 2 (gamma, neuronal); HK2: hexokinase 2; LOX: lysyl oxidase; MET: met proto-oncogene (hepatocyte growth factor receptor); PDK1: pyruvate dehydrogenase kinase, isozyme 1; PLIN2: perilipin 2; SLC2A3: solute carrier family 2 (facilitated glucose transporter), member 3; TNFAIP3: tumor necrosis factor, alpha-induced protein 3; VEGFA: vascular endothelial growth factor A.
TABLE 1.
PCN-induced DE genes with fold changes ≥ 2 in HUAECs.a
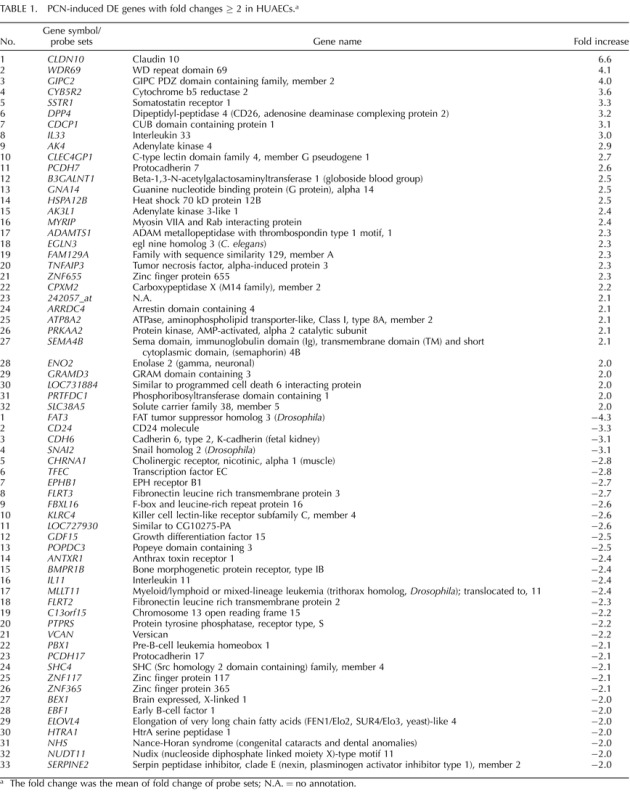
The fold change was the mean of fold change of probe sets; N.A. = no annotation.
To verify the microarray result, qPCR analysis was conducted for a total of nine genes (eight DE and one unchanged gene) (Fig. 4A). All nine genes exhibited changes similar to those found in the microarray analysis (R2 = 0.81; Fig. 4B), indicating that the microarray data accurately predicted the PCN-induced fold change in mRNA. To further verify the microarray results, 10 proteins were examined by Western blot analysis. We observed that 8 out of 10 proteins displayed changes similar to their mRNA counterparts; both the mRNA and protein levels of CDCP1, BNIP3, and SLC2A3 were increased in PCN cells relative to those in SCN cells, and both the mRNA and protein levels of HIF2A, FGFR1, VEGFR1, VEGFR2, and β-actin were similar between PCN and SCN cells. By contrast, PCN elevated the levels of NOS3 and HIF1A protein, but not mRNA compared with those for SCN. These discordances between protein and mRNA levels are believed to be due to posttranscriptional modification of proteins [41] as previously described [10, 11, 42–44].
FIG. 4.
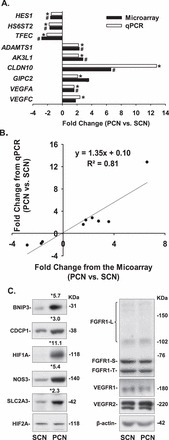
Quantitative PCR and Western blot analyses. A, B) Comparison and correlation between qPCR and microarray data. Data are expressed as the mean fold change of SCN. *,#Differ from SCN for each analysis (P < 0.05, n = 6 cell preparations). ADAMTS1: ADAM metallopeptidase with thrombospondin type 1 motif, 1; AK3L1: adenylate kinase 3-like 1; CLDN10: claudin 10; GIPC2: GIPC PDZ domain containing family, member 2; VEGFA: vascular endothelial growth factor A; VEGFC: vascular endothelial growth factor C. HES1: hairy and enhancer of split 1; HS6ST2: heparan sulfate 6-O-sulfotransferase 2; TFEC: transcription factor EC. C) Western blot analysis of PCN-induced DE and unchanged genes. Data normalized to β-actin are expressed as the mean fold change of SCN as indicated. *Differ from SCN (P < 0.05, n = 4). BNIP3: BCL2/adenovirus E1B 19kDa interacting protein 3; CDCP1: CUB domain containing protein 1; FGFR1-L: fibroblast growth factor receptor 1 (FGFR1)-long form; FGFR1-S, FGFR1-short form; FGFR1-T: FGFR1-truncated form; HIF1A: hypoxia inducible factor 1, alpha subunit; HIF2A: hypoxia inducible factor 2, α subunit; NOS3: nitric oxide synthase 3, endothelial cell; SLC2A3: solute carrier family 2 (facilitated glucose transporter), member 3; VEGFR1: VEGF receptor 1; VEGFR2: VEGF receptor 2.
PCN did increase mRNA levels of VEGFA (Supplemental Table S3) but did not significantly alter either the FGF2, FGFR1, VEGFR1, or VEGFR2 mRNA levels (not shown) or the FGFR1, VEGFR1, and VEGFR2 protein levels (Fig. 2C). Moreover, 91% of the FGFR1 probe sets were present, whereas 91% probe sets for FGFR2, 75% of FGFR3, and 100% for FGFR4 were absent, implying that FGFR1 is the major FGF receptor in HUAECs, a finding that is similar to the situation in HUVECs [21].
DISCUSSION
In this study, we have established HUAECs models in vitro under a physiological O2 level [6] and provided clear evidence showing that PCN drastically enhances FGF2- and VEGFA-induced cell proliferation and migration and alters the transcriptional profiles in human fetoplacental artery endothelial cells. These PCN-enhanced cellular responses are accompanied by increased expression of HIF1A but without increases in HIF2A and the major FGF and VEGFA receptors. Thus, given that endothelial cells usually live under PCN in vivo, these PCN HUAECs likely represent unique human fetoplacental artery endothelial models that more closely reflect in vivo states.
Recently, the importance of the physiological chronic low O2 level has begun to be recognized as a key factor to consider in cell culture models [21, 45–48]. For instance, the derivation and expansion of human embryonic stem cells in physiological normoxia (∼5% O2) aid in maintaining cellular pluripotency and suppressing spontaneous cellular differentiation while they enhance the production efficiency of human cardiac stem cells and cell potency for myocardial repair [47]. Similarly, HUVECs cultured and expanded in 3% O2 exhibit dramatic alterations in their transcriptional profiles and substantial increases in their cellular responses to FGF2 and VEGFA relative to those of HUVECs derived in ambient O2 [21]. Together with the current observations in HUAECs, these findings clearly indicate that the physiological chronic low O2 level is indeed critical in the modulation of proliferation and migration of endothelial cells in fetoplacental artery and vein, especially because even an acute O2 elevation may dampen cell proliferation and/or migration (Fig. 2, C and D) [21].
A follow-up question we addressed herein is whether these PCN-enhanced cell responses are mediated via increasing the expression of growth factors and their receptors, all of which are considered to be the hallmarks for the hypoxia regulation of endothelial cells [10, 11]. Although PCN enhanced the VEGFA mRNA, PCN did not increase the mRNA and/or protein expression of FGF2, FGFR1, VEGFR1, and VEGFR2 (Fig. 4C). Thus, although increased VEGFA expression may partially contribute to the PCN-enhanced HUAECs responses to VEGFA, the elevated expression of these growth factor receptors in HUAECs is unlikely to have a major effect on these PCN-enhanced cellular responses, and other mechanisms must be involved. One such mechanism could occur via increased activation of these receptors, followed by enhanced activation of protein kinases as occurs in HUVECs [21]. In contrast, altering expression of certain genes that are either stimulatory or inhibitory to these cell responses may lead to these PCN-enhanced angiogenic responses. Examples of these genes may include ADAMTS1, a matrix metalloproteinase protein that was up-regulated in PCN (Table 1), and HES1, which was down-regulated in PCN (Supplemental Table S3) because ADAMTS1 promotes the proliferation and migration of HUVEC under hypoxic conditions [49] and HES1 inhibits the proliferation of human microvascular endothelial cells and human iliac artery endothelial cells [50].
One of the key findings from the current study is that acutely (up to 24 h) increasing the O2 levels significantly inhibited FGF2- and VEGFA-induced PCN cell migration but not proliferation; in contrast acutely (up to 24 h) decreasing the O2 levels promoted the FGF2- and VEGF-induced SCN cell proliferation and migration. Although such extreme changes in O2 may never occur within the placenta in vivo, these findings suggest that the FGF2- and VEGFA-stimulated migration of PCN cells is much more sensitive to O2 fluctuation than proliferation. More importantly, these observations indicate that an acute decrease in O2 from a hyperoxic to a more physiological level can benefit endothelial proliferation and migration, two essential steps of neovascularization; however, even an acute increase in O2 from a physiological to a hyperoxic level could significantly dampen endothelial migration.
Mammalian cells are believed to mainly sense decreases through HIF, in which HIF1A is the major isoform responsible for such sensitivity and for the initiation of subsequent cellular responses [10, 11]. Intriguingly, IPA predicated that 8.8% of the PCN-induced DE genes in HUAECs are directly regulated by HIF1A, HIF2A, and HIF3A (Fig. 1C). These percentages of HIF-regulated DE genes in HUAECs appear to be much lower than the percentage of genes (∼30%, 570 out of 1719 DE genes) reported to be directly regulated by HIF1A in human pulmonary artery endothelial cells (HPAECs) [51] that were expanded in ambient O2 followed by exposure to 1% O2 for 24 h or overexpressing a constitutively active form of HIF1A. In these 570 HIF1A-regulated genes in HPAECs, only seven genes overlap with those identified in HUAECs (EDN1, EGLN3, ENO2, LOX, SLC2A3, TNFAIP3, and VEGFA; Fig. 3C). It is plausible that these differences can be largely attributed to distinctions in cell origins, culture conditions including different O2 levels (1% vs. 3%), and/or microarray analysis methodologies. However, these findings also suggest that those cells cultured and expanded in ambient O2 are more sensitive to O2 regulators. By contrast, HIF1A might be partially transcriptional insensitive because it is maintained at a relatively high level in the PCN HUAECs. Thus, factors other than HIF must be responsible for the altered expression of these non-HIF-regulated DE genes. In this regard, the participation of two transcription factors, Myc and JUN, in such regulation has been reported [52, 53]. In addition, the expression of these non-HIF-regulated DE genes could be controlled via epigenetic mechanisms. For example, the DNA methyltransferase 3 alpha (DNMT3A), an enzyme that methylates cytosine in the genome causing gene silencing, is upregulated in PCN HUAECs (Supplemental Table S3). Specific histone codes and micro-RNAs may also be involved in such regulation [54, 55]. For example, exposing HUVECs to 1% O2 for 24 h can induce histone acetylation and methylation in the gene promoter [54].
In conclusion, the current study has clearly demonstrated that similar to HUVECs [21], PCN also programs HUAECs to undergo remarkable changes in cell proliferation and migration in responses to FGF2 and VEGFA and the global gene expression. These data further support the notion that we may have to reevaluate most, if not all, cellular and molecular mechanisms governing endothelial growth and function, which has also been indicated in other types of cells [21, 45–48], using endothelial models cultured and expanded under PCN.
Supplementary Material
ACKNOWLEDGMENT
We thank Dr. Ronald R. Magness from Department of Obstetrics and Gynecology, University of Wisconsin, Madison, for critically reading and editing this manuscript.
Footnotes
Supported in part by National Institutes of Health grants PO1 HD38843 to R.R. Magness and J.Z.; a Department of Ob/Gyn R & D Grant, University of Wisconsin-Madison, to J.Z.; R01 HL74947& HL70562 to D.B.C.; and the National Science Foundation of China No. 81100429 and Shanghai Natural Science Foundation No.11 ZR1428700 to K.W. The microarray data were logged in Gene Expression Omnibus at National Center for Biotechnology Information (GEO access no. GSE49958 at www.ncbi.nlm.nih.gov/geo).
REFERENCES
- Reynolds LP, Redmer DA. Angiogenesis in the placenta. Biol Reprod 2001; 64: 1033–1040. [DOI] [PubMed] [Google Scholar]
- Benirschke K, Kaufmann P, Baergen BN. Anatomy and pathology of the umbilical cord. : Benirschke K, Kaufmann P, Baergen BN. (eds.), Pathology of the Human Placenta. 5th ed. New York: Springer; 2006: 380–451. [Google Scholar]
- Magness RR, Zheng J. Circulatory changes during gestation. : Gluckman PD, Heymann MA. (eds.), Pediatric and Perinatal Medicine: The Scientific Basis. London: Edward Arnold Publishers; 1996: 762–772. [Google Scholar]
- Osol G, Mandala M. Maternal uterine vascular remodeling during pregnancy. Physiology (Bethesda) 2009; 24: 58–71. [DOI] [PMC free article] [PubMed] [Google Scholar]
- Wang K, Zheng J. Signaling regulation of fetoplacental angiogenesis. J Endo 2012; 212: 243–255. [DOI] [PMC free article] [PubMed] [Google Scholar]
- Rodesch F, Simon P, Donner C, Jauniaux E. Oxygen measurements in endometrial and trophoblastic tissues during early pregnancy. Obstet Gynecol 1992; 80: 283–285. [PubMed] [Google Scholar]
- Wareing M, Greenwood SL, Baker PN. Reactivity of human placental chorionic plate vessels is modified by level of oxygenation: differences between arteries and veins. Placenta 2006; 27: 42–48. [DOI] [PubMed] [Google Scholar]
- Zamudio S. High-altitude hypoxia and preeclampsia. Front Biosci 2007; 12: 2967–2977. [DOI] [PMC free article] [PubMed] [Google Scholar]
- Mayhew TM. Changes in fetal capillaries during preplacental hypoxia: growth, shape remodelling and villous capillarization in placentae from high-altitude pregnancies. Placenta 2003; 24: 191–198. [DOI] [PubMed] [Google Scholar]
- Pugh CW, Ratcliffe PJ. Regulation of angiogenesis by hypoxia: role of the HIF system. Nat Med 2003; 9: 677–684. [DOI] [PubMed] [Google Scholar]
- Semenza GL. Hypoxia-inducible factors in physiology and medicine. Cell 2012; 148: 399–408. [DOI] [PMC free article] [PubMed] [Google Scholar]
- Burton GJ, Reshetnikova OS, Milovanov AP, Teleshova OV. Stereological evaluation of vascular adaptations in human placental villi to differing forms of hypoxic stress. Placenta 1996; 17: 49–55. [DOI] [PubMed] [Google Scholar]
- Savransky V, Nanayakkara A, Li J, Bevans S, Smith PL, Rodriguez A, Polotsky VY. Chronic intermittent hypoxia induces atherosclerosis. Am J Respir Crit Care Med 2007; 175: 1290–1297. [DOI] [PMC free article] [PubMed] [Google Scholar]
- Ferrara N, Gerber HP, LeCouter J. The biology of VEGF and its receptors. Nat Med 2003; 9: 669–676. [DOI] [PubMed] [Google Scholar]
- Podar K, Anderson KC. The pathophysiologic role of VEGF in hematologic malignancies: therapeutic implications. Blood 2005; 105: 1383–1395. [DOI] [PubMed] [Google Scholar]
- Turner N, Grose R. Fibroblast growth factor signaling: from development to cancer. Nat Rev Cancer 2010; 10: 116–129. [DOI] [PubMed] [Google Scholar]
- Humar R, Kiefer FN, Berns H, Resink TJ, Battegay EJ. Hypoxia enhances vascular cell proliferation and angiogenesis in vitro via rapamycin (mTOR)-dependent signaling. FASEB J 2002; 16: 771–780. [DOI] [PubMed] [Google Scholar]
- Meininger CJ, Schelling ME, Granger HJ. Adenosine and hypoxia stimulate proliferation and migration of endothelial cells. Am J Physiol 1988; 255: H554–H562. [DOI] [PubMed] [Google Scholar]
- Phillips PG, Birnby LM, Narendran A. Hypoxia induces capillary network formation in cultured bovine pulmonary microvessel endothelial cells. Am J Physiol 1995; 268: L789–L800. [DOI] [PubMed] [Google Scholar]
- Wang K, Jiang YZ, Chen DB, Zheng J. Hypoxia enhances FGF2- and VEGFA-stimulated human placental artery endothelial cell proliferation: roles of MEK1/2/ERK1/2 and PI3K/AKT pathways. Placenta 2009; 30: 1045–1051. [DOI] [PMC free article] [PubMed] [Google Scholar]
- Jiang YZ, Wang K, Li Y, Dai CF, Wang P, Kendziorski C, Chen DB, Zheng J. Transcriptional and functional adaptations of endothelial cells to physiological chronic low oxygen. Biol Reprod 2013; 88: 114. [DOI] [PMC free article] [PubMed] [Google Scholar]
- Chi JT, Chang HY, Haraldsen G, Jahnsen FL, Troyanskaya OG, Chang DS, Wang Z, Rockson SG, van de Rijn M, Botstein D, Brown PO. Endothelial cell diversity revealed by global expression profiling. Proc Natl Acad Sci U S A 2003; 100: 10623–10628. [DOI] [PMC free article] [PubMed] [Google Scholar]
- Aitsebaomo J, Portbury AL, Schisler JC, Patterson C. Brothers and sisters: molecular insights into arterial-venous heterogeneity. Circ Res 2008; 103: 929–939. [DOI] [PMC free article] [PubMed] [Google Scholar]
- Rocha SF, Adams RH. Molecular differentiation and specialization of vascular beds. Angiogenesis 2009; 12: 139–147. [DOI] [PubMed] [Google Scholar]
- Lang I, Pabst MA, Hiden U, Blaschitz A, Dohr G, Hahn T, Desoye G. Heterogeneity of microvascular endothelial cells isolated from human term placenta and macrovascular umbilical vein endothelial cells. Eur J Cell Biol 2003; 82: 163–173. [DOI] [PubMed] [Google Scholar]
- Min J, Jin YM, Moon JS, Sung MS, Jo SA, Jo I. Hypoxia-induced endothelial NO synthase gene transcriptional activation is mediated through the tax-responsive element in endothelial cells. Hypertension 2006; 47: 1189–1196. [DOI] [PubMed] [Google Scholar]
- Olszewska-Pazdrak B, Hein TW, Olszewska P, Carney DH. Chronic hypoxia attenuates VEGF signaling and angiogenic responses by downregulation of KDR in human endothelial cells. Am J Physiol Cell Physiol 2009; 296: C1162–C1170. [DOI] [PubMed] [Google Scholar]
- Matsuo K, Malinow AM, Harman CR, Baschat AA. Decreased placental oxygenation capacity in pre-eclampsia: clinical application of a novel index of placental function preformed at the time of delivery. J Perinat Med 2009; 37: 657–661. [DOI] [PubMed] [Google Scholar]
- Jobe SO, Ramadoss J, Koch JM, Jiang YZ, Zheng J, Magness RR. Estradiol-17β and its cytochrome P450- and catechol-O-methyltransferase-derived metabolites stimulate proliferation in uterine artery endothelial cells: role of estrogen receptor-alpha versus estrogen receptor-beta. Hypertension 2010; 55: 1005–1011. [DOI] [PMC free article] [PubMed] [Google Scholar]
- Dai DF, Jiang YZ, Li Y, Wang K, Liu PS, Patankar MS, Zheng J. Expression and roles of the Slit/Robo in human ovarian cancer. Histochem Cell Biol 2011; 135: 475–485. [DOI] [PMC free article] [PubMed] [Google Scholar]
- Hill DJ, Tevaarwerk GJ, Arany E, Kilkenny D, Gregory M, Langford KS, Miell J. Fibroblast growth factor-2 (FGF-2) is present in maternal and cord serum, and in the mother is associated with a binding protein immunologically related to the FGF receptor-1. J Clin Endocrinol Metab 1995; 80: 1822–1831. [DOI] [PubMed] [Google Scholar]
- Baker PN, Krasnow J, Roberts JM, Yeo KT. Elevated serum levels of vascular endothelial growth factor in patients with preeclampsia. Obstet Gynecol 1995; 86: 815–821. [DOI] [PubMed] [Google Scholar]
- Galazios G, Papazoglou D, Giagloglou K, Vassaras G, Koutlaki N, Maltezos E. Umbilical cord serum vascular endothelial growth factor (VEGF) levels in normal pregnancies and in pregnancies complicated by preterm delivery or pre-eclampsia. Int J Gynaecol Obstet 2004; 85: 6–11. [DOI] [PubMed] [Google Scholar]
- Wallner W, Sengenberger R, Strick R, Strissel PL, Meurer B, Beckmann MW, Schlembach D. Angiogenic growth factors in maternal and fetal serum in pregnancies complicated by intrauterine growth restriction. Clin Sci (Lond) 2007; 112: 51–57. [DOI] [PubMed] [Google Scholar]
- Jelkmann W. Pitfalls in the measurement of circulating vascular endothelial growth factor. Clin Chem 2001; 47: 617–623. [PubMed] [Google Scholar]
- Chung JY, Song Y, Wang Y, Magness RR, Zheng J. Differential expression of vascular endothelial growth factor (VEGF), endocrine gland derived-VEGF, and VEGF receptors in human placentas from normal and preeclamptic pregnancies. J Clin Endocrinol Metab 2004; 89: 2484–2490. [DOI] [PMC free article] [PubMed] [Google Scholar]
- Newton MA, Kendziorski CM. Parametric empirical Bayes methods for microarrays. : Parmigiani G, ES Garrett, Irizarry R, Zeger SL. (eds.), The Analysis of Gene Expression Data: Methods and Software. New York: Springer Verlag; 2003: 254–271. [Google Scholar]
- Saeed AI, Bhagabati NK, Braisted JC, Liang W, Sharov V, Howe EA, Li J, Thiagarajan M, White JA, Quackenbush J. TM4 microarray software suite. Methods Enzymol 2006; 411: 134–193. [DOI] [PubMed] [Google Scholar]
- Pfaffl MW, Tichopad A, Prgomet C, Neuvians TP. Determination of stable housekeeping genes, differentially regulated target genes and sample integrity: BestKeeper–Excel-based tool using pair-wise correlations. Biotechnol Lett 2004; 26: 509–515. [DOI] [PubMed] [Google Scholar]
- Pfaffl MW. HorganGW, Dempfle L. Relative expression software tool (REST) for group-wise comparison and statistical analysis of relative expression results in real-time PCR. Nucleic Acids Res 2002; 30: e36. [DOI] [PMC free article] [PubMed] [Google Scholar]
- de Sousa Abreu R, Penalva LO, Marcotte EM, Vogel C. Global signatures of protein and mRNA expression levels. Mol Biosyst 2009; 5: 1512–1526. [DOI] [PMC free article] [PubMed] [Google Scholar]
- Rajakumar A, Conrad KP. Expression, ontogeny, and regulation of hypoxia-inducible transcription factors in the human placenta. Biol Reprod 2000; 63: 559–569. [DOI] [PubMed] [Google Scholar]
- Rajakumar A, Whitelock KA, Weissfeld LA, Daftary AR, Markovic N, Conrad KP. Selective overexpression of the hypoxia-inducible transcription factor, HIF-2α, in placentas from women with preeclampsia. Biol Reprod 2001; 64: 499–506. [DOI] [PubMed] [Google Scholar]
- Rajakumar A, Whitelock KA, Weissfeld LA, Daftary AR, Markovic N, Conrad KP. Selective overexpression of the hypoxia-inducible transcription factors in placentas from women with preeclampsia [Erratum]. Biol Reprod 2001; 64: 1019–1020. [DOI] [PubMed] [Google Scholar]
- Atkuri KR, Herzenberg LA, Herzenberg LA. Culturing at atmospheric oxygen levels impacts lymphocyte function. Proc Natl Acad Sci U S A 2005; 102: 3756–3759. [DOI] [PMC free article] [PubMed] [Google Scholar]
- Atkuri KR, Herzenberg LA, Niemi AK, Cowan T, Herzenberg LA. Importance of culturing primary lymphocytes at physiological oxygen levels. Proc Natl Acad Sci U S A 2007; 104: 4547–4552. [DOI] [PMC free article] [PubMed] [Google Scholar]
- Lengner CJ, Gimelbrant AA, Erwin JA, Cheng AW, Guenther MG, Welstead GG, Alagappan R, Frampton GM, Xu P, Muffat J, Santagata S, Powers D. et al. Derivation of pre-X inactivation human embryonic stem cells under physiological oxygen concentrations. Cell 2010; 141: 872–883. [DOI] [PubMed] [Google Scholar]
- Li TS, Cheng K, Malliaras K, Matsushita N, Sun B, Marbán L, Zhang Y, Marbán E. Expansion of human cardiac stem cells in physiological oxygen improves cell production efficiency and potency for myocardial repair. Cardiovas Res 2011; 89: 157–165. [DOI] [PMC free article] [PubMed] [Google Scholar]
- Hatipoglu OF, Hirohata S, Cilek MZ, Ogawa H, Miyoshi T, Obika M, Demircan K, Shinohata R, Kusachi S, Ninomiya Y. ADAMTS1 is a unique hypoxic early response gene expressed by endothelial cells. J Biol Chem 2009; 284: 16325–16333. [DOI] [PMC free article] [PubMed] [Google Scholar]
- Liu ZJ, Xiao M, Balint K, Soma A, Pinnix CC, Capobianco AJ, Velazquez OC, Herlyn M. Inhibition of endothelial cell proliferation by Notch1 signaling is mediated by repressing MAPK and PI3K/Akt pathways and requires MAML1. FASEB J 2006; 20: 1009–1011. [DOI] [PubMed] [Google Scholar]
- Manalo DJ, Rowan A, Lavoie T, Natarajan L, Kelly BD, Ye SQ, Garcia JG, Semenza GL. Transcriptional regulation of vascular endothelial cell responses to hypoxia by HIF-1. Blood 2005; 105: 659–669. [DOI] [PubMed] [Google Scholar]
- Webb JD, Coleman ML, Pugh CW. Hypoxia, hypoxia-inducible factors (HIF), HIF hydroxylases and oxygen sensing. Cell Mol Life Sci 2009; 66: 3539–3554. [DOI] [PMC free article] [PubMed] [Google Scholar]
- Mense SM, Sengupta A, Zhou M, Lan C, Bentsman G, Volsky DJ, Zhang L. Gene expression profiling reveals the profound upregulation of hypoxia-responsive genes in primary human astrocytes. Physiol Genomics 2006; 25: 435–449. [DOI] [PubMed] [Google Scholar]
- Fish JE, Yan MS, Matouk CC, St Bernard R, Ho JJ, Gavryushova A, Srivastava D, Marsden PA. Hypoxic repression of endothelial nitric-oxide synthase transcription is coupled with eviction of promoter histones. J Biol Chem 2010; 285: 810–826. [DOI] [PMC free article] [PubMed] [Google Scholar]
- Crosby ME, Devlin CM, Glazer PM, Calin GA, Ivan M. Emerging roles of microRNAs in the molecular responses to hypoxia. Curr Pharm Des 2009; 15: 3861–3866. [DOI] [PubMed] [Google Scholar]
Associated Data
This section collects any data citations, data availability statements, or supplementary materials included in this article.