

ABSTRACT
Placental hypoperfusion causes cellular hypoxia and is associated with fetal growth restriction and preeclampsia. In response to hypoxia, the repertoire of genes expressed in placental trophoblasts changes, which influences key cellular processes such as differentiation and fusion. Diverse miRNAs were recently found to modulate the cellular response to hypoxia. Here we show that miR-424, which was previously shown to be upregulated by hypoxia in nontrophoblastic cell types, is uniquely downregulated in primary human trophoblasts by hypoxia or chemicals known to hinder cell differentiation. We also identify FGFR1 as a direct target of miR-424 in human trophoblasts. This effect is unique to miR-424 and is not seen with other members of this miRNA family that are expressed in trophoblasts, such as miR-15 and miR-16. Our findings establish a unique role for miR-424 during differentiation of human trophoblasts.
Keywords: FGFR1, hypoxia, microRNA, miR-424, trophoblasts
MicroRNA-424 expression is associated with differentiation of human placental trophoblasts.
INTRODUCTION
Hypoperfusion, and the consequent cellular hypoxia, is one of the most common injuries to the placenta during human pregnancy [1, 2]. Hypoxia affects many molecular and cellular pathways, including the differentiation and function of placental trophoblasts. Thus, hypoxia may impact the maternal-fetal exchange interface, adversely influencing fetal growth.
As a part of our ongoing effort to better define the molecular mechanisms underlying trophoblast adaptation to injury, we recently focused on the expression of microRNAs (miRNAs) in placental trophoblasts exposed to hypoxia. MicroRNAs are small, noncoding RNAs that regulate gene expression at the posttranscriptional level through binding to partially complementary sequences in the 3′UTR of protein-coding mRNAs, causing translation inhibition and mRNA decay (review in [3]). MicroRNA pathways have emerged as important regulators of many cellular processes, and their aberrant expression has been associated with numerous pathological states [4–8]. High-throughput miRNA surveys have shown that placental trophoblasts express unique patterns of miRNAs [9–13]. The function of most of these trophoblastic miRNAs remains unknown, with only a few miRNAs associated with abnormal placentas derived from complicated pregnancies [14–17].
We recently identified a set of differentially regulated miRNAs in human primary trophoblasts that were exposed to hypoxic stress [18]. Among these miRNAs, we found that miR-424 is one of the only species that was downregulated in hypoxia. MicroR-424 is a mammalian-specific miRNA that is particularly abundant in placental trophoblasts [11, 12], and recent studies indicate that abundance is a critical determinant of the biological activity of miRNAs [19, 20]. MicroR-424 is known to regulate important cellular functions, including differentiation, proliferation, cell cycle, and angiogenesis [21–26]. Interestingly, it was recently shown that hypoxia upregulates the expression of miR-424 in endothelial cells [23]. Three other miRNA species—miR-15a, miR-15b, and miR-16—that share the same seed sequence with miR-424 are also highly expressed in placental trophoblasts. In this study, we investigated the expression of miR-424 and other related miRNAs in placental trophoblasts. We show that the reduced expression of miR-424 is not unique to hypoxia but is associated with hindered trophoblast differentiation. This effect was not observed in other miR-424 family members. We also show that miR-424 directly regulates the expression of FGFR1 in human trophoblasts through a discrete 3′UTR site. While miR-15/16 species are also expressed in trophoblasts and capable of targeting and silencing FGFR1, their expression level is not affected by hypoxia or the differentiation state of the cells.
MATERIALS AND METHODS
Cell Culture
Primary human trophoblasts (PHT) were prepared from normal term placentas using the trypsin-deoxyribonuclease-dispase/Percoll method as described by Kliman [27], with previously published modifications [28]. All placentas were obtained after term delivery using a protocol approved by the Institutional Review Board at the University of Pittsburgh.
Cultures were plated at a density of 350 000 cells/cm2 and maintained in Dulbecco modified Eagle medium (DMEM; Sigma-Aldrich) containing 10% fetal bovine serum (FBS; Hyclone) and antibiotics at 37°C in a 5% carbon dioxide-air atmosphere. After 4 h, designed to allow cell attachment, the culture plates were allocated to either standard (O2 = 20%) or hypoxic (O2 < 1%) environments [18]. Differentiation was routinely monitored by medium human chorionic gonadotropin (hCG) levels using ELISA (DRG International), showing a characteristic increase in medium hCG as cytotrophoblasts differentiated into syncytiotrophoblasts, with attenuation of this process in hypoxic or undifferentiated cells [28, 29].
Immortalized, human, first-trimester, extravillous trophoblast cells (HTR8/SVneo), used as a convenient system for molecular assessment of miRNA-target interaction, were provided by C.H. Graham (Kingston, ON [30]) and were cultured in RPMI-1640 (Cellgro) supplemented with 5% bovine growth serum (HyClone) and antibiotics. JEG-3 human choriocarcinoma cells were maintained in DMEM containing 10% FBS and antibiotics as described [18]. Human umbilical vein endothelial cells (HUVEC; Lonza) were cultured in endothelial basal medium, phenol red-free (Lonza), supplemented with supplier-recommended concentrations of growth factors—human recombinant epidermal growth factor (hEGF), human fibroblast growth factor (hFGF), vascular endothelial growth factor (VEGF), ascorbic acid, hydrocortisone, and recombinant insulin-like growth factor (R3-IGF)—and 10% FBS (Lonza). Endothelial colony-forming cells (ECFC) were prepared as described in [31] and were maintained in endothelial basal medium, phenol red-free, supplemented with supplier-recommended concentrations of hEGF, hFGF, VEGF, ascorbic acid, hydrocortisone, and R3-IGF, with 10% FBS at 5 × 10⁷ cells per well on collagen-coated six-well plates (BD Biosciences). HUVEC and ECFC were used at passage 3 and plated at a density of 48 000 cells per well in a six-well culture plate for incubations in a hypoxic chamber and at 96 000 cells per well in a six-well culture plate for incubations at standard oxygen concentration.
RNA Isolation, Reverse Transcription, and Real-Time Quantitative PCR
Total cellular RNA was purified using the miRNeasy Mini Kit (Qiagen) according to the manufacturer's instructions. For mRNA analysis, reverse transcription (RT) was performed using High Capacity RNA-to-cDNA RMaster Mix (Applied Biosystems) in a 20-μl reaction mix at 25°C for 5 min, 42°C for 30 min, and 85°C for 5 min. The RT product was used for real-time PCR as described previously [32]. Table 1 lists primer sequences used for the study. All primer sequences were BLAST-checked (Basic Local Alignment Search Tool; http://blast.ncbi.nlm.nih.gov/Blast.cgi) for specificity. Dissociation curves were run on all reactions to ensure amplification of a single product with the appropriate melting temperature. Control samples of H2O were included in PCR reactions in each experiment. Samples were normalized to parallel reactions using primers specific for the trophoblast housekeeping gene YWHAZ [33]. The fold increase relative to control samples was determined by the 2-ΔΔCT method [34].
TABLE 1.
List of primers used in this study with their sequences.

For miRNA analysis, RT and quantitative PCR (RT-qPCR) of duplicate samples was performed using the miScript PCR system (Qiagen) following the manufacturer's instructions. Primers (miScript) were used to detect expression of miR-15a, miR-15b, miR-16, miR-424, and RNU6B. Total RNA input was normalized using RNU6B RNA as an endogenous control. Dissociation curves and control samples were included, as described above.
Small RNA Sequencing
Small RNA of 18–28 nucleotides in length was gel-purified from 10 μg of total RNA isolated from PHT cells cultured in standard or hypoxic conditions for 48 h. Small RNA libraries were prepared and sequenced at the Genome Sequencing & Analysis Core Resource at Duke University using the Genome Analyzer II (Illumina). For analysis of the sequencing data, the FASTQ files were preprocessed to remove the adapter sequences. The trimmed reads, along with the trimmed quality scores, were aligned to human reference genome using the short-read aligner Bowtie [35]. Only perfect alignments were allowed. Ensembl annotation (http://uswest.ensembl.org/index.html) of all mRNA and noncoding RNAs were used to annotate the aligned reads. The annotated reads were summarized to derive each miRNA count. All miRNA counts from all libraries were further normalized using the quantile normalization method.
Plasmids, Mutagenesis, Transfection, and Luciferase Assay
MicroRNA expression vectors were engineered by cloning an approximately 500-bp fragment of genomic DNA that harbored the miRNA precursor along with its flanking sequences into a pcDNA3 vector (Invitrogen). For each miRNA, we designed an miRNA sensor construct by cloning a synthetic fragment that contained three perfectly matching miRNA-responsive elements (MRE) into psiCHECK2 (Promega). For 3′UTR of putative miRNA target genes, we PCR-amplified the relevant 3′UTR sequences using human genomic DNA as a template and inserted them into psiCHECK2 at the XhoI/NotI sites. Mutations in putative MREs were performed using a site-directed, ligase-independent mutagenesis [36] and included deletion of 10–20 nucleotides that included the MRE's seed sequences within the target 3′UTR. To reduce the risk of unintended mutations, each mutated insert was confirmed by sequencing and then subcloned back into a native psiCHECK2 vector that was not subject to mutagenesis.
Luciferase reporter constructs, along with the miRNA expression constructs, were cotransfected using polyethylenimine-mediated transfection [37]. HTR-8/SVneo cells, plated in 12-well plates, were transfected with 10 ng of reporter construct along with increasing concentrations of CMV-based vectors (pcDNA3) expressing relevant miRNAs. At 48 h after transfection, the cells were lysed with passive lysis buffer (Promega), and firefly and Renilla luciferase activities were measured consecutively with the Dual Luciferase Reporter system (Promega). Renilla luciferase activity was normalized to the firefly luciferase control. The miRCURY LNA microRNA Power Inhibitor, targeting miR-424, and a nontargeting control LNA oligonucleotide were obtained from Exiqon, Inc. HTR-8/SVneo cells were cotransfected with LNA inhibitors and a luciferase reporter plasmid using DharmaFECT Duo transfection reagent (Thermo Scientific). For transfection of PHT cells after 4–8 h, designed to allow PHT attachment to culture plates, cells were incubated with 25 nM and up to 100 nM of miRNA LNA inhibitor with DharmaFECT-1 transfection reagent in OPTI-MEM I (Invitrogen) for 24 h. Cotransfections of 25 nM antagomir with miRNA luciferase reporter construct were performed using DharmaFECT Duo transfection reagent in OPTI-MEM I for 24 h. After 24 h, the medium was changed to DMEM containing 10% FBS and antibiotics, and cells and media were harvested 48 h or 72 h after the start of transfection.
Correlation Studies
PHT cells from four placentas were cultured under standard and hypoxic conditions. Total RNA samples were extracted at time 0, 6, 12, 24, 48, and 72 h and hybridized to a microarray (Agilent SurePrint G3 Human GE 8x60K; Agilent). Expression of miR-424 was measured using Agilent microRNA microarray (Human miRNA Microarray Release 16.0, 8x60K). Data represent the average of log2 expression of the FGFR1 variants and miR-424 over the samples from four placentas. The Pearson correlation between the averaged log2 expression of FGFR1 variant 1 and the averaged log2 expression of miR424 is −0.7446, with a P value of 0.008591. The Pearson correlation between the averaged log2 expression of FGFR1 variant 6 and averaged log2 expression of miR424 is −0.7626, with a P value of 0.006341.
Western Immunoblotting
Cells were lysed in Cell Culture Lysis Reagent (Promega) supplemented with Halt Protease Inhibitor Cocktail (Thermo Scientific). Lysates were separated on SDS-PAGE and transferred to polyvinylidene difluoride membranes using standard procedures. Membranes were immunoblotted with a mouse monoclonal anti-FGFR1 antibody (MAB658; 0.5 mg/ml used at 1:500 dilution; R&D Systems) that recognizes most human FGFR1 isoforms. A goat anti-mouse conjugated with horseradish peroxidase (115-035-146; Jackson ImmunoResearch) was used as a secondary antibody. For normalization, the same membrane was immunoblotted with anti-actin antibody (MAB1501; EMD Millipore). The blots were washed and processed for chemiluminescence using SuperSignal West Dura (Thermo Scientific) and densitometrically quantified with VisionWorks LS software (version 6.6a; UVP BioImaging).
Statistics
All experiments were repeated at least three times. All data were analyzed using linear mixed-effect models, with the factor of interest as the fixed effect, and a single or nested random effect to represent the clustered structures. For each experiment, one or a few comparisons were preplanned to address a priori biological questions and tested by applying the Student t-test to the corresponding contrasts of the estimated coefficients of the fixed effects of the relevant linear mixed-effect models. No post hoc tests were performed. Significance level for each comparison was set at 0.05. For RT-qPCR data, the statistical analyses were done on the Ct values. For the microarray data, the robust multiarray average method [38], as employed in R-package AgiMicroRna [39], was used to obtain the summarized and normalized miRNA expression level. The statistical analyses of the miRNA and gene expression microarray data were done on the log2-transformed expression levels.
RESULTS
Expression of miR-424 in Hypoxic Human Trophoblasts
Previous analysis of miRNA profiles in PHT cultured in standard conditions (O2 = 20%) or hypoxic conditions (O2 < 1%) suggested reduced expression of miR-424 in response to 48 h of hypoxia [18]. Because the effect of hypoxia on miR-424 seemed inconsistent among various cell types [23], we analyzed the expression of trophoblastic miR-424 using deep sequencing of miRNAs in PHTs cultured in standard or hypoxic conditions and confirmed the reduced accumulation of miR-424 in hypoxic trophoblasts (Fig. 1A). To further detail miR-424 expression patterns, we used RT-qPCR to assess its expression over a period of 72 h in both standard conditions and hypoxia. FGFR1 is present as multiple splice variants that are not entirely characterized [40]. Therefore, primer pairs for FGFR1 were designed to anneal within common regions of the multiple transcripts of FGFR1. We found that miR-424 expression was relatively stable in PHTs during the first 24 h of culture; however, it was upregulated after 48 h of culture in standard conditions but not in hypoxia (Fig. 1B). To assess whether the effect of hypoxia was observed in other cell types, we examined miR-424 expression in other cells exposed to hypoxic conditions, including a choriocarcinoma cell line (JEG-3) and two models of endothelial cells: ECFC and HUVEC. Unlike PHT cells, these cells exhibited increased expression of miR-424 in hypoxia (Fig. 1C), consistent with a previous study reporting the induction of miR-424 by hypoxia in endothelial cells [23]. Thus, the relative reduction in miR-424 expression upon exposure to hypoxia seems to be a unique feature of placental PHTs.
FIG. 1.

MicroRNA expression in PHTs cultured in standard condition (Std) and hypoxia (Hpx). A) Expression level of miR-424-5p based on read counts from high-throughput sequencing (n = 1). Cells were cultured for 48 h in normoxia or hypoxia before RNA extraction. Two libraries of small RNAs were derived from these samples and deep-sequenced using an Illumina GAII analyzer. B) Time course of miR-424 expression in PHT cells cultured for 72 h in standard conditions compared to hypoxia and based on RT-qPCR. One representative of four experiments is shown. Error bars indicate the variability between two technical replicates. Data were normalized using U6 small nuclear RNA as an endogenous control. Statistical analysis was performed based on all independent experiments. **P < 0.01 compared with the standard group. Note that miR-424 expression levels in standard conditions were also significantly (P < 0.01) elevated at 72 h compared to t = 0. C) Expression levels of miR-424 in JEG3, HUVEC, or ECFC cells. Data are mean ± SEM of three independent experiments, and each is measured in duplicate. Statistical analysis was performed on three independent experiments and is shown on a representative graph. **P < 0.01 compared with standard conditions. D) Expression levels of the miR-424-clustered miRNAs in PHT cells cultured for 72 h in standard conditions compared to hypoxia. *P < 0.05 compared with standard conditions.
We next sought to determine whether miRNA genes that are localized near miR-424 on chromosome X—genes that may constitute a unique polycistronic cluster (miR-503, mir-542-5p, mir-542-3p, mir-450a, mir-450b-5p, and mir-450b-3p) [21]—exhibit the same expression pattern as miR-424 in trophoblasts. Because some of these miRNA genes express two mature miRNAs, we report the results of the most abundant strand from each stem loop. We found that the expression pattern of miR-503 in hypoxia was similar to that of miR-424 (Fig. 1D), likely reflecting the fact that they are both derived from a unique common polycistronic precursor on the X-chromosome [21]. The other tested miRNAs were expressed at a markedly lower level and exhibited a pattern that was clearly distinct from that of miR-424 (Fig. 1D). The most distal species in this region, miR-450b, was below detection levels in PHT cells.
Expression of miR-424 During Trophoblast Differentiation
PHT cells isolated from term third-trimester placentas are mostly cytotrophoblasts, and they differentiate into syncytiotrophoblasts in vitro within 48–72 h in standard culture conditions. This differentiation is severely impaired when cells are cultured in low oxygen conditions [28, 41, 42]. To determine whether an altered differentiation state, even without hypoxia, reduces miR-424 expression, we measured the expression of miR-424 in primary trophoblasts grown in the presence of 1.5% dimethyl sulfoxide (DMSO), which is known to hinder trophoblast differentiation [43, 44]. A medium level of hCG in DMSO-exposed cells confirmed the attenuation of differentiation by DMSO (Fig. 2). We observed a substantial reduction of miR-424 expression in DMSO-exposed cells as compared to that of cells exposed to vehicle alone. No further decrease of miR-424 expression was observed when cells were exposed to hypoxia in addition to DMSO, supporting the conclusion that the reduction of miR-424 levels in hypoxic trophoblasts is to be attributed to abrogated differentiation of PHT cells in these cultures' conditions.
FIG. 2.

Trophoblast differentiation enhances the expression of miR-424. RT-qPCR analysis of miR-424 expression in PHT cells cultured for 48 h in standard conditions (Std) or hypoxia (Hpx) and in the absence or presence of DMSO. Data were normalized using U6 small nuclear RNA as an endogenous control. Inset: the concentration of hCG released in the medium, measured by ELISA as described in Materials and Methods. Data represent the geometric mean of three independent experiments, each performed in duplicate and plotted on a logarithmic scale. *P < 0.05 and **P < 0.01 compared with the control in the standard conditions group.
Targeting of MAP2K1 and FGFR1 by miR-424 in Trophoblasts
In our previous study, we reported FGFR1 as a potential target of miR-424 [18]. The TargetScan algorithm predicts three MREs within the 3′UTR of FGFR1. The two 5′-proximal sites overlap and were, therefore, considered as one site in subsequent experiments (Fig. 3A). We found that inactivation of the proximal conserved binding site (labeled 1 and 1′ in Fig. 3A) completely abolished the silencing by miR-424, while mutation in the 3′-end nonconserved element (site 2) had no effect on the reporter gene activity (Fig. 3B). These data confirmed the functional interaction between FGFR1 and miR-424 and indicated that the silencing of FGFR1 by miR-424 in HTR8/SVneo cells is entirely mediated by the conserved element. Interestingly, our data previously suggested that MAP2K1 might also be a target for miR-424. However, we noticed several sequence variations in the MAP2K1-3′UTR cDNA (Fig. 3C). Sequencing of additional MAP2K1 clones revealed two types of sequences, with one type corresponding to the true MAP2K1 and the other type showing a perfect match with MAP2K1P1, a pseudogene that is likely to have arisen by retrotransposition of a Map2k1 transcript [45]. Surprisingly, miR-424 had a weak yet consistent repressive effect on the true MAP2K1 sequence in HTR8/SVneo cells (Fig. 3D, left panel). In contrast, whereas MAP2K1P1 was repressed by miR-424 at a level comparable to other validated targets (Fig. 3D, right panel), a mutation of the putative miR-424 element on MAP2K1P1 did not abrogate the repressive effect (Fig. 3D), suggesting that a further downstream perfect seed match element may mediate the silencing of our MAP2K1P1 reporter.
FIG. 3.

MicroR-424 targets a discrete 3′UTR sequence in FGFR1 and MAP2K1 genes. A) Schematic representation of the predicted miR-424 MREs within the 3′UTR of the FGFR1 mRNA. Alignments between the miR-424 binding sites and miR-424 are shown. B) Deletion analysis of FGFR1 3′UTR. HTR8/SVneo cells were transfected with the wild-type FGFR1-3′UTR reporter (WT) or with a promoter that harbors a mutation in each of the two miR-424 binding sites, alone (Δ1 or Δ2) or in combination (Δ1,2). Each reporter was transfected along with an empty vector (pcDNA3) or a vector expressing miR-424. C) Schematic representation of a conserved miR-424 MRE within MAP2K1 (site 1) and of a putative miR-424 8-mer site (site 2) in the sequence of MAP2K1P1. Alignments between miR-424 and MAP2K1 and MAP2K1P1 are shown. Asterisks indicate the diverging nucleotides in the seed region between the sequences of MAP2K1 and MAP2K1P1. D) Luciferase reporter assay using MAP2K1-3′UTR and MAP2K1P1 reporter that harbors a mutation in each of putative binding sites (Δ1 or Δ2) or wild-type (WT) MRE. Relative luciferase unit (RLU) activity from each reporter, normalized to firefly luciferase activity, was determined 48 h later. Experiments using MAP2K1 (left panel) were performed seven times (n = 7), and statistical significance was determined using a linear mixed-effects model with the experiment batch as the random effect. Using this method, MAP2K1 WT was repressed in the presence of transfected miR-424 by about 17.45%, with P = 3.28 × 10⁻¹⁴ (**). Data derived from the MAP2K1P1 construct are geometric means of three independent experiments performed in duplicate. Statistical significance was determined by the Student t-test (SEM). *P < 0.01.
Because expressed pseudogenes have the potential to act as miRNA decoys [46], we investigated the expression status of MAP2K1P1 in PHT cells. Using RT-qPCR, we detected only the expression of MAP2K1 but not the pseudogene transcripts, indicating that the pseudogene MAP2K1P1 is not expressed in these cells. To further confirm that miR-424 can target FGFR1, we used a locked nucleic acid-based miR-424 inhibitor to repress endogenous miR-424 levels in the human trophoblast cell line HTR8/SVneo. As shown in Figure 4, luciferase activity from an FGFR1 luciferase reporter plasmid was enhanced proportionally to the amount of transfected miR-424 inhibitor, with no effect by the control (scrambled) oligonucleotide.
FIG. 4.
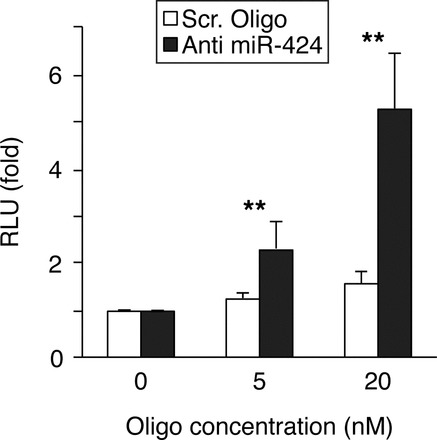
Inhibition of miR-424 derepresses FGFR1 expression. Luciferase assay of HTR8/SVneo cells cotransfected with FGFR1-luciferase reporter and either anti-miR-424 or a scrambled-sequence oligonucleotide as control. RLU activity from each reporter construct, normalized to firefly luciferase activity, was determined 48 h later. Data are geometric means of three independent experiments performed in duplicate. **P < 0.01 compared with the control group (scrambled [Scr.] oligo).
Lastly, we tested whether members of the miR15/16 family, which share a seed element with miR-424, can also regulate the FGFR1 reporter. Although miR-15 and miR-16 silenced FGFR1 luciferase reporter similarly to miR-424, and this effect was also primarily mediated by the conserved proximal element of FGFR1 3′UTR (Fig. 5A), we found that the expression of miR-15/16 species, while abundant in trophoblasts, is not altered by hypoxia (Fig. 5B). We noted a modest increase in luciferase activity of FGFR-Δ2 mutant when co-transfected with miR-15b/16.2 (Fig. 5A, right panel). This effect was modest, yet may represent a weak synergistic action of miR-15/16 activity on that site. Together, these data suggest that miR-424 or the miR15/16 family has the ability to modulate the expression of FGFR1 in PHT cells, but only miR-424 controls FGFR1 expression in altered differentiation or in hypoxia.
FIG. 5.

Silencing of FGFR1 by members of the miR-15/16 family. A) Activity of wild-type and mutant FGFR1-3′UTR reporter genes in response to expression of members of the miR-15/16 family of miRNAs. HTR8/SVneo cells were transfected with FGFR1 reporters along with an miR-424 or miR-15/16 expression vector. RLU activity from each reporter construct, normalized to firefly luciferase activity, was determined 48 h later. Data are geometric means of three independent experiments performed in duplicate. *P < 0.05 and **P < 0.01 compared with the control group for each miRNA expression vector (FGFR1 wt). B) Expression levels of some members of the miR-424 family in PHT cells cultured for 72 h in standard conditions (Std) compared to hypoxia (Hpx). One representative of four experiments is shown, with error bars indicating the variability between two technical replicates. Data were normalized using U6 small nuclear RNA as an endogenous control.
FGFR1 Expression Is Increased in Hypoxic Trophoblasts
Having confirmed the functional interaction between FGFR1 reporter and miR-424 in a trophoblast cell line, we sought to interrogate this interaction in PHT cells. As predicted, both hypoxia and exposure to DMSO increased in the accumulation of FGFR1 transcripts (Fig. 6A). Similarly, we observed a twofold increase of FGFR1 protein in PHT cells exposed to hypoxia or DMSO (Fig. 6B). To further document the inverse relationship between miR-424 and FGFR1 in trophoblasts, we performed an analysis of the correlation between expression levels of miR-15/16/424 and several isoforms of FGFR1. Using microarray data from experiments in which we analyzed four sets of PHTs cultured in standard conditions or hypoxia across different time points (0, 12, 24, 48, and 72 h), we found a statistically strong negative correlation between FGFR1 transcripts and miR-424, but not miR-15/16 (Fig. 7).
FIG. 6.

The effect of the differentiation state on the expression of FGFR1 in PHT cells. A) RT-qPCR analysis of FGFR1 expression in PHT cells cultured in hypoxia and exposed to DMSO for 72 h. Data represent the geometric mean of three independent experiments performed in duplicate. B) Impaired trophoblast differentiation by hypoxia or DMSO enhances FGFR1 expression. Western blot analysis of FGFR1 in three sets of PHT cells that were cultured for 72 h in standard conditions, in hypoxia in complete medium (Ctrl), or in complete medium containing 1.5% of DMSO. **P < 0.01 compared with the control group in standard conditions.
FIG. 7.

Inverse correlation between FGFR1 mRNA and miR-424 in PHT cells. FGFR1 (most abundant transcript) or miR-424 was detected using microarray, and log2-transformed expression was plotted against the log2-transformed expression of miR-424 (note the inverted axes, designed to illustrate the expression pattern). Data represent the average of log2 expression of the FGFR1 variants and miR-424 for samples derived from four placentas. The Pearson correlation between the averaged log2 expression of FGFR1 and the averaged log2 expression of miR424 is −0.7446 (P < 0.01).
DISCUSSION
Placental trophoblasts express common, as well as unique, patterns of miRNAs. Although not restricted to trophoblasts, miR-424 is highly abundant in the placenta, as are with several members of the miR-16 family of miRNAs. In this study, we found that the expression of miR-424 directly correlates with the differentiation of trophoblasts. The upregulation of miR-424 as cells differentiate in vitro is completely abolished when differentiation into syncytiotrophoblasts is abrogated by hypoxia or exposure to DMSO. In addition, we found that downregulation of miR-424 in cells exposed to hypoxia is specific to primary trophoblasts and was not observed in a trophoblast cell line (JEG-3) or in either of two models of endothelial cells (HUVEC and ECFC), in which miR-424 was upregulated, as shown by us and others [23]. Interestingly, we recently reported that miR-424 was upregulated in the plasma of pregnant women with fetal growth restriction, compared to controls [16]. This observation was unexpected, because fetal growth restriction is commonly associated with placental insufficiency and cellular hypoxia. However, our past observation could be explained by changes in maternal endothelial cells. It will be interesting to dissect the molecular mechanisms underlying the difference in miRNA response to hypoxia in PHT and endothelial cells.
We also found that the pattern of miR-424 expression in trophoblasts is specific to miR-424 and its clustered partner miR-503. Analysis of several miRNAs located in close genomic proximity, including miR-542 and members of the miR-450 family, did not reveal significant changes when cells were exposed to hypoxia. Similarly, miRNAs that share the same seed sequence of the miR-424 family, including miR-16 and miR-15, were unchanged by hypoxia, while miR-195 and miR-497 were almost undetected in trophoblasts.
We defined the molecular interaction of miR-424 with 3′UTR sites within the FGFR1 gene, showing that only the conserved binding site proximal to the stop codon mediates the silencing activity of miR-424. The distal, less conserved site did not play a role in miR-424 action. Interestingly, the proximal site also mediated the suppressive activity of miR-16 and miR-15. Two recent studies have also reported the targeting of FGFR1 by miR-424 [47, 48], further confirming FGFR1 as a target of miR-424. Expression of FGF receptors, including FGFR1, has been confirmed in the human placenta, where it is postulated to play a role in villous development [49, 50].
FGFR1 has a complex genomic organization and has been implicated throughout development in many signaling pathways controlling cellular proliferation, differentiation, survival, and angiogenesis [51]. Deregulated FGF signaling is also common in many types of cancers, and FGFR1 amplification has also been reported in breast cancers [52], oral squamous carcinoma [53], ovarian cancer [54], bladder cancer [55], and rhabdomyosarcoma [56]. To date we have not been able to silence FGFR1 expression in PHTs, likely reflecting suboptimal silencing efficiency in PHTs. Additionally, FGFR1 is highly regulated posttranscriptionally, resulting in many splicing variants [57], and the precise genomic context of the miR-424 binding elements(s) remains to be validated. In the mouse, deletion of FGFR1 results in embryonic lethality around Day 7.5 to 9.5 (E7.5 to E9.5), preventing a detailed analysis of its role in the placenta [58, 59]. In humans, inactivating mutations in the FGFR1 gene are associated with the Kallmann syndrome, a rare genetic disorder characterized by hypogonadism, infertility, and anosmia [60]. Kim et al. [48] recently showed that miR-424 and miR-503 regulate FGF signaling in the lungs by targeting FGFR1 and the ligand FGF2. We also tested the 3′UTR of FGF2 in our system and observed a repression of the luciferase activity in cells cotransfected with miR-424 (data not shown). Together, these observations support the relevance of miR-424 to FGF signaling, which probably plays a role in placental development and adaptation to stress.
Lastly, we noted a weak effect of miR-424 on MAP2K1 reporter, with a more potent effect on the pseudogene MAP2K1P1. It is unclear whether this low repression effect results from suboptimal experimental conditions or is a feature of the pair MAP2K1-miR-424 in trophoblasts. It was recently shown that MAP2K1 is a target of miR-424 in senile hemangioma [61] and that MAP2K1 can be silenced by miR-497, which harbors the same seed sequence as miR-424 [62]. Altogether, these findings strongly suggest that MAP2K1 is probably a genuine target of this family of miRNA, yet is unlikely to be relevant to trophoblastic miR-424.
An interesting finding that will need further investigation is the potential interplay between miR-424 and other members of the family, particularly miR-15 and miR-16. We showed that these miRNAs have the ability to repress an FGFR1 reporter. These miRNAs are normally abundant in trophoblasts, but their levels did not change in the conditions tested; therefore, it is unlikely that they affect FGFR1 during the process of differentiation or response to hypoxia. However, we cannot rule out the possibility that, in other circumstances, miR-15/16 could play a role in the regulation of FGFR1.
ACKNOWLEDGMENT
The authors thank Dr. C.H. Graham (Queen's University, Kingston, ON) for the HTR-8/SVneo cells and Dr. C.A. Hubel (University of Pittsburgh, Pittsburgh, PA) for HUVEC and ECFC cells. The authors also thank Judith Ziegler and Elena Sadovsky for technical assistance, and Lori Rideout and Bruce Campbell for assistance during preparation of the manuscript.
Footnotes
Supported by grants to J.F.M. and T.C. from the State of Pennsylvania Department of Health Formula Research Funds, to R.B.D. by a postdoctoral research fellowship from Magee Womens Research Institute, and National Institutes of Health R01HD065893 and R21HD071707, both to Y.S.
REFERENCES
- Reynolds LP, Caton JS, Redmer DA, Grazul-Bilska AT, Vonnahme KA, Borowicz PP, Luther JS, Wallace JM, Wu G, Spencer TE. Evidence for altered placental blood flow and vascularity in compromised pregnancies. J Physiol 2006; 572: 51 58. [DOI] [PMC free article] [PubMed] [Google Scholar]
- Simon MC, Keith B. The role of oxygen availability in embryonic development and stem cell function. Nat Rev Mol Cell Biol 2008; 9: 285 296. [DOI] [PMC free article] [PubMed] [Google Scholar]
- Filipowicz W, Bhattacharyya SN, Sonenberg N. Mechanisms of post-transcriptional regulation by microRNAs: are the answers in sight? Nat Rev Genet 2008; 9: 102 114. [DOI] [PubMed] [Google Scholar]
- Hebert SS, De Strooper B. Alterations of the microRNA network cause neurodegenerative disease. Trends Neurosci 2009; 32: 199 206. [DOI] [PubMed] [Google Scholar]
- Croce CM. Causes and consequences of microRNA dysregulation in cancer. Nat Rev Genet 2009; 10: 704 714. [DOI] [PMC free article] [PubMed] [Google Scholar]
- Latronico MV, Condorelli G. MicroRNAs and cardiac pathology. Nat Rev Cardiol 2009; 6: 419 429. [DOI] [PubMed] [Google Scholar]
- Inui M, Martello G, Piccolo S. MicroRNA control of signal transduction. Nat Rev Mol Cell Biol 2010; 11: 252 263. [DOI] [PubMed] [Google Scholar]
- Junker A, Hohlfeld R, Meinl E. The emerging role of microRNAs in multiple sclerosis. Nat Rev Neurol 2011; 7: 56 59. [DOI] [PubMed] [Google Scholar]
- Barad O, Meiri E, Avniel A, Aharonov R, Barzilai A, Bentwich I, Einav U, Gilad S, Hurban P, Karov Y, Lobenhofer EK, Sharon E, et al. MicroRNA expression detected by oligonucleotide microarrays: system establishment and expression profiling in human tissues. Genome Res 2004; 14: 2486 2494. [DOI] [PMC free article] [PubMed] [Google Scholar]
- Bentwich I, Avniel A, Karov Y, Aharonov R, Gilad S, Barad O, Barzilai A, Einat P, Einav U, Meiri E, Sharon E, Spector Y, et al. Identification of hundreds of conserved and nonconserved human microRNAs. Nat Genet 2005; 37: 766 770. [DOI] [PubMed] [Google Scholar]
- Liang Y, Ridzon D, Wong L, Chen C. Characterization of microRNA expression profiles in normal human tissues. BMC Genomics 2007; 8: 166. [DOI] [PMC free article] [PubMed] [Google Scholar]
- Landgraf P, Rusu M, Sheridan R, Sewer A, Iovino N, Aravin A, Pfeffer S, Rice A, Kamphorst AO, Landthaler M, Lin C, Socci ND, et al. A mammalian microRNA expression atlas based on small RNA library sequencing. Cell 2007; 129: 1401 1414. [DOI] [PMC free article] [PubMed] [Google Scholar]
- Mouillet JF, Chu T, Sadovsky Y. Expression patterns of placental microRNAs. Birth Defects Res A Clin Mol Teratol 2011; 91: 737 743. [DOI] [PMC free article] [PubMed] [Google Scholar]
- Ishibashi O, Ohkuchi A, Ali MM, Kurashina R, Luo SS, Ishikawa T, Takizawa T, Hirashima C, Takahashi K, Migita M, Ishikawa G, Yoneyama K, et al. Hydroxysteroid (17-beta) dehydrogenase 1 is dysregulated by miR-210 and miR-518c that are aberrantly expressed in preeclamptic placentas: a novel marker for predicting preeclampsia. Hypertension 2012; 59: 265 273. [DOI] [PubMed] [Google Scholar]
- Enquobahrie DA, Abetew DF, Sorensen TK, Willoughby D, Chidambaram K, Williams MA. Placental microRNA expression in pregnancies complicated by preeclampsia. Am J Obstet Gynecol 2011; 204:178.e112–178.e121. [DOI] [PMC free article] [PubMed]
- Mouillet JF, Chu T, Hubel CA, Nelson DM, Parks WT, Sadovsky Y. The levels of hypoxia-regulated microRNAs in plasma of pregnant women with fetal growth restriction. Placenta 2010; 31: 781 784. [DOI] [PMC free article] [PubMed] [Google Scholar]
- Pineles BL, Romero R, Montenegro D, Tarca AL, Han YM, Kim YM, Draghici S, Espinoza J, Kusanovic JP, Mittal P, Hassan SS, Kim CJ. Distinct subsets of microRNAs are expressed differentially in the human placentas of patients with preeclampsia. Am J Obstet Gynecol 2007; 196:261.e1–261.e6. [DOI] [PubMed]
- Mouillet JF, Chu T, Nelson DM, Mishima T, Sadovsky Y. MiR-205 silences MED1 in hypoxic primary human trophoblasts. FASEB J 2010; 24: 2030 2039. [DOI] [PMC free article] [PubMed] [Google Scholar]
- Mullokandov G, Baccarini A, Ruzo A, Jayaprakash AD, Tung N, Israelow B, Evans MJ, Sachidanandam R, Brown BD. High-throughput assessment of microRNA activity and function using microRNA sensor and decoy libraries. Nat Methods 2012; 9: 840 846. [DOI] [PMC free article] [PubMed] [Google Scholar]
- Wee LM, Flores-Jasso CF, Salomon WE, Zamore PD. Argonaute divides its RNA guide into domains with distinct functions and RNA-binding properties. Cell 2012; 151: 1055 1067. [DOI] [PMC free article] [PubMed] [Google Scholar]
- Forrest AR, Kanamori-Katayama M, Tomaru Y, Lassmann T, Ninomiya N, Takahashi Y, de Hoon MJ, Kubosaki A, Kaiho A, Suzuki M, Yasuda J, Kawai J, et al. Induction of microRNAs, mir-155, mir-222, mir-424 and mir-503, promotes monocytic differentiation through combinatorial regulation. Leukemia 2010; 24: 460 466. [DOI] [PubMed] [Google Scholar]
- Gao J, Yang T, Han J, Yan K, Qiu X, Zhou Y, Fan Q, Ma B. MicroRNA expression during osteogenic differentiation of human multipotent mesenchymal stromal cells from bone marrow. J Cell Biochem 2011; 112: 1844 1856. [DOI] [PubMed] [Google Scholar]
- Ghosh G, Subramanian IV, Adhikari N, Zhang X, Joshi HP, Basi D, Chandrashekhar YS, Hall JL, Roy S, Zeng Y, Ramakrishnan S. Hypoxia-induced microRNA-424 expression in human endothelial cells regulates HIF-alpha isoforms and promotes angiogenesis. J Clin Invest 2010; 120: 4141 4154. [DOI] [PMC free article] [PubMed] [Google Scholar]
- Rosa A, Ballarino M, Sorrentino A, Sthandier O, De Angelis FG, Marchioni M, Masella B, Guarini A, Fatica A, Peschle C, Bozzoni I. The interplay between the master transcription factor PU.1 and miR-424 regulates human monocyte/macrophage differentiation. Proc Natl Acad Sci USA 2007; 104: 19849 19854. [DOI] [PMC free article] [PubMed] [Google Scholar]
- Sarkar S, Dey BK, Dutta A. MiR-322/424 and −503 are induced during muscle differentiation and promote cell cycle quiescence and differentiation by down-regulation of Cdc25A. Mol Biol Cell 2010; 21: 2138 2149. [DOI] [PMC free article] [PubMed] [Google Scholar]
- Xu J, Li Y, Wang F, Wang X, Cheng B, Ye F, Xie X, Zhou C, Lu W. Suppressed miR-424 expression via upregulation of target gene Chk1 contributes to the progression of cervical cancer. Oncogene 2013; 32: 976 987. [DOI] [PubMed] [Google Scholar]
- Kliman HJ, Nestler JE, Sermasi E, Sanger JM, Strauss JF., III. Purification, characterization, and in vitro differentiation of cytotrophoblasts from human term placentae. Endocrinology 1986; 118: 1567 1582. [DOI] [PubMed] [Google Scholar]
- Nelson DM, Johnson RD, Smith SD, Anteby EY, Sadovsky Y. Hypoxia limits differentiation and up-regulates expression and activity of prostaglandin H synthase 2 in cultured trophoblast from term human placenta. Am J Obstet Gynecol 1999; 180: 896 902. [DOI] [PubMed] [Google Scholar]
- Chen B, Nelson DM, Sadovsky Y. N-myc down-regulated gene 1 modulates the response of term human trophoblasts to hypoxic injury. J Biol Chem 2006; 281: 2764 2772. [DOI] [PubMed] [Google Scholar]
- Graham CH, Hawley TS, Hawley RG, MacDougall JR, Kerbel RS, Khoo N, Lala PK. Establishment and characterization of first trimester human trophoblast cells with extended lifespan. Exp Cell Res 1993; 206: 204 211. [DOI] [PubMed] [Google Scholar]
- Grundmann M, Haidar M, Placzko S, Niendorf R, Darashchonak N, Hubel CA, von Versen-Hoynck F. Vitamin D improves the angiogenic properties of endothelial progenitor cells. Am J Physiol Cell Physiol 2012; 303: C954C 962. [DOI] [PMC free article] [PubMed] [Google Scholar]
- Schaiff WT, Bildirici I, Cheong M, Chern PL, Nelson DM, Sadovsky Y. Peroxisome proliferator-activated receptor-gamma and retinoid X receptor signaling regulate fatty acid uptake by primary human placental trophoblasts. J Clin Endocrinol Metab 2005; 90: 4267 4275. [DOI] [PubMed] [Google Scholar]
- Wyatt SM, Kraus FT, Roh CR, Elchalal U, Nelson DM, Sadovsky Y. The correlation between sampling site and gene expression in the term human placenta. Placenta 2005; 26: 372 379. [DOI] [PubMed] [Google Scholar]
- Livak KJ, Schmittgen TD. Analysis of relative gene expression data using real-time quantitative PCR and the 2(-Delta Delta C(T)) Method. Methods 2001; 25: 402 408. [DOI] [PubMed] [Google Scholar]
- Langmead B, Trapnell C, Pop M, Salzberg SL. Ultrafast and memory-efficient alignment of short DNA sequences to the human genome. Genome Biol 2009; 10: R25. [DOI] [PMC free article] [PubMed] [Google Scholar]
- Chiu J, March PE, Lee R, Tillett D. Site-directed, ligase-independent mutagenesis (SLIM): a single-tube methodology approaching 100% efficiency in 4 h. Nucleic Acids Res 2004; 32: e174. [DOI] [PMC free article] [PubMed] [Google Scholar]
- Reed SE, Staley EM, Mayginnes JP, Pintel DJ, Tullis GE. Transfection of mammalian cells using linear polyethylenimine is a simple and effective means of producing recombinant adeno-associated virus vectors. J Virol Methods 2006; 138: 85 98. [DOI] [PubMed] [Google Scholar]
- Irizarry RA, Hobbs B, Collin F, Beazer-Barclay YD, Antonellis KJ, Scherf U, Speed TP. Exploration, normalization, and summaries of high density oligonucleotide array probe level data. Biostatistics 2003; 4: 249 264. [DOI] [PubMed] [Google Scholar]
- Lopez-Romero P. Pre-processing and differential expression analysis of Agilent microRNA arrays using the AgiMicroRna Bioconductor library. BMC Genomics 2011; 12: 64. [DOI] [PMC free article] [PubMed] [Google Scholar]
- Groth C, Lardelli M. The structure and function of vertebrate fibroblast growth factor receptor 1. Int J Dev Biol 2002; 46: 393 400. [PubMed] [Google Scholar]
- Genbacev O, Zhou Y, Ludlow JW, Fisher SJ. Regulation of human placental development by oxygen tension. Science 1997; 277: 1669 1672. [DOI] [PubMed] [Google Scholar]
- Rimon E, Chen B, Shanks AL, Nelson DM, Sadovsky Y. Hypoxia in human trophoblasts stimulates the expression and secretion of connective tissue growth factor. Endocrinology 2008; 149: 2952 2958. [DOI] [PMC free article] [PubMed] [Google Scholar]
- Thirkill TL, Douglas GC. Differentiation of human trophoblast cells in vitro is inhibited by dimethylsulfoxide. J Cell Biochem 1997; 65: 460 468. [DOI] [PubMed] [Google Scholar]
- Schild RL, Schaiff WT, Carlson MG, Cronbach EJ, Nelson DM, Sadovsky Y. The activity of PPAR gamma in primary human trophoblasts is enhanced by oxidized lipids. J Clin Endocrinol Metab 2002; 87: 1105 1110. [DOI] [PubMed] [Google Scholar]
- Harrison PM, Zheng D, Zhang Z, Carriero N, Gerstein M. Transcribed processed pseudogenes in the human genome: an intermediate form of expressed retrosequence lacking protein-coding ability. Nucleic Acids Res 2005; 33: 2374 2383. [DOI] [PMC free article] [PubMed] [Google Scholar]
- Poliseno L, Salmena L, Zhang J, Carver B, Haveman WJ, Pandolfi PP. A coding-independent function of gene and pseudogene mRNAs regulates tumour biology. Nature 2010; 465: 1033 1038. [DOI] [PMC free article] [PubMed] [Google Scholar]
- Chamorro-Jorganes A, Araldi E, Penalva LO, Sandhu D, Fernandez-Hernando C, Suarez Y. MicroRNA-16 and microRNA-424 regulate cell-autonomous angiogenic functions in endothelial cells via targeting vascular endothelial growth factor receptor-2 and fibroblast growth factor receptor-1. Arterioscler Thromb Vasc Biol 2011; 31: 2595 2606. [DOI] [PMC free article] [PubMed] [Google Scholar]
- Kim J, Kang Y, Kojima Y, Lighthouse JK, Hu X, Aldred MA, McLean DL, Park H, Comhair SA, Greif DM, Erzurum SC, Chun HJ. An endothelial apelin-FGF link mediated by miR-424 and miR-503 is disrupted in pulmonary arterial hypertension. Nat Med 2013; 19: 74 82. [DOI] [PMC free article] [PubMed] [Google Scholar]
- Arany E, Hill DJ. Fibroblast growth factor-2 and fibroblast growth factor receptor-1 mRNA expression and peptide localization in placentae from normal and diabetic pregnancies. Placenta 1998; 19: 133 142. [DOI] [PubMed] [Google Scholar]
- Anteby EY, Natanson-Yaron S, Hamani Y, Sciaki Y, Goldman-Wohl D, Greenfield C, Ariel I, Yagel S. Fibroblast growth factor-10 and fibroblast growth factor receptors 1–4: expression and peptide localization in human decidua and placenta. Eur J Obstet Gynecol Reprod Biol 2005; 119: 27 35. [DOI] [PubMed] [Google Scholar]
- Turner N, Grose R. Fibroblast growth factor signalling: from development to cancer. Nat Rev Cancer 2010; 10: 116 129. [DOI] [PubMed] [Google Scholar]
- Courjal F, Cuny M, Simony-Lafontaine J, Louason G, Speiser P, Zeillinger R, Rodriguez C, Theillet C. Mapping of DNA amplifications at 15 chromosomal localizations in 1875 breast tumors: definition of phenotypic groups. Cancer Res 1997; 57: 4360 4367. [PubMed] [Google Scholar]
- Freier K, Schwaenen C, Sticht C, Flechtenmacher C, Muhling J, Hofele C, Radlwimmer B, Lichter P, Joos S. Recurrent FGFR1 amplification and high FGFR1 protein expression in oral squamous cell carcinoma (OSCC). Oral Oncol 2007; 43: 60 66. [DOI] [PubMed] [Google Scholar]
- Gorringe KL, Jacobs S, Thompson ER, Sridhar A, Qiu W, Choong DY, Campbell IG. High-resolution single nucleotide polymorphism array analysis of epithelial ovarian cancer reveals numerous microdeletions and amplifications. Clin Cancer Res 2007; 13: 4731 4739. [DOI] [PubMed] [Google Scholar]
- Simon R, Richter J, Wagner U, Fijan A, Bruderer J, Schmid U, Ackermann D, Maurer R, Alund G, Knonagel H, Rist M, Wilber K, et al. High-throughput tissue microarray analysis of 3p25 (RAF1) and 8p12 (FGFR1) copy number alterations in urinary bladder cancer. Cancer Res 2001; 61: 4514 4519. [PubMed] [Google Scholar]
- Missiaglia E, Selfe J, Hamdi M, Williamson D, Schaaf G, Fang C, Koster J, Summersgill B, Messahel B, Versteeg R, Pritchard-Jones K, Kool M, et al. Genomic imbalances in rhabdomyosarcoma cell lines affect expression of genes frequently altered in primary tumors: an approach to identify candidate genes involved in tumor development. Genes Chromosomes Cancer 2009; 48: 455 467. [DOI] [PubMed] [Google Scholar]
- Werner S, Duan DS, de Vries C, Peters KG, Johnson DE, Williams LT. Differential splicing in the extracellular region of fibroblast growth factor receptor 1 generates receptor variants with different ligand-binding specificities. Mol Cell Biol 1992; 12: 82 88. [DOI] [PMC free article] [PubMed] [Google Scholar]
- Deng CX, Wynshaw-Boris A, Shen MM, Daugherty C, Ornitz DM, Leder P. Murine FGFR-1 is required for early postimplantation growth and axial organization. Genes Dev 1994; 8: 3045 3057. [DOI] [PubMed] [Google Scholar]
- Yamaguchi TP, Harpal K, Henkemeyer M. Rossant J. fgfr-1 is required for embryonic growth and mesodermal patterning during mouse gastrulation. Genes Dev 1994; 8: 3032 3044. [DOI] [PubMed] [Google Scholar]
- Villanueva C, de Roux N. FGFR1 mutations in Kallmann syndrome. Front Horm Res 2010; 39: 51 61. [DOI] [PubMed] [Google Scholar]
- Nakashima T, Jinnin M, Etoh T, Fukushima S, Masuguchi S, Maruo K, Inoue Y, Ishihara T, Ihn H. Down-regulation of mir-424 contributes to the abnormal angiogenesis via MEK1 and cyclin E1 in senile hemangioma: its implications to therapy. PLoS One 2010; 5: e14334. [DOI] [PMC free article] [PubMed] [Google Scholar]
- Zheng D, Radziszewska A, Woo P. MicroRNA 497 modulates interleukin 1 signalling via the MAPK/ERK pathway. FEBS Lett 2012; 586: 4165 4172. [DOI] [PubMed] [Google Scholar]