

Abstract
Insulin constitutes a major evolutionarily conserved hormonal axis for maintaining glucose homeostasis1-3; dysregulation of this axis causes diabetes2,4. PGC-1α links insulin signaling to the expression of glucose and lipid metabolic genes5-7. GCN5 acetylates PGC-1α and suppresses its transcriptional activity, whereas SIRT1 deacetylates and activates PGC-1α8,9. Although insulin is a mitogenic signal in proliferative cells10,11, whether components of the cell cycle machinery contribute to insulin’s metabolic action is poorly understood. Herein, we report that insulin activates cyclin D1-CDK4, which, in turn, increases GCN5 acetyltransferase activity and suppresses hepatic glucose production independently of cell cycle progression. Through a cell-based high throughput chemical screen, we identified a CDK4 inhibitor that potently decreases PGC-1α acetylation. Insulin/GSK3β signaling induces cyclin D1 protein stability via sequestering cyclin D1 in the nucleus. In parallel, dietary amino acids increase hepatic cyclin D1 mRNA transcripts. Activated cyclin D1-CDK4 kinase phosphorylates and activates GCN5, which then acetylates and inhibits PGC-1α activity on gluconeogenic genes. Loss of hepatic cyclin D1 results in increased gluconeogenesis and hyperglycemia. In diabetic models, cyclin D1-CDK4 is chronically elevated and refractory to fasting/feeding transitions; nevertheless further activation of this kinase normalizes glycemia. Our findings show that insulin uses components of the cell cycle machinery in post-mitotic cells to control glucose homeostasis independently of cell division.
To discover new factors that can regulate PGC-1α activity through its acetylation status, a high throughput enzyme-linked immunoassay was designed to specifically and quantitatively monitor the level of PGC-1α acetylation in U-2OS cells (Extended Data Fig. 1a). A library of 1600 compounds, including bioactive and natural compounds, was screened (Fig. 1a). Interestingly, the compound with the highest z score for PGC-1α deacetylation was fascaplysin, a known CDK4 inhibitor12 (Extended Data Fig. 1b). CDK4 regulates G1 to S phase transition and its kinase activity is dependent on its binding to one of the three D-type cyclins including cyclin D113. We, therefore, investigated the effect of this cell cycle complex on PGC-1α acetylation and function, in connection to nutrient and insulin metabolic actions.
Extended Data Figure 1.

A cell-based high throughput screen reveals compounds regulating PGC-1α acetylation. a) Scheme of high throughput chemical assay. b) Compounds with significant z scores either >3.0 or <-3.0 are listed. Inhibitors indicate the compounds that increased PGC-1α acetylation while activators indicate the ones that decreased PGC-1α acetylation.
Figure 1.

Cyclin D1-CDK4 modulates PGC-1α acetylation through GCN5. a) Scatter plot of chemicals plotted with first test z scores on the X-axis and repeated test scores on the Y-axis. b) Fascaplysin reduces PGC-1α acetylation and Rb phoshorylation. c) Fascaplysin and PD 0332991 treatments decrease PGC-1α acetylation. d) CDK4 knockdown causes PGC-1α deacetylation. e) GCN5 knockdown blunts fascaplysin-mediated PGC-1α deacetylation. f) GCN5 acetyltransferase activity is reduced upon fascaplysin treatment (n=2, mean±S.E.M). g) Endogenous GCN5 and CDK4 interact. h) Cyclin D1-CDK4 kinase phosphorylates GCN5 in vitro. i) GCN5 T272A/S372A (AA) phosphorylation by cyclin D1-CDK4 kinase is diminished compared to GCN5 wild-type (WT). j) GCN5 T272A/S372A displays decreased acetyltransferase capacity. k) GCN5 T272A/S372A has decreased acetyltransferase activity and insensitivity to fascaplysin treatment. Kinetic constants were calculated by Michaelis-Menten equation (n=4, AU/min=arbitrary unit/min, mean±S.E.M). U-2OS cells were used for these experiments.
First, we calculated an IC50 of 0.7μM for fascaplysin-induced PGC-1α deaceylation, which is similar to its IC50 for CDK4 inhibition (Extended Data Fig. 2a). Fascaplysin-induced PGC-1α deacetylation overlapped with Rb dephosphorylation, a well-characterized CDK4 substrate14 (Fig. 1b). PD 0332991, the most specific CDK4 inhibitor available15, led to a similar decrease of PGC-1α acetylation (Fig. 1c, Extended Data Fig. 2b). Furthermore, CDK4 depletion through transient shRNA transfection had the same effect as chemical inhibitors, confirming that CDK4 activity controls PGC-1α acetylation levels (Fig. 1d, Extended Data Fig. 2c).
Extended Data Figure 2.

Cyclin D1-CDK4 modulates PGC-1α acetylation through GCN5. a) Fascaplysin decreases PGC-1α acetylation in dose-dependent manner. Dose-dependent response of PGC-1α acetylation treated with fascaplysin concentrations ranging from 31.25nM to 8μM. IC50 value was calculated using three independent measurements from the assay described in Extended Data Fig. 1 a. b) Chemical structures of fascaplysin and PD 0332991. c) CDK4 is knockdown by various CDK4 shRNAs used in Fig. 1d. d) Fascaplysin decreases PGC-1α acetylation upon EX527 or trichostatin A treatments. Cells were treated for 8hr in case of 1μM fascaplysin and 4hr in case of 1μM EX527 or trichostatin A prior to harvest. DMSO (-) was used as a control treatment. e) Fascpalysin has blunted effect on PCAF-mediated PGC-1α acetylation. f) Ectopically expressed CDK4 and GCN5 interact. As a comparison, PGC-1α, Sirt1 and Sirt6 were used while GFP was overexpressed as a negative control. g) Phosphorylation of GCN5 by cyclin D1-CDK4 complex is reduced by fascaplysin. DMSO or 1μM fascaplysin was added to the kinase reaction. h) In vitro phosphorylation of GST-GCN5 recombinant proteins (1-224aa, 1-386aa, 1-553aa, 1-837aa) by cyclin D1-CDK4 and the protein level of those fragments. i) GCN5 wild-type (WT), treated with fascaplysin and GCN5 T272A/S372A (AA) mutant immunoprecipitated by anti-phospho-S*P (pS*P) antibody. j) Acetylation of PGC-1α closely follows the amount of PAF65β bound to GCN5. Nuclear extracts of U-2OS overexpressing various amounts of GCN5 were used for western-blot analysis to detect GCN5 and PAF65β. Empty vector was transfected as a negative control. k) Interaction between GCN5 T272A/S372A (AA) and PAF65β is reduced compared to GCN5 wild-type (WT). U-2OS cells were used for western-blot analysis experiments.
Because CDK4 inhibitor-induced PGC-1α deacetylation was not affected when Sirtuin 1 or HDAC class I/II were inhibited (Extended Data Fig. 2d), we tested whether cyclin D1-CDK4 regulates PGC-1α acetylation through GCN5, the principal PGC-1α acetyltransferase. Indeed, knockdown of GCN5 significantly blunted fascaplysin-induced PGC-1α deacetylation (Fig. 1e). In contrast, PCAF-mediated acetylation was not affected by fascaplysin, further suggesting that CDK4 inhibition modulates PGC-1α acetylation through GCN5 (Extended Data Fig. 2e). In vitro catalytic activity of GCN5 immunoprecipitated from cells treated with fascaplysin was reduced by 50% relative to vehicle control (Fig. 1f). We observed physical interaction between ectopically expressed or endogenous CDK4 and GCN5, suggesting that CDK4 could regulate GCN5 activity by direct phosphorylation (Fig. 1g, Extended Data Fig. 2f). Cyclin D1-CDK4 kinase directly phosphorylated GCN5 in vitro and its phosphorylation was inhibited by fascaplysin (Fig. 1h, Extended Data 2g). Systematic mutagenesis revealed two phosphorylation sites, T272 and S372, located within the GCN5’s conserved PCAF domain. Alanine substitutions of these two sites (“GCN5 AA”) ablated GCN5 phosphorylation by cyclin D1-CDK4 in vitro, and reduced PGC-1α acetylation (Fig. 1i, 1j, Extended Data Fig. 2h, 2i). Compared to GCN5 wild-type, in vitro catalytic activity of GCN5 AA was decreased, but remained insensitive to fascaplysin (Fig. 1k). CDK4 phosphorylation on GCN5 augmented acetyltransferase catalytic activity by increasing Vmax, while Km for Acetyl-CoA binding was unaffected (Fig. 1k). Because GCN5 functions as a complex with subunits important for its activity16, its phosphorylation by CDK4 could modulate interaction between GCN5 and subunits. We found one subunit, PAF65β, interacting less with GCN5 AA compared to GCN5 wild-type, when tested with modestly overexpressed GCN5, where PGC-1α acetylation was not saturated (Extended Data Fig. 2j, 2k). Taken together, these results indicate that cyclin D1-CDK4 regulates PGC-1α acetylation through the direct phosphorylation and activation of GCN5 acetyltransferase activity.
Since PGC-1α acetylation is tightly linked with its co-transcriptional activity8,9,17, we investigated whether cyclin D1-CDK4 could modulate PGC-1α’s gluconeogenic target genes. To study cyclin D1-CDK4 kinase effects in a PGC-1α mediated manner, we induced PGC-1α in primary hepatocytes via adenoviral overexpression or forskolin addition (Extended Data Fig. 3a). In primary hepatocytes, chemical inhibition of CDK4 significantly increased gluconeogenic genes and glucose production, consistent with reduced PGC-1α acetylation (Fig. 2a, 2b, 2c, Extended Data Fig. 3b). CDK4 depletion produced similar effects (Fig. 2d, 2e, 2f, Extended Data Fig. 3c). Conversely, induction of CKD4 activity by cyclin D1 wild-type overepxression or Cyclin D1 T286A mutant, a hyperactive mutant allele spared from proteasomal degradation19, but not cyclin D1 K112E (a mutant that cannot activate CDK4 kinase activity18), suppressed gluconeogenic genes and glucose production, corresponding with PGC-1α acetylation changes (Fig. 2g, 2h, 2i, Extended Data Fig. 3d).
Extended Data Figure 3.

Cyclin D1-CDK4 regulates gluconeogenesis in primary hepatocytes and in whole animals. a) Western-blot analysis of endogenous, forskolin-induced (Fsk) or adenovirally overexpressed (O/E) PGC-1α. Nuclear extracts of primary hepatocytes were used to immunoprecipitate PGC-1α. Cells were infected with GFP or PGC-1α 48hr prior to harvest. 10μM forskolin was added for 2hr before harvest. b) PD 0332991 increases forskolin-induced gluconeogenic gene expression. Primary hepatocytes were treated with 10μM forskolin for 1.5hr following 3hr of starvation medium incubation while 1μM PD 0332991 was added overnight (one-way ANOVA with Tukey post test, n=3). c) CDK4 knockdown increases forskolin-induced gluconeogenic gene expression (one-way ANOVA with Tukey post test, n=3). d) Cyclin D1 wild-type, but not cyclin D1 K112E mutant, suppresses forskolin-induced gluconeogenic gene expression (one-way ANOVA with Tukey post test, n=3). e) Phosphorylation of GCN5, FoxO1 N-terminus, FoxO1 C-terminus, FoxO3A and PGC-1α SR domain by cyclin D1-CDK4. f) PGC-1α knockdown blocks the increase of forskolin-induced gluconeogenic genes by fascaplysin in HepG2 cells. PGC-1α knockdown or a negative control HepG2 cells were treated with 30μM forskolin and 1μM fascaplysin overnight (one-way ANOVA with Tukey post test, n=3). g) GCN5 knockdown blunts the increase of gluconeogenic gene expression caused by CDK4 knockdown. qRT-PCR analysis of Pck1 and Gcn5 and western-blot of CDK4 and GCN5 knockdown are shown. All cells were infected with PGC-1α adenoviruses (one-way ANOVA with Tukey post test, n=15). h) PD 0332991 increases gluconeogenic genes when combined with GCN5 wild-type (WT) overexpression, but not with GCN5 T272A/S372A (AA) mutant. GFP infected cells shown as a comparison to GCN5 overexpressing cells. All cells were infected with PGC-1α adenoviruses (two-tailed unpaired t-test, n=6). I-j) Insulin levels measured from serum and western-blot analysis of Rb and AKT using nuclear (N) and cytoplasmic (C) liver extracts from mice treated with vehicle or 150mg/kg PD 0332991, shown in Fig. 2lm (i: two-tailed unpaired t-test, n=18/GFP, n=17/PD 0332991). k) Levels of cyclin D1 and Rb phosphorylation in GFP or Cyclin D1 T286A tail-vein injected mice, shown in Fig. 2n-o. Statistical significance is represented by asterisk corresponding to *P<0.05, **P<0.01, ***P<0.001. Data are shown as mean±S.E.M.
Figure 2.

Cyclin D1-CDK4 regulates gluconeogenesis in primary hepatocytes and whole animals. a-b) PD 0332991 increases gluconeogenic gene expression and glucose production (a: one-way ANOVA with Tukey post test, n=3, b: two-tailed unpaired t-test, n=8). c) PGC-1α acetylation is decreased by PD 0332991 treatment. d-e) CDK4 knockdown increases gluconeogenic gene expression and glucose production (d: oneway ANOVA with Tukey post test, n=6, e: two-tailed unpaired t-test, n=6). f) PGC-1α acetylation is decreased upon CDK4 deletion. g-h) Cyclin D1 wild-type decreases gluconeogenic gene expression, and cyclin D1 wild-type and cyclin D1 T286A, but not cyclin D1 K112E, repress glucose production (g: one-way ANOVA with Tukey post test, n=3/GFP, PGC-1α, n=6/Cyclin D1 WT and KE, h: one-way ANOVA with Dunnett post test, n=8). i) Overexpression of cyclin D1 wild-type (WT) and T286A (TA), but not cyclin D1 K112E (KE), induces PGC-1α acetylation. j) GCN5 knockdown blunts the increase of glucose production by CDK4 knockdown (two-tailed unpaired t-test, n=8). k) PD 0332991 increases glucose production with GCN5 wild-type (WT), but not with GCN5 T272A/S372A (AA) (one-way ANOVA with Newman-Keuls post test, n=8). l-m) PD 0332991 administration increases Pck1 gene expression and glycemia in mice (two-tailed unpaired t-test, n=18/vehicle, n=17/PD 0332991). n-o) Gluconeogenic gene expression and glycemia are reduced by cyclin D1 T286A overexpression in liver (two-tailed unpaired t-test, n=10/GFP, n=9/D1 T286A). p) Cyclin D1 T286A overexpression in liver decreases hepatic glucose production capacity assessed by pyruvate tolerance test (two-tailed unpaired t-test, n=20/GFP, n=24/D1 T286A AUC=area under curve). Statistical significance is represented by asterisk corresponding to *P<0.05, **P<0.01, ***P<0.001. Data are shown as mean±S.E.M.
Because cyclin D1-CDK4 can phosphorylate other regulatory components of gluconeogenic pathway20 (Extended Data Fig. 3e), we examined whether cyclin D1-CDK4 kinase modulates glucose production through PGC-1α and GCN5. As expected, the induction of gluconeogenic genes by CDK4 inhibition was completely blunted when PGC-1α was stably knockdown in liver cells (Extended Data Fig. 3f). Also, CDK4 knockdown did not increase glucose production and gluconeogenic gene expression in GCN5 depleted hepatocytes (Fig. 2j, Extended Data Fig. 3g). GCN5 AA had a marginal ability to suppress hepatic gluconeogenesis compared to GCN5 wild-type, and displayed no significant changes when combined with CDK4 inhibition (Fig. 2k, Extended Data Fig. 3h). Together, these results strongly suggest that the effects of cyclin D1-CDK4 on gluconeogenesis are mediated via GCN5-PGC-1α complex.
We examined whether liver gluconeogenesis was altered when cyclin D1-CDK4 kinase activity was manipulated in whole animals. When PD 0332991 was administered to refed mice, it increased Pck1 expression and glycemia without changing circulating insulin levels (Fig. 2l, 2m, Extended Data Fig. 3i, 3j). In contrast, hepatic cyclin D1 T286A expression significantly repressed fasting gluconeogenic genes, glycemia and hepatic capacity to produce glucose as assessed by a pyruvate tolerance test (Fig. 2n, 2o, 2p, Extended Data Fig. 3k). We confirmed that PD 03322991 or cyclin D1 T286A adenoviral administration produced those physiological changes without causing liver toxicity (Extended Data Fig. 4a, 4b). Collectively, these data indicate that changes in hepatic cyclin D1-CDK4 activity are sufficient to control hepatic gluconeogenesis and whole body glucose homeostasis.
Extended Data Figure 4.

PD 0332991 administration or cyclin D1 T286A adenoviral overexpression does not cause toxicity compared to its respective control treatment. a) Basal physiological indexes of mice challenged with either vehicle or PD 0332991 administration (n=5). b) Basal physiological indexes of mice injected with either GFP or cyclin D1 T286A adenoviruses (n=5). (ALT=alanine transaminase, AST=aspartate transaminase, LDH=lactate dehydrogenase, mean±S.E.M)
Next, we investigated if cyclin D1-CDK4 complex is regulated under nutritional and hormonal changes. In spite of that parenchymal hepatocytes are post-mitotic, hepatic protein and mRNA expression of cyclin D1 were significantly increased upon 4hr refeeding, which was not a strain-specific phenomenon (Fig. 3a, 3b, Extended Data Fig. 5a, 5b). This induction of cyclin D1 corresponded with elevated cyclin D1-CDK4 activity as observed by increases of Rb, GCN5 phosphorylation and elevated kinase activity of immunoprecipitated CDK4 upon refeeding (Fig. 3b, 3c, Extended Data Fig. 5c). Interestingly, cyclin D1 expression was regulated upon refeeding only in liver, and CDK4 inhibitor administration altered PGC-1α target genes only in liver and white adipose tissue (Extended Data Fig. 5d, 5e). Although CDK4 regulates glucose metabolism in other tissues than liver, it is unknown whether this regulation is dependent on PGC-1α21.
Figure 3.
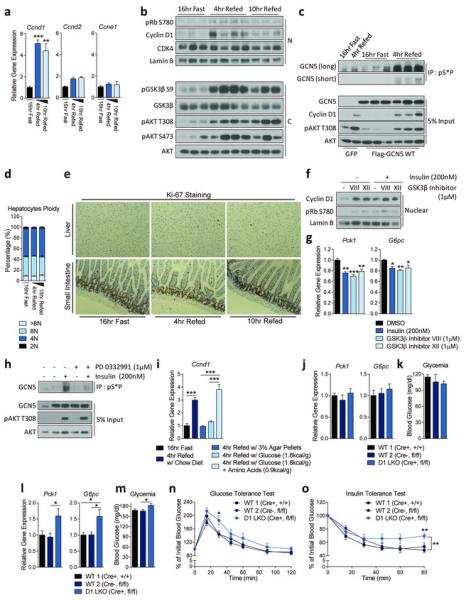
Cyclin D1-CDK4 is regulated by insulin/GSK3β and hepatic cyclin D1 deletion causes increased gluconeogenesis and glycemia upon refeeding. a) Cyclin D1 gene expression is increased during refeeding (one-way ANOVA with Tukey post test, n=3/fast and10hr refed, n=4/4hr refed). b) Cyclin D1 protein and Rb phosphorylation are induced upon refeeding (N=nuclear and C=cytoplasmic liver extracts). c) Phosphorylation of GCN5 is increased upon refeeding. GCN5 was immunoprecipitated using anti-phosphoS*P (pS*P) antibody from livers infected with GFP or GCN5 adenovirus. d) Hepatocytes ploidy does not change upon fasting and refeeding (n=5). e) Ki-67 staining in liver shows no differences upon fasting and refeeding. Small intestine was used as a positive control. f) Nuclear cyclin D1 protein level is increased upon insulin and GSK3β inhibitors treatment in primary hepatocytes. All cells were infected with cyclin D1 wild-type adenovirus. g) Insulin and GSK3β inhibitors suppress gluconeogenic gene expression. All cells were infected with PGC-1α adenovirus (oneway ANOVA with Tukey post test, n=6). h) Phosphorylation of GCN5 is induced by insulin and blunted by PD 0332991 treatment. GCN5 was overexpressed whereas GFP was used as a negative control. i) Cyclin D1 is transcriptionally induced by dietary intake of amino acids. Mice were fasted overnight or refed 4hr with chow diet, empty calorie, glucose or glucose and amino acids diet (one-way ANOVA with Tukey post test, n=5). j-k) Liver-specific cyclin D1 KO (D1 LKO) mice exhibit no differences on gluconeogenic gene expression and glycemia during fasting. l-m) D1 LKO mice display increased gluconeogenic gene expression and glycemia upon 4hr refeeding (one-way ANOVA with Tukey post test, combined 4 cohorts of n=3/fasting, n=5/refeeding). n) D1 LKO mice show mild glucose intolerance (two-way ANOVA, multiple comparison, n=11/WT1, n=7/WT2, n=10/D1 LKO). o) D1 LKO mice exhibit mild insulin intolerance (two-way ANOVA, significant interaction, multiple comparison, n=10/WT1, n=7/WT2, n=9/D1 LKO). Statistical significance is represented by asterisk corresponding to *P<0.05, **P<0.01, ***P<0.001. Data are shown as mean±S.E.M.
Extended Data Figure 5.

Cyclin D1-CDK4 is regulated by insulin/GSK3β and hepatic specific cyclin D1 deletion causes increased gluconeogenesis and glycemia upon refeeding. a) Cyclin D1 transcripts are increased upon refeeding. qRT-PCR analysis of Ccnd1, Ccnd2 and Ccne1 gene expression upon overnight fasting, 4hr and 10hr refeeding in BALB/c mice livers (one-way ANOVA with Tukey post test, n=3). b) Cyclin D1 protein is increased upon refeeding. Western-blot analysis of cyclin D1 protein levels and associated signaling pathway upon fasting and refeeding measured from nuclear (N) and cytoplasmic (C) liver extracts from BALB/c mice. c) Cyclin D1-CDK4 kinase activity is increased upon 4hr refeding. In vitro 32P incorporation into recombinant Rb by immunoprecipitated cyclin D1-CDK4 kinase from whole-cell extracts of overnight fast and 4hr refed livers. d) Western-blot analysis of cyclin D1 protein level and associated signaling pathway upon fasting and refeeding and qRT-PCR analysis of Ccnd1 and Pgc1α mRNA level in various tissues (L=liver, M=skeletal muscle, B=brown adipose tissue, W=epididymal white adipose tissue, and P=pancreas, two-tailed unpaired t-test, n=12/L, n=4/M, B, W, P). e) qRT-PCR analysis of PGC-1α target genes in liver and epididymal white adipose tissues (eWAT) upon vehicle or PD 0332991 treatment (two-tailed unpaired t-test, n=10). f) Ccnb1 and Pcna gene expressions in liver do not change upon fasting and refeeding (n=3/fast and 10hr refed, n=4/4hr refed). g) BrdU incorporation in liver does not change upon fasting and refeeding. Small intestine was used as a positive control. h) Ki-67 staining in liver does not change upon fasting and refeeding following vehicle or PD 0332991 administration. Small intestine used as a positive control. i) Ki-67 staining in liver does not change upon fasting and refeeding following GFP or cyclin D1 T286A tail-vein injection. Small intestine used as a positive control. j) Hepatic ploidy profiles of livers of GFP or cyclin D1 T286A adenovirus tail-vein injected mice do not show significant difference. Ploidy analysis of primary hepatocytes isolated from livers measured by propidium iodide staining and flow cytometry (n=6/fast and 4hr refed, n=4/10hr refed). k) Western-blot analysis of endogenous nuclear (N) and cytoplasmic (C) cyclin D1 protein level upon insulin or GSK3β inhibitors treatments in primary hepatocytes. l) PGC-1α acetylation is increased upon insulin or GSK3β inhibitors treatment in primary hepatocytes. m) No effect of insulin or GSK3β inhibitors on cyclin D1 mRNA level (n=3). n) Minimum essential medium (MEM) amino acids addition increases cyclin D1 mRNA in primary hepatocytes (one-way ANOVA with Tukey post test, n=3). o) Insulin does not change Ccnd1 mRNA in primary hepatocytes (oneway ANOVA with Tukey post test, n=3). p-q) Body, liver weights and Ccnd1 and Ccnd2 gene expression of wild-type and liver-specific cyclin D1 KO (D1 LKO) mice (combined 4 cohorts of n=3/fasting, n=5/refeeding). r) Western-blot analysis of cyclin D1 protein levels and associated signaling pathway by using nuclear and cytoplasmic liver extracts from wild-type and D1 LKO mice upon fasting (F) and 4hr refeeding (R). s) Endogenous acetylation of PGC-1α is decreased in livers of D1 LKO mice compared to wild-type mice. Western-blot analysis of acetylation of PGC-1α immunoprecipitated from liver nuclear extracts. All mice were sacrificed upon 4hr refeeding. t-u) PD 0332991 increases glycemia with similar tendency for gluconeogenic gene expression only in wild-type mice, but not in D1 LKO mice (two-tailed unpaired t-test, n=8, except n=6 for vehicle treated wild-type mice). v-w) Gluconeogenic gene expression and hepatic glucose production are increased in primary hepatocytes isolated from D1 LKO mice (v: one-way ANOVA Tukey post test, n=3, w: two-tailed unpaired test, n=6). Statistical significance is represented by asterisk corresponding to *P<0.05, **P<0.01, ***P<0.001. Data are shown as mean±S.E.M.
Cyclin D1-CDK4 activity increase upon refeeding was uncoupled from cell cycle progression. Known cell division markers did not change upon refeeding (Extended Data Fig. 5f). Consistently, we found no difference in hepatocyte ploidy profile, Ki-67 expression levels and BrdU incorporation between the livers of fasted and refed mice (Fig. 3d, 3e, Extended Data Fig. 5g). Alteration of cyclin D1-CDK4 activity in liver by hepatic overexpression of cyclin D1 T286A or by a pharmacological inhibition caused no changes in cell cycle progression during fasting and refeeding, analyzed by hepatic ploidy and Ki-67 expression (Extended Data Fig. 5h, 5i, 5j).
GSK3β, active during fasting and inactive during refeeding due to its phosphorylation by insulin-AKT signaling, negatively regulates cyclin D1 through phosphorylation of T286, causing nuclear exclusion of cyclin D1 and proteasomal degradation19,22. We hypothesized that insulin stimulation and subsequent inactivation of GSK3β allow cyclin D1 to form an active complex with CDK4, promoting PGC-1α acetylation. Insulin or two GSK3β inhibitors increased nuclear cyclin D1 protein when tested in an overexpressed or endogenous manner (Fig. 3f, Extended Data Fig. 5k). This increase correlated with elevated PGC-1α acetylation and significant reduction of gluconeogenic genes (Fig. 3g, Extended Data Fig. 5l). In accordance, insulin increased CDK4-mediated GCN5 phosphorylation (Fig. 3h). Interestingly, we found that amino acids, but not insulin, increased cyclin D1 mRNA expression in primary hepatocytes (Extended Data Fig. 5m, 5n, 5o). To test if amino acids could be dietary components promoting cyclin D1 mRNA in liver, mice were fed with empty calorie, glucose only or glucose and amino acids diets for 4 hr. A significant cyclin D1 mRNA induction was observed only when amino acids were added to the diet (Fig. 3i). These results indicate that amino acids contribute to the fed response along with insulin signaling to enhance cyclin D1 levels during refeeding.
To test if cyclin D1-CDK4 complex constitutes an important axis of the nutrient and insulin signaling to regulate glucose metabolism, we generated liver-specific cyclin D1 KO (“D1 LKO”) mice by crossing mice expressing a floxed cyclin D1 allele23 with albumin-Cre expressing mice24. Cyclin D1 deletion in liver did not interfere with liver development and caused no compensatory increases on other cyclins (Extended Data Fig. 5p, 5q). D1 LKO mice had similar gluconeogenic gene expression and glycemia during fasting compared to wild-type mice, consistent with CDK4 inactivation due to the absence of cyclin D1 (Fig. 3j, 3k). However, in the refed state, D1 LKO mice showed a significant increase in gluconeogenic genes and glycemia compared to wild-type mice while induction of Rb phosphorylation and PGC-1α acetylation upon refeeding were lacking (Fig. 3l, 3m, Extended Data Fig. 5r, 5s). CDK4 inhibitor failed to further increase gluconeogenic genes and glycemia in D1 LKO mice, suggesting cyclin D1 in liver mediates metabolic effects caused by CDK4 inhibition (Extended Data Fig. 5t, 5u). Primary hepatocytes isolated from D1 LKO mice had increased gluconeogenic gene expression and higher glucose production compared to wild-type hepatocytes (Extended Data Fig. 5v, 5w). Consistent with elevated refeeding blood glucose levels, D1 LKO mice exhibited moderate, yet significant insulin and glucose intolerance, further supporting that cyclin D1-CDK4 mediates, at least in part, insulin action in liver (Fig. 3n, 3o). When taken in aggregate, our findings indicate that insulin suppresses hepatic gluconeogenesis during refeeding, in part by activating cyclin D1-CDK4 complex to suppress PGC-1α activity.
Lastly, we investigated whether cyclin D1-CDK4 activity was altered in diabetic mice. In the livers of fasted Leprdb/db mice, basal phosphorylations of AKT and its downstream targets were elevated, consistent with the hyperinsulinemia of db/db mice (Fig. 4a). Accordingly, db/db mice had elevated fasted levels of cyclin D1 and phosphorylation of Rb, comparable to refed db/+ mice. In db/db mice, gluconeogenic genes and insulin signaling were refractory to fasting/refeeding transitions, indicating an uncoupling of insulin signaling and its repressive effects on gluconeogenic programming (Fig. 4a, Extended Data Fig. 6a). We observed similar chronic elevations of cyclin D1 and insulin signaling impairment in high fat diet fed mice (Extended Data Fig. 6b). In accordance with chronic elevation of cyclin D1 in diabetic mice, phosphorylation of GCN5 remained higher, refractory to fasting/refeeding transitions in diabetic compared to control mice (Extended Data Fig. 6c, 6d). These results suggest that in insulin resistant mice, compensatory hyperinsulinemia maintains a chronically active cyclin D1- CDK4 complex that is not sufficient to counteract increased gluconeogenesis. Hyperinsulinemia might explain other studies showing different activities of insulin signaling in fasted diabetic animals25,26.
Figure 4.

In diabetic hyperinsulinemic mice, cyclin D1-CDK4 is dysregulated and hyperactivation of cyclin D1-CDK4 attenuates the diabetic phenotype. a) Cyclin D1 is chronically elevated in livers of db/db mice (N=nuclear and C=cytoplasmic liver extracts). b-c) Cyclin D1 T286A, but not cyclin D1 K112E, overexpression in liver represses gluconeogenic genes and glycemia in db/db mice (one-way ANOVA, Tukey post test, n=6/GFP, D1 K112E, n=5/D1 T286A). d-h) In db/db mice, cyclin D1 T286A overexpression in liver suppresses hepatic glucose production tested by hyperinsulinemic-euglycemic clamp. d) Plasma glycemia and glucose infusion rate (twoway ANOVA, significant interaction, n=7). e) Body weights. f) Clamped glucose infusion rate. g) Whole-body glucose uptake. h) Hepatic glucose output (average of last 40min values for f-g, two-tailed unpaired t-test for d-h, n=7). Statistical significance is represented by asterisk corresponding to *P<0.05, **P<0.01, ***P<0.001. Data are shown as mean±S.E.M.
Extended Data Figure 6.

In diabetic hyperinsulinemic mice, cyclin D1-CDK4 is dysregulated and hyperactivation of cyclin D1-CDK4 attenuates the diabetic phenotype. a) qRT-PCR analysis of gluconeogenic and Ccnd1 gene expression changes upon fasting and refeeding in Leprdb/+ (db/+) and Leprdb/db (db/db) mice livers (two-tailed unpaired t-test, n=3). b) Cyclin D1 protein is chronically elevated upon fasting and refeeding in livers of high fat diet fed mice compared to control diet fed mice. Nuclear (N) and cytoplasmic (C) liver extracts were used. c-d) Phosphorylation of GCN5 is elevated upon fasting in db/db or high fat diet fed (HFD) mice liver compared its respective control mice and it remains insensitive to fast-refed transitions. Western-blot analysis of GCN5 immnunoprecipiated by anti-phosphoS*P (pS*P) antibody using liver extracts from mice that were tail-vein injected with adenoviruses expressing GFP or GCN5 (F=16hr fast, R=4hr refed). e) Cyclin D1 and Rb phosphorylation levels in livers from db/db mice tail-vein injected with GFP, cyclin D1 T286A, or cyclin D1 K112E adenoviruses, shown in Fig. 4b-c. Nuclear and cytoplasmic liver extracts were used. f-g) Cyclin D1 T286A overexpression reduces gluconeogenic genes and glycemia in high fat diet fed mice (two-tailed unpaired t-test, n=6/GFP, n=7/D1 T286A). h) Cyclin D1 and Rb phosphorylation levels in livers of high fat diet fed mice that were tail-vein injected with adenoviruses expressing GFP or cyclin D1 T286A, shown in Extended Data Fig. 4f-g. i) Overall Model. Statistical significance is represented by asterisk corresponding to *P<0.05, **P<0.01, ***P<0.001. Data are shown as mean±S.E.M.
We examined whether hyperactivation of cyclin D1-CDK4 complex in db/db mice could alleviate hyperglycemia. Hepatic overexpression of cyclin D1 T286A in db/db mice, reduced gluconeogenic genes and glycemia to db/+ mouse levels whereas cyclin D1 K112E caused only minor suppressions of those parameters (Fig. 4b, 4c, Extended Data Fig. 6e). A similar pattern was observed in high fat diet fed mice (Extended Data Fig. 6f, 6g, 6h). We confirmed that cyclin D1 T286A overexpression in db/db mice indeed repressed hepatic glucose production by using hyperinsulinemic-euglycemic clamp experiments (Fig. 4d, 4e, 4f, 4g, 4h).
Our studies support a regulatory model in which insulin facilitates the formation of an active cyclin D1-CDK4 complex that subsequently suppresses gluconeogenesis, in part, by decreasing PGC-1α activity through GCN5-mediated acetylation (Extended Data Fig. 6i). Under type 2 diabetic conditions, cyclin D1 protein levels are dysregulated due to hyperinsulinemia and insulin resistance, which contributes to its inability to fully repress gluconeogenesis during the fed state. In addition, cyclin D1 is also controlled at the transcriptional level by dietary intake of amino acids, further contributing to insulin’s action, although the mechanisms are currently unknown. Despite the functional activation of cyclin D1-CDK4 during refeeding, hepatocytes undergo no cell cycle progression. Interestingly, genome-wide association studies have revealed that mutations of CDKN2A, a CDK4 inhibitor, are significantly correlated with a high risk of type 2 diabetes27. Combined with the role of cyclin D1-CDK4 in β-islet pancreatic cell proliferation and the involvement of its target, E2F1, in oxidative metabolism28,29, induction of gluconeogenesis in liver could predict the tendency of hyperglycemia in cancer patients treated with CDK4 inhibitors30 Future studies will address the metabolic functions of cell cycle components in different tissues and their utility as therapeutictargets in metabolic diseases.
Methods
Animal Experiments
8-10 weeks old male BALB/c mice and 8-10 weeks old male C57BL/6 mice were purchased from Taconic Farms. 10 weeks old male BKS.Cg-Dock7m +/+ Leprdb/J heterozygous (db/+) and homozygous (db/db) mice were from Jackson Laboratory. After a delivery of mice to the animal facility, a one-week acclimation period was given before experiments. No randomization and blind techniques were applied in this study. Liver-specific cyclin D1 KO (D1 LKO) mice were generated by crossing mice expressing a floxed Cyclin D1 allele (mixed background between 129/SvJ and C57BL/6 and back-crossed to C57BL/6 for 5 times)23 with albumin-Cre expressing mice24. 60 kcal% high fat diet (D12492i) and its control diet (D12450J) were administered to animals for 3 months prior to experiments.
PD 0332991 was dissolved in 20mM sodium lactate solution made at pH 4.0. The compound (150mg/kg) or buffer solution was given to each mouse once per day via oral gavage. After two consecutive administrations, all mice were sacrificed upon 4hr refeeding followed by overnight fasting, except the administration was reduced to once in the experiments with D1 LKO mice. To overexpress cyclin D1 T286A or K112E in liver, adenoviruses were injected through tail-vein and GFP adenovirus was used as a negative control (all constructs with 1.5X10⁹ infectious particles per lean mouse and 2.0X10⁹ per obese mouse). All mice were sacrificed after 4 days of injection followed by overnight fasting unless indicated otherwise (the fasting started 1hr after the dark-cycle initiated in the facility). Prior to the sacrifice, all mice were tail bled to measure glycemia using Precision Xtra from Abbott Diabetes Care. Upon harvest, livers were removed and snap frozen in liquid nitrogen until processed.
For BrdU incorporation, 100μg per body weight gram was given intraperitoneally 16hr prior to the harvest. For RNA extraction from pancreas, we followed the modified protocol previously reported31 and the quality of RNA samples was verified by 28S/18S presence using 1% agarose gel electrophoresis. For diet experiments, 3% agar was autoclaved and mixed with glucose (1.8 kcal/g), amino acids (0.9 kcal/g) or both. Each amino acid was weighed and mixed as LabDiet (5001) formula indicates. For pyruvate tolerance test, pyruvate (2g/kg, dissolved in PBS) was injected intraperitoneally to overnight-fasted mice, 4 days after adenoviral injections. For glucose tolerance test and insulin tolerance test, mice were fasted for 6hr prior to injection and glucose (1g/kg dissolved in PBS) and insulin (0.75U/kg diluted in PBS) were delivered by intraperitoneal injection. Glycemia was monitored by tail-bleeding every 15-20 minutes and if hypoglycemia caused by insulin injection was observed, 1g/kg glucose was injected and the mice was exempted from experiment. All animal experiments were designed and conducted by following the Dana-Farber's Institutional Animal Care and Use Committee.
Insulin and Serum Biochemistry Measurement
Upon sacrifice, serum samples were gathered from blood collected via cardiac puncture. Insulin was measured with Ultra Sensitive Mouse Insulin ELISA Kit (Crystal Chem, 90080). All kits used to measure serum biochemistry including alanine transaminase (EALT-100), aspartate transaminase (EASTR-100), lactate dehydrogenase (DLDH-100), creatine kinase (ECPK-100) and total bilirubin (DIBR-100), were purchased from Bioassay Systems.
High Throughput Chemical Screening
U-2OS human osteosarcoma cells were infected with Flag-tagged-PGC-1α and GCN5 expressing adenovirus and were split to 384 well plates. The chemical compounds were added to the cells and incubated overnight. Cells were harvested and lysates were transferred to ELISA plates (Nunc, 460372) coated with M2 Flag-antibody (Sigma, F1804) in order to immunoprecipitate PGC-1α. The plates were washed with PBST buffer and acetylated-lysine antibody (Cell Signaling, 9441) was added to detect the acetylation level of PGC-1α. After primary antibody incubation, HRP-IgG-Rabbit antibody (Jackson Immuno Research, 711035152) was added as a secondary antibody. A plate reader recorded the signal after incubating the plates with HRP-reacting ELISA substrate (Thermo Scientific, 37069) to generate chemiluminescence at 425nm. Further details for the screening conditions are available upon request.
Adenoviruses, Constructs and Recombinant Information
All adenoviruses were generated by using pAdTrack/pAdEasy system and amplified in HEK293A cells. Adenoviruses were purified by cesium chloride gradient centrifugation and dialyzed in Tris-HCl buffer made at pH 8 before usage. Flag-HA-PGC-1α (mouse) and Flag-GCN5 (mouse) adenoviruses were made as previously described8,9. Flag-Cyclin D1 wild-type and K112E (mouse) adenoviruses were generated by subcloning from reported constructs given from Dr. Piotr Sicinski. Flag-Cyclin D1 T286A (human) was subcloned from a construct obtained from Addgene deposited by Dr. Bruce Zetter. Adenovirus with short-hairpin RNA was driven by a U6 promoter and subcloned from a pLKO.1 vector. pLKO.1 vector with shRNA against mouse CDK4 construct targeting 5’-CCTAGCTAGAATCTACAGCTA-3’ was obtained from Dana-Farber RNAi Screening Facility. pLKO.1 vector with shRNA containing scrambled sequence, 5’-CAACAAGATGAAGAGCACCAA-3’, were used to generate a control virus.
The sequence of shGcn5 against GCN5 was previously used and described9. pLKO.1 vectors with various shRNAs against human CDK4 were obtained from Dana-Farber RNAi Screening Facility with following sequences; shCdk4#1 5’-GACACTGAGAGGGCAATCTTT-3’, shCdk4#2 5’-GTGGAGTGTTGGCTGTATCTT-3’, shCdk4#3 5’-CATGCCAATTGCATCGTTCAC-3’, shCdk4#4 5’-GAGATTACTTTGCTGCCTTAA-3’, and shCdk4#5 5’-GTTCTTCTGCAGTCCACATAT-3’.
Cell Lines and Primary Hepatocytes Cultures
HEK293A, U-2OS, HepG2 cells were purchased from ATCC (CRL-1573, HTB-96 and HB-8065) and maintained in DMEM containing 10% FBS under 5% CO2 condition. All transformed cells were tested negative for mycoplasma using a PCR mycoplasma detection kit (Takara Bio Inc, 6601). All constructs were transfected using Polyfect (Qiagen, 301105) and cells were harvested after 48hr or 72hr of transfection. Medium was changed everyday as well as 3hr prior to harvest. For U-2OS cells, 1μM CDK4 inhibitors were added 8hr before the harvest. DMSO was used as a negative control treatment for all chemical treatments used in this study. Lentiviral shRNAs for shScr and Pgc1α were produced by transfecting HEK293A cells with pLKO.1 shScr and shPgc1α and the sequences of shRNAs have been reported previously32. Control and PGC-1α stably knockdown HepG2 cells were generated by infecting cells with lentiviral particles and selected with puromycin for a week.
Primary hepatocytes were isolated from 8-10 weeks old male BALB/c mice by perfusion with liver digest medium (Invitrogen, 17703-034) followed by 70μm mesh filtration. Percoll (Sigma, P7828) gradient centrifugation allowed primary hepatocytes isolation from other cell types and debris. On 6 well plates, 4X10⁵ cells per well were seeded in plating medium (DMEM with 10% FBS, 2mM sodium pyruvate, 1% penicillin/streptomycin, 1μM dexamethasone, and 100nM insulin). After 3hr of seeding, medium was changed and incubated overnight in maintenance medium (DMEM, 0.2% BSA, 2mM sodium pyruvate, 1% penicillin/streptomycin, 0.1μM dexamethasone, and 1nM insulin). To infect cells with adenovirus, 3-8X10⁶ infectious particles per well were added to cells for 4hr. Cells were harvested within 48hr after infection and medium was changed everyday as well as 3hr prior to harvest. 1μM CDK4 inhibitors and GSK3β inhibitors were added overnight whereas 200nM insulin was added 1.5hr prior to the harvest. When necessary, medium was changed to starvation medium (DMEM, 0.2% BSA, 2mM sodium pyruvate, and 1% penicillin/streptomycin) for 3hr and cells were stimulated with 10μM forskolin for additional 1.5hr. When glucose production was measured, cells were incubated in starvation medium for 2hr followed by 3hr incubation in glucose free medium (phenol-red/glucose free DMEM, 0.2% BSA, 2mM sodium pyruvate and 20mM sodium lactate). Glucose level in medium was measured by glucose assay kit from Bioassay System (EBGL-100) following the manufacturer’s instruction. For amino acids addition, primary hepatocytes were incubated overnight with amino acids free medium (Earl’s balanced salt solution, 25mM glucose, 2mM sodium pyruvate, 1% penicillin/streptomycin, BME vitamin mix and 0.2% fatty acids free BSA). Cells were harvested after 4hr incubation with 4mM HEPES-KOH pH 7.4 buffer, MEM (minimum essential medium) amino acids or nonessential amino acids.
Cell Lysis, Immunoprecipitation and Western Blot Analysis
In case of PGC-1α acetylation detection from PGC-1α overexpressed cells, cells were harvested in RIPA buffer (containing protease inhibitor cocktail, 5mM NaF, 5mM glycerate-2-phosphate, 20mM nicotinamide, 1μM DTT and 1μM trichostatin A). Flag-HAPGC-1α was immunoprecipitated with Flag-beads (Sigma A2220). For endogenous PGC-1α immunoprecipitation, cells or pulverized tissues were incubated with buffer A in order to obtain nuclear pellets (buffer A: 10mM HEPES-KOH pH 7.9, 10mM KCl, 1.5mM MgCl2, 0.25% Igepal and reagents mentioned above). Once cytoplasmic fractions were removed, nuclear pellets were lysed in RIPA buffer without SDS. From the lysate, endogenous PGC-1α was immunoprecipitated by anti-PGC-1α antibody (Santa Cruz Biotechnology sc-13067) coupled with Dynabeads protein A (GE Lifescience 1001D). For endogenous co-immunoprecipitation experiments, proteins from nuclei were extracted in CHAPS based lysis buffer (10mM HEPES-KOH pH 7.4, 150mM NaCl, 0.5% Igepal, 0.3% CHAPS, 10% glycerol and reagents mentioned above). The lysate was precleared with protein A (GE Lifescience 17-0780-01) and anti-CDK4 antibody (Santa Cruz Biotechnology sc-260) was added in order to immunoprecipitate. GCN5 pull-down with anti-phospho-S*P antibody was carried out with whole cell lysates extracted with RIPA buffer without SDS followed by protein A preclearing and incubation with anti-phospho-S*P antibody (Cell Signaling 2325). All immunoprecipitated samples were washed at least 4 times with lysis buffer. For all endogenous immunoprecipitation experiments, rabbit IgG antibody was used as a negative control.
The following antibodies were used for western blot analysis: anti-PGC-1α (sc-13067), anti-CDK4 (sc-260), anti-Cyclin D1 (sc-450) from Santa Cruz Biotechnology; anti-Acetylated-Lysine (9441), anti-GCN5 (3305), anti-pSer780 Rb (3590 or 8180), anti-Rb (9313), anti-Cyclin D1 (2978), anti-pThr308 AKT (2965), anti-pSer473 AKT (4060), anti-AKT (9272), anti-pSer9 GSK3β (9323), anti-GSK3β (9315) from Cell signaling; anti-Lamin B (ab16048), anti-Rabbit IgG (ab37415) from Abcam, anti-tubulin (05-661) from Millipore; anti-Flag (A8592), anti-βactin (A2228) from Sigma. Anti-PAF65β antibody was given from Dr. Yoshihiro Nakatani33.
In Vitro CDK4/Cyclin D1 Kinase Assay
GST-Cyclin D1-CDK4 complex (0142-0143-1) and GST-Rb (733-928aa, 0040-0000-6) were purchased from ProQinase and 6XHis-GCN5 full length (ALX-201-280-C002) was from Enzo Life Science. Recombinant GST-GCN5 proteins (1-224aa, 1-386aa, 1-553aa, 1-837aa) were generated with pGEX-5X-2 vectors containing the corresponding sequences of mouse GCN5. pGEX-2X-GST-FoxO1 (1-300aa) and FoxO1 (290-570aa) were a generous gift from Dr. Alex Banks. pGEX 4T-3 FoxO3A was purchased from Addgene deposited by Dr. Michael Greenberg. GST-PGC-1α SR domain protein was generated in the lab34. For the comparison between GCN5 and Rb phosphorylation, 6XHis-GCN5 (200ng), GST-Rb (150ng) and GST-cyclin D1-CDK4 (50ng) were used in the assay. Kinase reactions were carried out in a kinase buffer (50mM HEPES-KOH buffered at pH 7.5, 10mM MgCl2) with 20μM ATP, 1mM DTT and 2.5μCi of [γ-32P]-ATP from Perkin Elmer (BLU002A250UC). The reaction was incubated at 30°C for 30min and terminated by adding SDS sample buffer and boiling at 100°C for 5min. Recombinant proteins were analyzed after SDS-PAGE gel electrophoresis separation and silver-stained with SilverQuest silver staining kit from Invitrogen (LC6070).
For in vitro kinase assay with immunoprecipitated cyclin D1-CDK4 kinase from liver, lysates were extracted from pulverized livers by using Ipegal based buffer (20mM HEPES-KOH pH 7.9, 125mM NaCl, 1mM EDTA, 1% Ipegal, protease inhibitor cocktail, 5mM NaF, 5mM glycerate-2-phosphate, 20mM nicotinamide, 1μM DTT and 1μM trichostatin A). Cyclin D1-CDK4 kinase was immunoprecipitated from 400μg of lysates by anti-CDK4 antibody and rabbit IgG antibody was used as a negative control. Kinase reactions were carried out with 2.5μg of recombinant Rb in a similar condition described above except 5mM NaF and 5mM glycerate-2-phosphate were included in a kinase buffer.
In Vitro GCN5 Acetyltransferase Activity Assay
Flag-GCN5 was immunoprecipitated with Flag-beads from nuclear lysates of U-2OS cells that were infected with GCN5 adenoviruses and treated with DMSO or 1μM fascaplysin. Flag-GCN5 protein was eluted from the beads by rotating the lysates and beads with 3XFlag peptide (Sigma F4799) at 4°C for 2hr. The eluates were further purified using Amicon centrifugal filters (Millipore UFC5030). Following the manufacturer's instructions, the enzymatic activity was measured using a fluorimetric acetyltransferase assay kit (Active Motif 56100). Kinetic constants were calculated with Michaelis-Menten equation based on arbitrary fluorescence unit generated during 15min reaction.
Gene Expression Analysis
Total RNA was isolated with Trizol (Invitrogen, 15596-026). 2μg of RNA was used to generate cDNA with High Capacity cDNA Reverse Transcription Kit (Applied Biosystmes, 4368813) following the manufacturer’s protocol. For gene expression analysis, cDNA samples were mixed with Sybr Green qPCR mastermix (Applied Biosystem 4309155) and were analyzed by CFX384 Real-Time system from Bio-Rad. All primers and sequences are available upon request.
FACS Analysis for Hepatocytes Ploidy Proflie
Primary hepatocytes were isolated as described above. The cells were suspended in PBS and 1X10⁶ cells were added drop-by-drop to pre-chilled 75% Ethanol for 30min. Ethanol was aspirated and cells were washed and resuspended in PBS with RNase A (Invitrogen, 12091-021) at a final concentration of 70units/ml. Propidium iodide (BD Biosciences, 556463) was added at a final concentration of 5μg/ml to the cells and incubated for 30min with brief vortexing in between. The samples were protected from light until analyzed with BD FACSCanto II.
BrdU and Ki-67 Staining
Upon sacrifice, liver and small intestine were collected. Liver was washed in PBS briefly and small intestine was flushed and washed with PBS. Tissues were fixed in 4% formaldehyde for 48hrs and transferred to 70% ethanol before paraffin-embedded and sectioned. Anti-BrdU antibody (B2531) was from Sigma. The antibody was run on an automated platform, Leica BOND-III. The retrieval step used Leica’s ER1 solution for 30min, and the primary antibody was incubated at 1:2000 dilution for 30min. The Bond Polymer Refine Detection kit was used which includes the secondary and DAB chromogen detection. The Ki-67 was also run on the BOND-III using the same detection kit. Anti-Ki-67 antibody (VP-RM04) was from Vector and was incubated at 1:250 dilution for 30min. The retrieval solution used on the BOND-III was Leica's ER2 antigen retrieval solution and incubated for 20min.
Hyperinsulinemic-euglycemic clamp studies
Hyperinsulinemic euglycemic clamps were performed as previously reported with minor modifications35. Mice were operated to implant an indwelling catheter in the right jugular vein seven days prior to study. Four days before study, mice were infected with GFP or cyclin D1 T286A adenovirus by tail vein injection. Following overnight fasting, mice were infused with a fixed amount of insulin (40 mU/kg/min) and a variable amount of 20% dextrose to maintain euglycemia. 3-[3H] glucose was included in the infusates in order to trace whole-body rates of glucose metabolism. Whole-body glucose uptake was determined under steady-state conditions during the final 40 minutes of the clamp when exogenous glucose infusion and endogenous glucose production are in equilibrium with whole-body disposal. Whole-body glucose disposal was calculated as the ratio of the 3-[3H]-glucose infusion rate and the specific activity of plasma glucose and hepatic glucose production represents the difference between the glucose infusion rate and whole-body uptake calculation.
Statistics
All statistics are described in figure legends. In general, for two experimental comparisons, two-tailed unpaired student t-test was used. For multiple comparisons, one-way ANOVA with Tukey, Newman-Keuls or Dunnett post test were applied. For glucose tolerance test, insulin tolerance test and hyperinsulinemic-euglycemic clamp, two-way ANOVA with repeated comparison was applied. When cells were used for experiments, three replicates per treatment were chosen as an initial sample size. All western-blot analysis has been repeated at least three times. In case of mice experiments that require technical manipulations, at least 7 mice were used per treatment based on our previous experiences. If technical failures such as tail-vein injection failure, inadequate intraperitoneal injection and oral gavage occur prior to harvest, those samples were excluded from final analysis. Statistical significance is represented by asterisk corresponding to *P<0.05, **P<0.01, ***P<0.001.
Acknowledgements
We thank all the members of the Puigserver lab for important discussions and suggestions regarding this project. The authors also appreciate the consultations and efforts from Mark Jedrychowski and Steven Gygi for proteomic analysis. Y. L. was supported in part by a 21st Century Leaders scholarship from Ewha Womans University. J.E.D. was supported in part by an NRSA Kirschstein fellowship from the National Institutes of Health. The participating researchers were supported with funds from the DFCI and with grants from the American Diabetes Association, Department of Defense, NIH/NIDDK (RO1069966 and R24DK080261-06), NIH (RO3 MH092174) awarded to P.P., NIH (RO1 CA108420) awarded to P.S. and NIH (DK059635) awarded to Yale's Mouse Metabolic Phenotyping Center/G.I.S.
Footnotes
Author Contributions
P.P. and Y.L. conceived the project. Y.L. designed and performed majority of the experiments aided by constructive discussions with P.P.; J.E.D. also contributed in the design and discussions of the manuscript. Additional advice in the design and execution of the experiments were provided from F.V. and J.-H.L. H.C. assisted mice experiments. Y.J.C. and P.S. provided D1 fl/fl mice and helped with BrdU incorporation and Ki-67 staining experiments. M.J., J.P.C., H.-B.R., X.Y., and G.I.S. carried out hyperinsulinemic-euglycemic clamp experiment, analyzed, interpret and discussed the data. N.T. was instrumental assisting with performance and analysis of chemical screening. Y.L. and P.P. wrote the manuscript.
References
- 1.Nakae J, Park BC, Accili D. Insulin stimulates phosphorylation of the forkhead transcription factor FKHR on serine 253 through a Wortmannin-sensitive pathway. The Journal of biological chemistry. 1999;274:15982–15985. doi: 10.1074/jbc.274.23.15982. [DOI] [PubMed] [Google Scholar]
- 2.Cho H, et al. Insulin resistance and a diabetes mellitus-like syndrome in mice lacking the protein kinase Akt2 (PKB beta). Science. 2001;292:1728–1731. doi: 10.1126/science.292.5522.1728. doi:10.1126/science.292.5522.1728. [DOI] [PubMed] [Google Scholar]
- 3.Dentin R, et al. Insulin modulates gluconeogenesis by inhibition of the coactivator TORC2. Nature. 2007;449:366–369. doi: 10.1038/nature06128. doi:10.1038/nature06128. [DOI] [PubMed] [Google Scholar]
- 4.Matsumoto M, Pocai A, Rossetti L, Depinho RA, Accili D. Impaired regulation of hepatic glucose production in mice lacking the forkhead transcription factor Foxo1 in liver. Cell metabolism. 2007;6:208–216. doi: 10.1016/j.cmet.2007.08.006. doi:10.1016/j.cmet.2007.08.006. [DOI] [PubMed] [Google Scholar]
- 5.Puigserver P, et al. Insulin-regulated hepatic gluconeogenesis through FOXO1-PGC-1alpha interaction. Nature. 2003;423:550–555. doi: 10.1038/nature01667. doi:10.1038/nature01667. [DOI] [PubMed] [Google Scholar]
- 6.Li X, Monks B, Ge Q, Birnbaum MJ. Akt/PKB regulates hepatic metabolism by directly inhibiting PGC-1alpha transcription coactivator. Nature. 2007;447:1012–1016. doi: 10.1038/nature05861. doi:10.1038/nature05861. [DOI] [PubMed] [Google Scholar]
- 7.Estall JL, et al. Sensitivity of lipid metabolism and insulin signaling to genetic alterations in hepatic peroxisome proliferator-activated receptor-gamma coactivator-1alpha expression. Diabetes. 2009;58:1499–1508. doi: 10.2337/db08-1571. doi:10.2337/db08-1571. [DOI] [PMC free article] [PubMed] [Google Scholar]
- 8.Rodgers JT, et al. Nutrient control of glucose homeostasis through a complex of PGC-1alpha and SIRT1. Nature. 2005;434:113–118. doi: 10.1038/nature03354. doi:10.1038/nature03354. [DOI] [PubMed] [Google Scholar]
- 9.Lerin C, et al. GCN5 acetyltransferase complex controls glucose metabolism through transcriptional repression of PGC-1alpha. Cell metabolism. 2006;3:429–438. doi: 10.1016/j.cmet.2006.04.013. doi:10.1016/j.cmet.2006.04.013. [DOI] [PubMed] [Google Scholar]
- 10.McKeehan WL, Adams PS, Rosser MP. Direct mitogenic effects of insulin, epidermal growth factor, glucocorticoid, cholera toxin, unknown pituitary factors and possibly prolactin, but not androgen, on normal rat prostate epithelial cells in serum-free, primary cell culture. Cancer research. 1984;44:1998–2010. [PubMed] [Google Scholar]
- 11.Ish-Shalom D, et al. Mitogenic properties of insulin and insulin analogues mediated by the insulin receptor. Diabetologia. 1997;40(Suppl 2):S25–31. doi: 10.1007/s001250051393. [DOI] [PubMed] [Google Scholar]
- 12.Soni R, et al. Inhibition of cyclin-dependent kinase 4 (Cdk4) by fascaplysin, a marine natural product. Biochemical and biophysical research communications. 2000;275:877–884. doi: 10.1006/bbrc.2000.3349. doi:10.1006/bbrc.2000.3349. [DOI] [PubMed] [Google Scholar]
- 13.Malumbres M, Barbacid M. Cell cycle, CDKs and cancer: a changing paradigm. Nature reviews. Cancer. 2009;9:153–166. doi: 10.1038/nrc2602. doi:10.1038/nrc2602. [DOI] [PubMed] [Google Scholar]
- 14.Kato J, Matsushime H, Hiebert SW, Ewen ME, Sherr CJ. Direct binding of cyclin D to the retinoblastoma gene product (pRb) and pRb phosphorylation by the cyclin D-dependent kinase CDK4. Genes & development. 1993;7:331–342. doi: 10.1101/gad.7.3.331. [DOI] [PubMed] [Google Scholar]
- 15.Fry DW, et al. Specific inhibition of cyclin-dependent kinase 4/6 by PD 0332991 and associated antitumor activity in human tumor xenografts. Molecular cancer therapeutics. 2004;3:1427–1438. [PubMed] [Google Scholar]
- 16.Boyer LA, et al. Essential role for the SANT domain in the functioning of multiple chromatin remodeling enzymes. Molecular cell. 2002;10:935–942. doi: 10.1016/s1097-2765(02)00634-2. [DOI] [PubMed] [Google Scholar]
- 17.Rodgers JT, Puigserver P. Fasting-dependent glucose and lipid metabolic response through hepatic sirtuin 1. Proceedings of the National Academy of Sciences of the United States of America. 2007;104:12861–12866. doi: 10.1073/pnas.0702509104. doi:10.1073/pnas.0702509104. [DOI] [PMC free article] [PubMed] [Google Scholar]
- 18.Hinds PW, Dowdy SF, Eaton EN, Arnold A, Weinberg RA. Function of a human cyclin gene as an oncogene. Proceedings of the National Academy of Sciences of the United States of America. 1994;91:709–713. doi: 10.1073/pnas.91.2.709. [DOI] [PMC free article] [PubMed] [Google Scholar]
- 19.Diehl JA, Zindy F, Sherr CJ. Inhibition of cyclin D1 phosphorylation on threonine-286 prevents its rapid degradation via the ubiquitin-proteasome pathway. Genes & development. 1997;11:957–972. doi: 10.1101/gad.11.8.957. [DOI] [PubMed] [Google Scholar]
- 20.Anders L, et al. A systematic screen for CDK4/6 substrates links FOXM1 phosphorylation to senescence suppression in cancer cells. Cancer cell. 2011;20:620–634. doi: 10.1016/j.ccr.2011.10.001. doi:10.1016/j.ccr.2011.10.001. [DOI] [PMC free article] [PubMed] [Google Scholar]
- 21.Abella A, et al. Cdk4 promotes adipogenesis through PPARgamma activation. Cell metabolism. 2005;2:239–249. doi: 10.1016/j.cmet.2005.09.003. doi:10.1016/j.cmet.2005.09.003. [DOI] [PubMed] [Google Scholar]
- 22.Diehl JA, Cheng M, Roussel MF, Sherr CJ. Glycogen synthase kinase-3beta regulates cyclin D1 proteolysis and subcellular localization. Genes & development. 1998;12:3499–3511. doi: 10.1101/gad.12.22.3499. [DOI] [PMC free article] [PubMed] [Google Scholar]
- 23.Choi YJ, et al. The requirement for cyclin D function in tumor maintenance. Cancer cell. 2012;22:438–451. doi: 10.1016/j.ccr.2012.09.015. doi:10.1016/j.ccr.2012.09.015. [DOI] [PMC free article] [PubMed] [Google Scholar]
- 24.Pinkert CA, Ornitz DM, Brinster RL, Palmiter RD. An albumin enhancer located 10 kb upstream functions along with its promoter to direct efficient, liver-specific expression in transgenic mice. Genes & development. 1987;1:268–276. doi: 10.1101/gad.1.3.268. [DOI] [PubMed] [Google Scholar]
- 25.Macotela Y, et al. Dietary leucine--an environmental modifier of insulin resistance acting on multiple levels of metabolism. PloS one. 2011;6:e21187. doi: 10.1371/journal.pone.0021187. doi:10.1371/journal.pone.0021187. [DOI] [PMC free article] [PubMed] [Google Scholar]
- 26.Wang Y, et al. Inositol-1,4,5-trisphosphate receptor regulates hepatic gluconeogenesis in fasting and diabetes. Nature. 2012;485:128–132. doi: 10.1038/nature10988. doi:10.1038/nature10988. [DOI] [PMC free article] [PubMed] [Google Scholar]
- 27.Zeggini E, et al. Replication of genome-wide association signals in UK samples reveals risk loci for type 2 diabetes. Science. 2007;316:1336–1341. doi: 10.1126/science.1142364. doi:10.1126/science.1142364. [DOI] [PMC free article] [PubMed] [Google Scholar]
- 28.Rane SG, et al. Loss of Cdk4 expression causes insulin-deficient diabetes and Cdk4 activation results in beta-islet cell hyperplasia. Nature genetics. 1999;22:44–52. doi: 10.1038/8751. doi:10.1038/8751. [DOI] [PubMed] [Google Scholar]
- 29.Blanchet E, et al. E2F transcription factor-1 regulates oxidative metabolism. Nature cell biology. 2011;13:1146–1152. doi: 10.1038/ncb2309. doi:10.1038/ncb2309. [DOI] [PMC free article] [PubMed] [Google Scholar]
- 30.Schwartz GK, et al. Phase I study of PD 0332991, a cyclin-dependent kinase inhibitor, administered in 3-week cycles (Schedule 2/1). British journal of cancer. 2011;104:1862–1868. doi: 10.1038/bjc.2011.177. doi:10.1038/bjc.2011.177. [DOI] [PMC free article] [PubMed] [Google Scholar]
- 31.Li D, et al. A modified method using TRIzol reagent and liquid nitrogen produces high-quality RNA from rat pancreas. Applied biochemistry and biotechnology. 2009;158:253–261. doi: 10.1007/s12010-008-8391-0. doi:10.1007/s12010-008-8391-0. [DOI] [PubMed] [Google Scholar]
- 32.Vazquez F, et al. PGC1alpha expression defines a subset of human melanoma tumors with increased mitochondrial capacity and resistance to oxidative stress. Cancer cell. 2013;23:287–301. doi: 10.1016/j.ccr.2012.11.020. doi:10.1016/j.ccr.2012.11.020. [DOI] [PMC free article] [PubMed] [Google Scholar]
- 33.Ogryzko VV, et al. Histone-like TAFs within the PCAF histone acetylase complex. Cell. 1998;94:35–44. doi: 10.1016/s0092-8674(00)81219-2. [DOI] [PubMed] [Google Scholar]
- 34.Rodgers JT, Haas W, Gygi SP, Puigserver P. Cdc2-like kinase 2 is an insulin-regulated suppressor of hepatic gluconeogenesis. Cell metabolism. 2010;11:23–34. doi: 10.1016/j.cmet.2009.11.006. doi:10.1016/j.cmet.2009.11.006. [DOI] [PMC free article] [PubMed] [Google Scholar]
- 35.Jurczak MJ, et al. Dissociation of inositol-requiring enzyme (IRE1alpha)-mediated c-Jun N-terminal kinase activation from hepatic insulin resistance in conditional X-box-binding protein-1 (XBP1) knock-out mice. The Journal of biological chemistry. 2012;287:2558–2567. doi: 10.1074/jbc.M111.316760. doi:10.1074/jbc.M111.316760. [DOI] [PMC free article] [PubMed] [Google Scholar]