

Abstract
Altered bone turnover is a key pathologic feature of chronic kidney disease-mineral and bone disorder (CKD-MBD). Expression of TGF-β1, a known regulator of bone turnover, is increased in bone biopsies from individuals with CKD. Similarly, TGF-β1 mRNA and downstream signaling is increased in bones from jck mice, a model of high-turnover renal osteodystropy. A neutralizing anti-TGF-β antibody (1D11) was used to explore TGF-βs role in renal osteodystrophy. 1D11 administration to jck significantly attenuated elevated serum osteocalcin and type I collagen C-telopeptides. Histomorphometric analysis indicated that 1D11 administration increased bone volume and suppressed the elevated bone turnover in a dose-dependent manner. These effects were associated with reductions in osteoblast and osteoclast surface areas. μCT confirmed the observed increase in trabecular bone volume and demonstrated improvements in trabecular architecture and increased cortical thickness. 1D11 administration was associated with significant reductions in expression of osteoblast marker genes (Runx2, alkaline phosphatase, osteocalcin) and the osteoclast marker gene, Trap5. Importantly, in this model, 1D11 did not improve kidney function or reduce serum PTH levels indicating that 1D11 effects on bone are independent of changes in renal or parathyroid function. 1D11 also significantly attenuated high turnover bone disease in the adenine-induced uremic rat model. Antibody administration was associated with a reduction in pSMAD2/SMAD2 in bone but not bone marrow as assessed by quantitative immunoblot analysis. Immunostaining revealed pSMAD staining in osteoblasts and osteocytes but not osteoclasts, suggesting 1D11 effects on osteoclasts may be indirect. Immunoblot and whole genome mRNA expression analysis confirmed our previous observation that repression of Wnt/β catenin expression in bone is correlated with increased osteoclast activity in jck mice and bone biopsies from CKD patients. Furthermore, our data suggests that elevated TGF-β may contribute to the pathogenesis of high turnover disease partially through inhibition of β-catenin signaling.
Keywords: Growth Factors, HORMONES and RECEPTORS, Wnt/Frz/LRP5, PARACRINE SIGNALING, Rodent, ANIMAL MODELS, Bone histomorphometry, QUANTITATION, Bone turnover markers, QUANTITATION
Introduction
Skeletal complications associated with renal failure have been well documented in individuals with chronic kidney disease (CKD) from stage 3 through dialysis. (1–5) Furthermore, evidence is accumulating to suggest that at least some individuals with stage 2 CKD also have poor bone health. (5–8) These findings are relevant given that poor bone health and cardiovascular disease appear inter-related and cardiovascular events are the major cause of mortality in CKD patients. (9–11) Importantly, agents that enhance bone quality also reduce cardiovascular disease. (12–15) In late stages of the disease, elevated PTH and serum phosphorus (Pi) can be mechanistically linked to bone and cardiovascular disease through well characterized mechanisms. (16) As anticipated, treatments that lower PTH and/or serum phosphorus provide positive benefits on bone and cardiovascular health. (3,17–22) Nonetheless, as elevations in PTH and Pi are rather late events in CKD progression, these pathologies may not be sufficient to explain the growing evidence for declining bone and cardiovascular health occurring prior to their elevation. An understanding of the pathologic mechanisms associated with these early skeletal and vascular changes may lead to the generation of transformative therapies.
Given the challenges of performing longitudinal studies based on clinical bone biopsies, we and others have begun to assess early bone changes in genetic rodent models that develop progressive CKD. (4,6,23) We recently described molecular and phenotypic bone changes throughout the development of renal osteodystrophy in the CKD model, jck mice. Jck mice develop polycystic kidney disease as a result of a mutation in NEK8, a protein responsible for trafficking of two cilia-associated proteins, polycystin 1 and 2. (24,25) Despite a clear role for cilia in normal bone remodeling (26,27), we have previously demonstrated that the underlying defect in jck mice is insufficient to directly influence bone health in the absence of reduced renal function.(6) Our data also showed that early repression of osteocyte Wnt/β-catenin signaling was associated with increased osteoclast activity which was independent of detectable PTH changes. Furthermore, we also demonstrated that osteocyte Wnt/β-catenin signaling is altered in bone biopsies from individuals with CKD, underscoring the relevance of this newly characterized model of renal osteodystrophy. Finally, we showed that biphasic changes in Wnt/β-catenin antagonist expression also occur both in jck mouse and clinical bone biopsies.(6) This evidence is supported by clinical epidemiologic studies demonstrating increased serum levels of sclerostin, an antagonist of the Wnt/β-catenin pathway in CKD and dialysis patients. (28,29)
The factors responsible for early changes in sclerostin and β-catenin signaling have not yet been identified but one viable candidate is TGF-β1, the most abundant bone cytokine. (30) Under physiological conditions, TGF-β1 is a major modulator of bone turnover that plays diverse roles throughout the remodeling cycle. It regulates bone remodeling by recruiting mesenchymal stem cells to bone remodeling sites, enhancing differentiation of bone marrow mesenchymal stem cells, enhancing osteoblast precursor proliferation, and inhibiting osteoblast differentiation. (31–36) Pharmacologic inhibition of TGF-beta receptor signaling in osteoblasts increases bone mass by reducing the rate of remodeling, providing additional evidence for TGFβ’s role in bone health. (37) Furthermore, TGFβ antagonism via a neutralizing antibody leads to significant enhancement of bone quality in normal mice. (38)
TGF-β1 protein is elevated in bone biopsies from individuals with end stage renal disease where it is thought to contribute to increased fibrosis associated with cortical bone porosity. (39,40) Given the important role of this factor in bone biology, it is conceivable that high bone levels of TGF-β in CKD may contribute to renal osteodystrophy (ROD). The availability of a neutralizing PAN – anti TGF-β antibody provided the means to directly explore the potential role of this cytokine in the development of renal osteodystrophy in both jck mice and adenine induced rat models of CKD. (6,25,41) Our data demonstrates that TGF-β signaling is significantly increased in osteoblasts and early osteocytes and 1D11 attenuates high-turnover disease, at least in part through specific effects on osteoblast lineage cells by promoting enhanced β-catenin signaling. These data support a role of TGF-β in the pathogenesis of high turnover renal osteodystrophy.
Methods
In vivo evaluation of 1D11 effects on bone
Wild-type (WT) (C57BL/6J) and jck mice were originally obtained from Jackson labs (Bar Harbor, Maine, USA). Eight to nine week old male NTac:SD rat were purchased from Taconic and Yecuris Corporation (Germantown, NY, USA). All animals for the studies were maintained in a virus- and parasite-free barrier facility with a 12-h light/dark cycle. All animal procedures were conducted in accordance with approved Institutional Animal Care and Use Committee (IACUC) protocols. Unless otherwise specified, both mice and rats were maintained on standard rodent chow diet (PicoLab Rodent Diet 20, LabDiet, St. Louis, MO, USA) containing 0.63% phosphate, 0.81% calcium with 2.2 IU/gram Vitamin D3.
At 5 wks of age, jck mice were switched to a casein-based diet containing 0.4% calcium and 1.0% phosphate (Diet # D08112306; Research Diets Inc., New Brunswick, NJ, USA) to induce hyperphosphatemia. To explore the role of TGF-β on the progression of renal osteodystrophy, the neutralizing anti-TGF-β antibody, 1D11 (Genzyme, a Sanofi Company) or vehicle was given to jck mice at 8–9 weeks of age via intraperitoneal injection 3 times per week at 0, 2 or 5 mg/kg. Because a potential mechanism of 1D11 was unknown at the initiation of these studies, we designed two studies that spanned the different mechanistic phases. As bone turnover in mouse is about 3 weeks, we designed studies that spanned one or two bone remodeling periods and chose 4 and 7 week treatment periods to evaluate 1D11 effects on bone histomorphometric parameters. Blood and tissues were collected after 4 or 7 weeks of treatment (n = 15 for the 4 week treatment study and n = 12 for the 7 week treatment study). In contrast to histomorphometric changes, primary effects on gene expression and signaling occur more rapidly. To evaluate 1D11’s influence on mechanisms associated with bone turnover we utilized bone samples from 12 week old mice given 4 injections at 5 mg/kg for a week. Bones were collected 7 days after the first injection for gene expression and immunoblot analysis, as described in the results and figure legends.
To induce uremia in rats, 10 week old male NTac:SD rats were fed standard rodent diet containing 0.6% adenine for 1 week, followed by a diet containing 0.3% adenine for 5 weeks, and then standard rodent diet without adenine for the remaining 4 weeks of the study. The evaluation of 1D11 effect’s in the rat adenine model included 3 groups (n = 8 per group): (1) normal control: rats on the standard diet; (2) adenine group: adenine + vehicle (PBS); (3) 1D11 group: adenine + 1D11. 1D11 or vehicle was administered to the adenine treated rats from the beginning of the study via intraperitoneal injection 3 times per week at 10 mg/kg for 10 weeks. Serum and tissue samples were collected after 10 weeks of treatment.
Blood and urine biochemistry
Whole blood was collected under isofluorane anesthesia via retro-orbital bleed, incubated for 20 minutes at room temperature, and then centrifuged at 4°C. Serum was aliquoted and frozen at −80°C for subsequent analysis. Serum phosphate (Pi), calcium (Ca), blood urea nitrogen (BUN) and creatinine (enzymatic method) were measured on an Integra 400 bioanalyzer (Roche Diagnostics, Indianapolis, IN, USA). Intact PTH (Immutopics, San Clemente, CA, USA), 1, 25-dihydroxyvitamin D (1,25(OH)2D3) (IDS, Fountain Hills, AZ, USA), serum osteocalcin (OCN) (Biomedical Technologies Inc, Stoughton, MA, USA), serum c-telopeptide of type I collagen (CTX) (IDS, Fountain Hills, AZ, USA), N-terminal propeptide of type I procollagen (P1NP) (IDS, Fountain Hills, AZ, USA); intact FGF23 (Kainos, Tokyo, Japan) ELISAs; Mouse/Rat SOST Immunoassay Quantikine ELISA (R&D systems) were performed according to manufacturer’s instructions.
Tissue harvest and histology
Tissues were harvested, fixed in 10% Neutral Buffered Formalin (NBF) for 24–48 hours, and then placed in 70% ethanol. Processed tissues were paraffin embedded and sectioned. Sections were dewaxed in xylene, rehydrated by ethanol gradient and stained in hematoxylin and eosin. For bone immunostaining, femurs were decalcified, processed and embedded in paraffin and sectioned. For dynamic bone histomorphometric analysis, mice were given intraperitoneal injections of Alizarin complexone (ACROS, Fair Lawn, NJ, USA) 7 days before sacrifice (40 mg/kg) and calcein (15 mg/kg) 2 days before sacrifice. Femurs were fixed in 40% alcohol, processed and embedded in methyl methacrylate. Each femur was sectioned in the ventral/dorsal plane. Two levels per block separated by 100 microns were selected for staining. Goldner’s Trichrome and von Kossa sections were analyzed for static measurements. Unstained serial sections were used for dynamic measurements using the Osteo II Bioquant system (BIOQUANT, Nashville, TN, USA). Nomenclature is in agreement with recommendations by Parfitt et al. (42)
Cortical bone resorption score were evaluated based on number and size of the resorption canals. The samples were evaluated blind by a certified veterinary pathologist. The scoring system was defined as follows: 0: No significant lesions; 1: a few scattered small resorption canals; 2: more frequent, small-medium sized resorption canals; 3: more prominent cortical resorption canals, beginning to coalesce; 4: numerous large coalescing cortical resorption canals, sometimes extending full thickness through the cortex.
Immunohistochemistry and TRAP staining of mouse bones
Five-micrometer paraffin de-waxed and rehydrated sections were used. TRAP staining was performed using standard protocol (Sigma-Aldrich). The number of TRAP positive osteoclasts in femurs was counted using the Osteo II Bioquant system. The region of interest (ROI) was defined by tracing an area from the growth plate to 500 microns below with exclusion of cortical bone. The number of TRAP positive osteoclasts was normalized to bone surface.
Immunostaining was also performed using a standard protocol. Briefly, the sections were incubated with Trypsin Retrieval Solution (BioGenex, Fremont, CA, USA) at 37°C for 20 min followed by PBS washes. The sections were then treated with 0.3% H2O2 in methanol for 30 minutes and blocked with 2.5% normal horse serum. Slides were incubated overnight at 4°C in blocking buffer containing the primary antibody, goat anti-pSMAD2/3 (1:100) (Santa Cruz Biotechnology Inc., USA). After washing in PBST, the slides were incubated in ImmPRESS Reagent anti-goat IgG (Vector Laboratories, Burlingame, CA, USA), washed in PBST, developed with diaminobenzidine substrate (Vector Laboratories, Burlingame, CA, USA), and counterstained with Mayer’s hematoxylin. The slides were then washed in tap water for 5 minutes, dehydrated, cleared, and mounted with Cytoseal XYL (Thermo, Rockford, IL. USA). Images were visualized on a Zeiss Axiovert 200.
TUNEL staining
Osteocyte apoptosis was detected by TdT-mediated dUTP nick-end labeling (TUNEL) using a modified version of a commercial kit (Calbiochem, Gibbstown, NJ) in longitudinal sections of the femor counterstained with 2% methyl green, as previously described. (43,44) Osteocyte apoptosis and empty lacunae were separately assessed in the cancellous and cortical bone of the distal metaphysis. The metaphysis was defined as the area starting 0.5 mm from the most proximal part of the growth plate and extending 0.5 mm towards the diaphysis.
Micro-computed tomography (μCT) analysis of bone
Tibias were imaged by μCT using isotopic voxels at a resolution of 3.5 microns (AG Micro-CT 35, Scanco Medical, Brüttisellen, Switzerland). Fifty slices of mid-diaphyseal cortical bone (175 microns total thickness) were analyzed with a threshold of 565 mg/cc. The following variables were calculated using Scanco software routines and compared between groups: bone volume fraction (BV/TV), apparent density (density of cortical bone including resorption spaces and voids) (data not shown) and material density (BMD) (threshold set for cortical bone density only). The nomenclature, symbols, and units used correspond to those described by Bouxsein et al.(45)
Strength testing
Tibias were tested by 3-point bending, and the strength parameter (maximum load at failure) was assessed with a Test Resources (Shakopee, MN, USA) DDL200 axial loading machine outfitted with an Interface SMT1-22 force transducer. Cross-head displacement rate was 0.1 mm/sec. Tests were conducted on the mid-diaphyses with the bones resting on two supports 5mm apart and the tibial anterior margins facing upward toward the actuator.
Colony formation unit (CFU) assay and osteoclastogenesis in vitro
Bone marrow was collected from 12 week old female WT or jck animals treated with PBS or 1D11 at 2 or 5 mg/kg, 3 times a week for 2 weeks and cultured in αMEM containing 15% heat inactivated fetal bovine serum (HI-FBS), and penicillin-streptomycin (Invitrogen, Carlsbad, CA, USA). Media was replaced 3 days post adherence and refreshed 7 days thereafter. After 13 days, adherent cells were plated at 5000 cells/cm2 in triplicate in six well plates and cultured in differentiation media, αMEM, 50 μg/ml ascorbic acid, 10% HI-FBS, penicillin-streptomycin. Media was replaced every 4 days. At day 8, cells were fixed and stained for alkaline phosphatase activity with 10 mg naphthol AS-MX, 20 mg Fast Blue BB salt, 1 ml N,N-dimethylformaide, in 19 ml of 0.1 M Tris (pH 9.2) (all from Sigma, St. Louis, MO, USA) to detect CFU-osteoblast (CFU-OB). Colonies greater than 1 mm in diameter were counted. CFU-fibroblasts (CFU-F) were detected by staining the same plates with 0.2% crystal violet in 2% ethanol for 1 hour. Plates were washed with water and then air-dried. All colonies greater than 1 mm in diameter were counted to yield the percentage of CFU-OB/CFU-F. To induce differentiation of HSCs to osteoclasts, bone marrow cells were cultured in αMEM containing 10% HI-FBS, 5 ng/ml macrophage colony-stimulating factor (M-CSF) (Sigma, St. Louis, MO, USA) and penicillin-streptomycin (Invitrogen, Carlsbad, CA, USA). 48 hours later, the non-adherent cells were collected, counted and plated in 96-well plates at a density of 1.5×10⁵ cells/well in αMEM containing 10% HI-FBS, 60 ng/ml M-CSF, 50 ng/ml Receptor activator of nuclear factor kappa-B ligand (RANKL) and penicillin-streptomycin for 9 days. Cells were then stained for TRAP staining kit (Sigma, St. Louis, MO, USA). TRAP positive cells with 3 or more nuclei were considered osteoclasts and counted.
Gene expression analysis
Bone shafts were collected, epiphysis removed, bone marrow displaced via centrifugation, and the shafts placed in Trizol (Sigma, St. Louis, MO, USA). RNA was extracted using the Trizol, chloroform and isopropanol precipitation method. The extracted RNA was treated with DNase, purified on a Qiagen (Valencia, CA, USA) column and eluted in RNAse free water. A reverse transcriptase reaction was performed. The generated cDNA was used in single Taqman assays or customized Taqman low density arrays (TLDA) (Applied Biosystems, Carlsbad, CA, USA) containing genes of interest.
For whole genome mRNA expression analysis, 7 and 11 week jck mice received injections of PBS or 1D11 (5 mg/kg) at days 1, 3, 5 and 7. Long bones were collected from these animals at day 8 (8 or 12 weeks old) and age-matched WT mice to serve as controls. Six animals were used in each group. Total RNA was isolated from bone shafts using TRizol (Invitrogen). RNA sequencing libraries were constructed using Illumina (San Diego, CA) mRNA sequencing kits by BGI America. Libraries were subsequently sequenced on Illumina Hiseq2000 sequencer by BGI to a depth of 30 million total reads (paired end & 90 bps read length). Fastq files containing clean sequence reads (PCR primer & adapter sequences removed) were then loaded into ArrayStudio (OmicSoft, NC) for QC and analysis. Low quality reads were removed and then aligned against mouse genome B37 and gene model Ensembl R65. Total read counts were summarized using the gene model and RPKM (reads per kilobase per million reads) values were generated for each gene. Differential gene expression fold differences and p values were then generated by ANOVA analysis. Significantly expressed gene list (fold cut off 1.2 and p value < 0.05) were then loaded into IPA (Ingenuity, CA) pathway analysis software for downstream functional analysis.
Immunoblot analysis
Bone marrow and bone shafts from tibia and femur were frozen in liquid nitrogen, pulverized and protein was extracted with 50 mM Tris buffer (pH 7.4), containing 0.1 M sodium chloride and 0.1% Triton X-100. Bone marrow or bone extracts were denatured at 70°C for 10 minutes and then separated by electrophoresis on 8% Bis-Tris gels (Invitrogen). Separated proteins were electrotransferred to nitrocellulose (NC) membranes followed by incubation in blocking buffer (5% nonfat dry milk in Tris buffered saline, pH 7.4, and 0.3% Tween 20). Membranes were then incubated overnight at 4°C in blocking buffer containing one of the following primary antibodies: rabbit polyclonal antiserum pSMAD2 (Cell Signaling Technology, Inc.) (1:500), rabbit polyclonal anti-β-catenin (phospho S37) antibody (Abcam) (1:500) or mouse monoclonal primary antiserum SMAD2 (1:1000) was incubated with membrane overnight at 4 °C in blocking buffer. The membrane was washed 5 times with TBS contained 0.1% Tween 20 (TBST) for 10 minutes each wash. For detection of pSMAD2 or p-β-catenin, the secondary antibody incubation was performed for 60 minutes at room temperature using anti-rabbit IgG conjugated to horseradish peroxidase (Cell Signaling Technology, Inc.) at dilution of 1:5000. The secondary anti-mouse IgG conjugated to horseradish peroxidase (Cell Signaling Technology, Inc.) at dilution of 1:5000 was used as secondary antibody for SMAD2 detection. After final washing, the immunoreactive bands were detected using an enhanced chemiluminescence reagent (SuperSignal West Dura, Thermo Scientific), read on film, and quantitated using Image J software. Antiserum to β-Actin (Abcam) was incubated room temperature for 1 hour at 1:50,000 dilution, washed, and quantified as well and used as a loading control.
Statistical analysis
All values are reported as the mean ± standard error of the mean (SEM) and were analyzed by one-way ANOVA or t-test using GraphPad Prism version 5.00 for Windows (GraphPad Software, San Diego California USA).
Results
TGF-β1 expression and signaling are increased in bone of jck mice, a high turnover model of CKD-MBD
The jck mouse is a genetic model of polycystic kidney disease (PKD) that has a progressive decline in renal function. (25) We have recently demonstrated that these mice also exhibit prominent features of CKD-MBD including altered serum chemistries, high-turnover ROD and cardiovascular disease. (6) In addition to the previously reported increases in BUN and serum PTH, an increased number of surface TRAP positive osteoclasts was observed in femur sections that is consistent with high bone turnover (Fig. 1).
Fig. 1.

Jck mice develop high-turnover bone disease during progression of chronic kidney disease. (A) Serum BUN levels, a marker of kidney function are elevated progressively in jck mice whereas no change is observed in WT mice. (B) Serum PTH levels are significantly elevated at 12 weeks and further increased at week 16. (C) Number of osteoclasts is significantly increased in jck mice. (D) Representative TRAP staining shows significant increases in N. OC/BS (%) at 16 weeks of age. (10 X objective lens). Results are expressed as mean ± SEM. * indicates p < 0.05 compared with age-matched WT mice by t-test (n ≥ 10)
As a first step in exploring whether TGF-β contributes to the pathogenesis of high-turnover ROD, we first measured mRNA expression of the major isoform, TGF-β1 and its receptor, TGFβR1 in bone. TGF-β1 mRNA expression was significantly increased by about 1.7 fold in jck by 9 weeks of age (data not shown) and sustained throughout disease progression (Fig. 2A). TGFβR1 mRNA expression was also elevated in bones of jck compared with WT mice at both 12 and 16 weeks of age (Fig. 2A). However neither the cytokine nor its receptor was significantly elevated in bone marrow (Fig. 2B). Immunoblot analysis confirmed that increased expression of TGF-β1 and TGFβR1 was associated with activation of SMAD signaling based on increased expression of pSMAD2 and total SMAD2 protein in bone but not bone marrow (Fig. 2C). The ratio of pSMAD2 and SMAD proteins (pSMAD/SMAD) measured by quantitative immunoblot analysis was also increased in bone but not bone marrow (Fig. 2C). To further identify the specific cell types within bone that respond to TGF-β1, pSMAD2/3 immunostaining was performed on decalcified bone sections. pSMAD2/3 staining appeared more intense in osteoblasts and early osteocytes in jck bone. In addition, osteoblasts in jck were more cuboidal relative to those observed in WT-derived bones (Fig. 2D). Importantly, pSMAD2/3 expression did not co-localize with TRAP positive osteoclasts (Fig. 2E).
Fig. 2.

TGF-β1 and TGF-β signaling in bone and bone marrow of jck mice. Quantitative RT-PCR measurement shows (A) TGF-β1 and TGFβR1 gene expression are increased in bones of jck compared with WT mice by 12 weeks of ages (n = 6). (B) TGF-β1 and TGFβR1 gene expression are not altered in bone marrow of jck mice (n = 6). (C) Western blot analysis and quantitative measurement of the fold changes shows pSMAD2, a downstream signal of TGF-β action is increased in bone but not in bone marrow of jck mice at 12 weeks of age (n = 3). Values in Fig A, B and C are expressed as mean ± SEM. * indicates p < 0.05 compared with age-matched WT mice by t-test. (D) Immunostaining with anti-pSMAD2/3 on decalcified femur sections shows that pSMAD2/3 is increased in osteoblasts and early osteocytes in jck mice (black arrow) (n = 6 in WT group and n = 8 in jck group). (E) Immunostaining and TRAP staining on serial femur sections shows pSMAD2/3 are expressed in osteoblasts (TRAP negative, wide arrows) but not expressed in osteoclasts ( n = 6 in WT group and n = 8 in jck group).
The neutralizing anti-TGF-β antibody (1D11) attenuated the increased bone turnover in jck mice
1D11, a neutralizing anti-TGF-β antibody was administered to jck mice starting at 8 weeks of age for 4 or 7 weeks (Fig. 3). We have previously shown that 8 wk old jck mice have evidence of early stages of high turnover disease. (6) To determine the effect of anti-TGF-β antibody on turnover, serum biomarkers were measured. 1D11 (5mg/kg) resulted in a trend toward reduced OCN but not CTX at 4 weeks and significantly attenuated the elevation of both serum bone turnover markers after 7 weeks of treatment (Fig. 4A, B). A significant suppression of CTX and a trend toward suppression of serum OCN after 7 weeks of treatment were observed at 2 mg/kg. Consistent with its effects on serum OCN, 1D11 at 5 mg/kg also attenuated the elevation of serum P1NP levels in the 7-week treatment study (Table 1). 1D11 had no effect on either serum BUN or PTH levels indicating that 1D11 did not significantly affect kidney function or PTH production/secretion in this study (Fig. 4C, D). Similarly, 1D11 did not influence the known alterations in serum Pi, Ca, 1,25(OH)2D3 or FGF23 levels (Table 1).
Fig. 3.
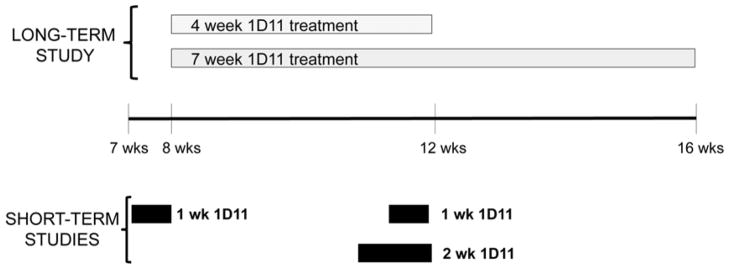
Study designs to assess 1D11 long-term effect and short-term effect on bone in jck mice.
To evaluate the long term effect of 1D11 on bone, 1D11 or vehicle was given to jck mice at 8 weeks of age via intraperitoneal injection 3 times per week at 2 or 5 mg/kg. Blood and tissues were harvested after 4 or 7 weeks of treatment. To examine the effect of 1D11 on osteoblast or osteoclast precursors in bone marrow jck mice were treated with PBS or 1D11 for 2 weeks, and bone marrow was harvested for MSC and HSC culture. To examine the effect of 1D11 on gene expression, 7 or 11 week old jck mice were injected IP with PBS or 1D11 at 5mg/kg on day 1, 3, 5 and 7, and sacrificed on day 8. Bone shafts of tibias and femurs were harvested for RNA or protein expression analysis.
Fig. 4.

1D11 significantly suppresses bone turnover markers in jck mice. (A) Serum osteocalcin (OCN) and (B) C-terminal cross-linking telopeptide of type I collagen (CTX) levels were suppressed significantly in jck mice after 7 weeks of treatment. (C) Serum BUN, and (D) PTH levels were not affected by 1D11 treatment. Results are expressed as mean ± SEM. * indicates p < 0.05 compared with age-matched jck mice treated with PBS by one-way ANOVA and Tukey’s multiple comparison test (n ≥ 12 in the 4 week treatment groups; n ≥ 8 in the 7 week treatment groups).
Table 1.
Serum biochemistry values of jck mice after 4 and 7 weeks of treatment
| 4 week treatment | 7 week treatment | |||||
|---|---|---|---|---|---|---|
|
|
||||||
| PBS | 1D11 (2 mg/kg) | 1D11 (5 mg/kg) | PBS | 1D11 (2 mg/kg) | 1D11 (5 mg/kg) | |
| BUN (mg/dl) | 53 ± 2 | 55 ± 3 | 62 ± 4 | 77 ± 3 | 72 ± 7 | 93 ± 8 |
| Creatinine (mg/dl) | 0.26 ± 0.02 | 0.27 ± 0.02 | 0.24 ± 0.01 | 0.27 ± 0.07 | 0.26 ± 0.05 | 0.29 ± 0.02 |
| Phosphate (mg/dl) | 11.1 ± 0.6 | 10.1 ± 0.6 | 8.8 ± 0.4* | 11.2 ± 0.7 | 9.8 ± 0.7 | 11.1 ± 0.9 |
| Calcium (mg/dl) | 8.7 ± 0.2 | 8.6 ± 0.2 | 8.9 ± 0.2 | 7.1 ± 0.2 | 7.6 ± 0.1 | 6.8 ± 0.2 |
| FGF23 (pg/ml) | 27967 ± 7442 | 39979 ± 11067 | 15706 ± 2777 | 8818 ± 2413 | 9369 ± 2705 | 9813 ± 2104 |
| PTH (pg/ml) | 935 ± 132 | 968 ± 143 | 707 ± 119 | 2190 ± 335 | 1828 ± 240 | 1745 ± 334 |
| 1,25-(OH)2D (pg/ml) | 239 ± 13 | 242 ± 12 | 233 ± 14 | 365 ± 38 | 448 ± 37 | 351 ± 37 |
| Osteocalcin (ng/ml) | 115 ± 9 | 72 ± 6* | 94 ± 10 | 79 ± 10 | 60 ± 8* | 41 ± 3* |
| CTX (ng/ml) | 27 ± 2 | 27 ± 2 | 28 ± 2 | 37 ± 4 | 27 ± 1 | 23 ± 2* |
| P1NP (ng/ml) | ND | ND | ND | 30 ± 6 | 23 ± 4 | 11 ± 2* |
Data are shown as mean ± SEM.
indicates p < 0.05 versus PBS treated age-matched jck mice by one-way ANOVA and Tukey’s multiple comparison test (n ≥ 12 in the 4 week treatment groups; n ≥ 8 in the 7 week treatment groups).
ND, not determined.
Dynamic and static bone histomorphometric analysis was performed on non-decalcified femur sections and reported using the TMV (turnover, mineralization and bone volume) classification recommended by KDIGO (Fig. 5A–C) along with the full analysis (Table 2) (1). Consistent with the observed changes in serum bone turnover biomarkers, 1D11 dose-dependently suppressed bone turnover measured by bone formation rates at 12 weeks of age after 7 weeks of treatment (Fig. 5A). Despite suppression of bone turnover, bone volume was significantly increased without impacting bone mineralization lag time in each treatment group (2 and 5 mg/kg) (Fig. 5B, C; Table 2). Evaluation of the decalcified bone sections with H&E and TRAP staining, showed a trend toward improvement in cortical bone resorption in jck mice by 1D11 treatment (5 mg/kg) (Fig. 5D, E).
Fig. 5.
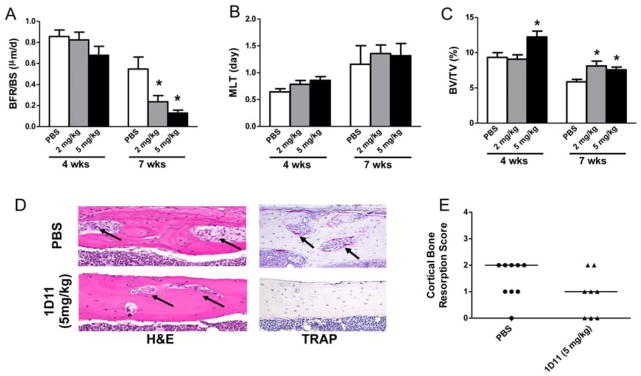
Effect of 1D11 on TMV classification (turnover, mineralization and volume) and cortical bone resorption. 8 week old jck mice were treated with 1D11 as described in the “Methods” and Fig 3. (A) 1D11 dose-dependently suppresses bone formation rate (BFR/BS) after 7 weeks of treatment. (B) 1D11 has no impact on bone mineralization measured by mineralization lag time (MLT). (C) 1D11 increases BV/TV (%) after 4 weeks at 5 mg/kg dose and after 7 week treatment at both 2 and 5 mg/kg doses. Results are expressed as mean ± SEM. * indicates p < 0.05 compared with age-matched jck mice treated with PBS by one-way ANOVA and Tukey’s multiple comparison test (n ≥ 12 in the 4 week treatment groups; n ≥ 8 in the 7 week treatment groups). (D) Representative H&E and TRAP stained sections from femurs showing 1D11 reduces cortical bone resorption (porosity, black arrow). (E) semi-quantitative scores of cortical bone resorption shows a trend toward decreased cortical porosity.
Table 2.
Bone histomorphometric analysis of jck bones
| 4 week treatment
|
7 week treatment
|
|||||
|---|---|---|---|---|---|---|
| PBS | 1D11 (2mg/kg) | 1D11 (5mg/kg) | PBS | 1D11 (2mg/kg) | 1D11 (5mg/kg) | |
| TV/BV (%) | 9.3±0.7 | 9.1±0.6 | 12.2±0.8* | 5.9±0.4 | 8.1±0.6* | 7.6±0.4* |
| Tb.Th. (mm) | 0.065±0.002 | 0.065±0.002 | 0.072±0.002* | 0.058±0.003 | 0.068±0.004 | 0.065±0.004 |
| Tb.N.(1/mm2) | 5.2±0.1 | 5.3±0.1 | 5.5±0.1 | 4.9±0.1 | 5.1±0.1 | 5.2±0.1 |
| Tb.Sp (mm) | 0.13±0.003 | 0.13±0.003 | 0.11±0.003 | 0.15±0.004 | 0.13±0.004 | 0.13±0.004 |
| MS/BS (%) | 0.24±0.19 | 0.23±0.04 | 0.20±0.02 | 0.25±0.04 | 0.18±0.02 | 0.14±0.27 |
| MAR (mm/day) | 3.18±0.17 | 2.70±0.24 | 2.56±0.25 | 1.65±0.28 | 1.16±0.17 | 0.90±0.05 |
| BFR/BS (mm3/mm2/yr) | 0.77±0.08 | 0.76±0.08 | 0.54±0.08 | 0.55±0.11 | 0.24±0.06 | 0.13±0.29 |
| MLT (day) | 1.16±0.35 | 1.36 ± 0.16 | 1.32 ± 0.23 | 0.64±0.06 | 0.79±0.07 | 0.86±0.07 |
| OV/BV (%) | 0.017±0.004 | 0.012±0.003 | 0.010±0.003 | 0.66 ± 0.38 | 0.58±0.38 | 0.001±0.00 |
| N. Ob./BS (%) | 18.8±2.2 | 14.4±1.7 | 10.5±1.8* | 19.6±3.6 | 18.8±2.8 | 10.2±2.0* |
| N.Oc./BS(%) | 1.9±0.15 | 1.3±0.16* | 1.1±0.17* | 5.5±0.61 | 4.0±0.79 | 2.4±0.45* |
Data are shown as mean ± SEM from histomorphometric analysis.
indicates p < 0.05 versus PBS treated age-matched jck mice by one-way ANOVA and Tukey’s multiple comparison test (n ≥ 12 in the 4 week treatment groups; n ≥ 7 in the 7 week treatment groups).
BV/TV, bone volume/tissue volume; Tb.Th, trabecular thickness; Tb.N, trabecular number; Tb.Sp, trabecular separation; MS/BS, mineralizing surface/bone surface; MAR, mineral apposition rate; BFR/BS, bone formation rate/bone surface; MLT, mineralization lag time; OV/BV osteoid volume/bone volume; N.Ob./BS, number of osteoblasts/bone surface; N.Oc./BS, number of osteoclasts/bone surface;
In agreement with findings from histomorphometric analysis, μCT analysis on femurs after 4 weeks of treatment (5 mg/kg 1D11) also demonstrated increased fractional bone volume (BV/TV) and trabecular number (Tb.N), with a corresponding decrease in trabecular separation (Tb.Sp) (Fig. 6). 1D11 administration was also associated with increased bone mineral density (both apparent and material density) and cortical thickness (Fig. 6). Finally, 1D11 administration was associated with an increased trend in bone strength as determined by 3-point bending test. The yield strengths were measured at 14.4 ± 1.1 N and 15.2 ± 0.7 N in jck treated with PBS and 1D11 (5 mg/kg), respectively.
Fig. 6.

MicroCT measurement shows improvement of bone quality in both trabecular and cortical bone after 4 week treatment with 1D11. 1D11 treatment at 5 mg/kg significantly increases BV/TV, Tb. N. but not Tb.Th. 1D11 treatment suppresses Tb.Sp. and increases apparent density and material density. 1D11 also increases Ct.Th. Data are shown as mean ± SEM. * indicates p < 0.05 versus PBS treated jck mice by one-way ANOVA and Tukey’s multiple comparison test (n = 14). BV/TV, bone volume/tissue volume; Tb.Th, trabecular thickness; Tb.N, trabecular number; Tb.Sp, trabecular separation; Ct.Th, cortical thickness.
1D11 suppresses osteoblast and osteoclast function in jck mice
We have previously demonstrated that in addition to increased bone formation rates, jck bones have increased osteoblast and osteoclast numbers. 1D11 suppressed both osteoblast and osteoclast numbers on trabecular bone surfaces at 5 mg/kg after 4 and 7 weeks of treatment (Fig. 7A). Gene expression analysis by RT-PCR (7-week treatment) confirmed that 1D11 administration was associated with significant reductions in mRNA for markers of osteoblast differentiation including osteocalcin (Bglap), osterix (Sp7), runx2, and alkaline phosphatase (Alpl) and the osteoclast marker, Trap5 (Fig. 7B). Additionally, trends toward reduced expression of the osteoclast genes, cathepsin K (Ctsk) and Tnfrsf11a (Rank) were also observed.
Fig. 7.

1D11 treatment suppresses both osteoblast and osteoclast numbers. (A) Bone histomorphometric analysis shows 1D11 significantly suppresses Ob.N and Oc.N on bone surface (n ≥ 7). (B) Quantitative RT-PCR measurement shows suppressed mRNA expression of osteoblast and osteoclast markers in bone from jck mice treated with 1D11 vs. untreated mice ( n = 6). Bglap, bone gamma-carboxyglutamate protein (osteocalcin); Sp7, transcription factor 7 (oserix); Runx2, runt related transcription factor 2; Alpl, alkaline phosphatase; Ctsk, cathepsin K; Rank, receptor activator of NF-KB; Trap5, tartrate-resistant acid phosphatase type 5. (C) Co-staining of TRAP and anti-osterix antibody staining on sections from decalcified femur shows decreased TRAP positive osteoclasts (pink) and osterix positive osteoblast precursors (brown) in femur from mice treated with 1D11 vs. untreated for 7 weeks. Data are shown as mean ± SEM. * indicates p < 0.05 versus PBS treated jck mice by one-way ANOVA and Tukey’s multiple comparison (A) or t-test (B).
Normal coupling between osteoclast and osteoblast activities at the sites of remodeling was demonstrated by co-localization of TRAP staining with immunostaining for the osteoblast marker, osterix (Fig. 7C). Both TRAP and anti-osterix staining were significantly suppressed by 1D11, further demonstrating that inhibition of TGF-β reduced both osteoblastogenesis and osteoclastogenesis (Fig. 7C). These data indicated that 1D11 inhibited bone turnover without significantly disrupting the coupling between bone resorption and formation.
1D11 attenuates high turnover bone disease in rat adenine induced-CKD model
To confirm that the role of TGF-β in jck mice represents a general phenomenon in ROD and is not specific to the jck mouse model, we evaluated 1D11’s influence on bone in a moderate rat adenine-induced CKD model in which animals were fed diets that had declining doses of adenine as described in the Methods section. Adenine treatment resulted in renal damage as demonstrated by increased serum BUN levels. Importantly, similar to our findings in the jck mouse model, 1D11 treatment had no significant effect on renal function (Fig. 8A). Consistent with observations in jck mice, serum bone turnover markers, OCN and CTX, were significantly elevated in the adenine treated group and were both significantly attenuated by 1D11 treatment (Fig. 8B, C). Bone histomorphometric analysis confirmed an increase in both osteoblast and osteoclast surface areas consistent with increased bone turnover that were attenuated with 1D11 treatment (Fig. 8E, F). Similar to findings in jck mice, 1D11 treatment was also associated with a strong trend toward improved bone volume (p=0.06) (Fig. 8D).
Fig. 8.
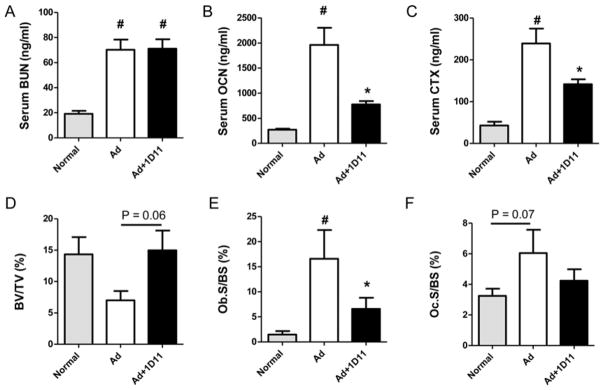
Bone turnover is increased in an adenine (Ad)-induced rat CKD model and 1D11 attenuates the elevation in bone turnover. Standard rodent diet mixed with 0.3 and 0.6% adenine was used to induce kidney damage in rat and evaluate 1D11’s effect on bone as described in the “Methods”. (A) Adenine induces kidney function damage as measured by increased serum BUN levels; 1D11 has no effect on serum BUN levels. (B, C). Serum bone turnover makers, OCN and CTX are significantly elevated in rats treated with adenine. 1D11 attenuates the elevation of serum OCN and CTX. (D–F). Bone histomorphometric analysis shows a trend toward decreased fractional bone volume (BV/TV) and increased osteoblast surface (Ob. S/BS) and osteoclast surface (Oc. S/BS) in adenine induced CKD. 1D11 treatment significantly attenuates the increase in Ob.S/BS and is associated with a trend toward increased BV/TV (p =0.06) and decreased Oc.S/BS (p = 0.07). Data are shown as mean ± SEM. # indicates p < 0.05 compared with normal controls and * indicates p < 0.05 compared with PBS-treated adenine induced CKD rats (Ad) by one-way ANOVA and Tukey’s multiple comparison test (n = 8 per group).
1D11 reduces SMAD2 signaling in bone
To explore the mechanism by which 1D11 influences osteoblast and osteoclast number and/or function, we first examined 1D11 induced early changes in the canonical TGF-β signaling pathway, SMAD2/3. Eleven week old jck mice received 4 doses of 1D11 (5 mg/kg) prior to sacrifice over a course of one week (Fig. 3). Quantitative immunoblot analysis of protein extracted from the mid-shaft of both tibia and femur confirmed the initial observation that the pSMAD2/SMAD2 ratio was increased in jck mice and demonstrated that a one week treatment with 1D11 significantly attenuated the increase (Fig. 9A.B).
Fig. 9.
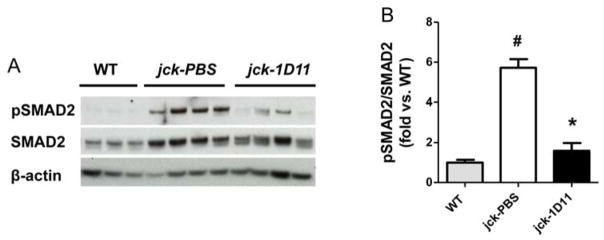
1D11 suppresses SMAD2 phosphorylation in jck bone. Eleven week old jck mice received 4 doses of 1D11 (5 mg/kg) prior to sacrifice (see details in Methods and Fig. 3). (A) Immunobloting of protein extracted from mid-shaft of femurs of WT and jck mice shows pSMAD2 expression is significantly increased in jck bone and is attenuated by 1D11 treatment. (B) Quantitative measurement of the fold changes of pSMAD2/SMAD2 of immunobloting in panel (A) indicates that there is a significant increase in the pSMAD2/SMAD2 ratio in jck mice relative to WT that was significantly suppressed by 1D11 treatment. Data are shown as mean ± SEM. # indicates p < 0.05 compared with WT mice and * indicates p < 0.05 compared with PBS-treated jck mice by one-way ANOVA and Tukey’s multiple comparison test. Data from WT and jck mice were from the same experiment as described in Fig 2 C.
As described above, changes in pSMAD2/SMAD2 were not observed via immunoblot of whole bone marrow. To explore the possibility that 1D11 may influence the subset of osteoprogenitor cells, we assessed the influence of antibody treatment on the differentiation potential of bone marrow mesenchymal (MSC) and hematopoetic stem cells (HSC). 1D11 (5 mg/kg) was administered to jck starting at 10 weeks of age (Fig 3). After 2 weeks of treatment (12 weeks of age), bone marrow was collected from age matched WT, treated and untreated jck and cultured under conditions that favored either MSC differentiation to osteoblasts or HSC differentiation to osteoclasts. CFU-OB/CFU-F ratio was significantly increased from jck mice compared to WT mice. 1D11 at 5 mg/kg significantly suppressed the CFU-OB/CFU-F ratio in jck mice (Fig. 10 A), whereas, the number of osteoclast progenitors was similar between WT and jck mice. 1D11 treatment had no influence on the osteoclastic differentiation potential (Fig. 10B).
Fig. 10.

Effects of 1D11 on proliferation and differentiation of osteoblast precursors and osteoclastogenesis in bone marrow, apoptosis of osteocytes, and p-β-catenin in bone of jck mice. Jck mice at 10 weeks of age were treated with PBS, 2 or 5 mg/kg 1D11 for two weeks. (A) Bone marrow cells were isolated and cultured in the condition favoring osteoblast differentiation (n = 5). CFU-OB/CFU-F ratios are significantly elevated in MSC from jck mice treated with PBS vs WT mice and 1D11 at 5 mg/kg significantly attenuated the elevation of CFU-OB/CFU-F in jck mice. (B) Bone marrow cells were cultured in media favoring differentiation to osteoclastogenesis (n = 5). Number of TRAP+ osteoclasts in jck mice are not different from WT mice and 1D11 treatment has no effect on osteoclastogenesis. (C) Apoptosis of osteocytes from WT mice and jck mice treated with PBS or 1D11 (5 mg/kg) for 4 weeks were measured by TUNEL staining (n= 7 in WT group and 10 in jck group). The percentage of apoptotic osteocytes was significantly decreased in both cortical and trabecular bone of jck compared to age-matched WT mice. 1D11 (5 mg/kg) treatment had no significant effect on the number of apoptotic osteocytes in jck mice. (D) 1D11 suppressed the increased p-β-catenin in bone. Eleven week old jck mice received 4 doses of 1D11 (5 mg/kg) prior to sacrifice (see details in Methods and Fig. 3). Immunoblotting of protein extracted from mid-shaft of femurs of WT and jck mice shows p-β-catenin expression is significantly increased in jck bone and attenuated by 1D11 treatment (n = 4). Data are shown as mean ± SEM. # indicates p < 0.05 compared with WT mice and * indicates p < 0.05 compared with jck mice treated with PBS by one-way ANOVA and Tukey’s multiple comparison test.
We also determined whether the higher number of osteoclasts observed in bones of jck mice were a consequence of increased osteoclast recruitment by apoptotic osteocytes, and if so whether 1D11 could attenuate these changes (Fig. 10 C). However, our data did not support this hypothesis as the number of TUNEL positive osteocytes was significantly decreased in jck compared to age-matched WT mice. Furthermore, no differences were observed between 1D11 treated versus untreated jck mice.
1D11 treatment restores β-catenin pathway changes
We have previously shown that an underlying decrease in β-catenin signaling is associated with ROD in jck bones and human bone biopsies. (6). Immunoblot analysis confirmed the increased expression of the inactive form of β-catenin (p-β-catenin) in protein isolated from jck femurs in comparison to WT bones at 12 weeks of age. Importantly, one week of 1D11 administration was associated with a decrease in p-β-catenin protein to a level similar to that observed in WT mice (Fig. 3 and 10 D). Modulation of Wnt/β-catenin pathway components and downstream gene expression changes were further explored using whole genome RNA sequence analysis on bone samples from the 1-week study at 12 weeks of age (Fig. 3). As shown in Table 3, expression of genes whose products are within or downstream of the canonical Wnt/β-catenin pathway are consistent with an overall repression of this pathway in jck mice relative to WT mice. Genes that were significantly down-regulated included ligands (Wnt16, Wnt10B and Wnt5B) and receptors/co-receptors (Frzb and Lrp5) of this pathway. β-catenin (Ctnnb1), the most important downstream component of the Wnt pathway was also significantly suppressed. Within those genes that were up-regulated in expression, sFrp1, sFrp4 and Dkkl1 are all negative regulators of Wnt signaling. In addition, consistent with previously described gene expression data from RT-PCR, Tgf-β1 and Tgfbr1 were significantly elevated. Furthermore, after one week of 1D11 administration, many genes within the Wnt/β-catenin pathway were regulated toward normal levels (Table 4). Among the genes up-regulated by 1D11, the most important gene in the Wnt pathway, β-catenin (Ctnnb1) was completely normalized. In addition, Wnt receptors (Fzd5 and Smo), downstream elements (Dvl1 and Dvl3) and the positive regulator (Appl2) were up-regulated after 1 week of 1D11 treatment. β-casein kinase 2 was the only down-regulated gene in the pathway, which was up-regulated in jck and completely normalized by 1D11. Importantly, β-catenin target genes such as Pkd1 were normalized by 1D11.
Table 3.
Genes with significant expression change in jck bone compared with WT bones (≥ 1.3 fold and p < 0.05, n = 6) at 12 weeks of age
| Gene | Description | jck vs WT (fold) |
|---|---|---|
| Frzb | frizzled-related protein | −3.54 |
| Wnt16 | wingless-type MMTV integration site family, member 16 | −2.35 |
| Dkk3 | dickkopf 3 homolog (Xenopus laevis) | −2.16 |
| Sost | sclerostin | −2.00 |
| Tgfb3 | transforming growth factor, beta 3 | −1.90 |
| Wnt10b | wingless-type MMTV integration site family, member 10B | −1.80 |
| Wnt5b | wingless-type MMTV integration site family, member 5B | −1.77 |
| Cdh2 | cadherin 2, type 1, N-cadherin (neuronal) | −1.57 |
| Wif1 | WNT inhibitory factor 1 | −1.55 |
| Sox17 | SRY (sex determining region Y)-box 17 | −1.38 |
| Ctnnb1 | catenin (cadherin-associated protein), beta 1, 88kDa | −1.38 |
| Kremen1 | kringle containing transmembrane protein 1 | −1.37 |
| Ppp2r5b | protein phosphatase 2, regulatory subunit B′, beta | −1.37 |
| Lrp5 | low density lipoprotein receptor-related protein 5 | −1.36 |
| Smo | smoothened, frizzled family receptor | −1.34 |
| Sfrp1 | secreted frizzled-related protein 1 | 2.06 |
| Sfrp4 | secreted frizzled-related protein 4 | 1.80 |
| Dkkl1 | dickkopf-like 1 | 1.80 |
| Crebbp | CREB binding protein | 1.51 |
| Map4k1 | mitogen-activated protein kinase kinase kinase kinase 1 | 1.48 |
| Tgfbr1 | transforming growth factor, beta receptor 1 | 1.43 |
| Pkd1 | polycystic kidney disease 1 | 1.40 |
| Csnk2b | casein kinase 2, beta polypeptide | 1.39 |
| Rara | retinoic acid receptor, alpha | 1.36 |
| Cd44 | CD44 molecule (Indian blood group) | 1.33 |
| Csnk1g1 | casein kinase 1, gamma 1 | 1.32 |
| Sox12 | SRY (sex determining region Y)-box 12 | 1.31 |
| Tgfb1 | transforming growth factor, beta 1 | 1.30 |
| Ep300 | E1A binding protein p300 | 1.30 |
Table 4.
Genes with significant expression change (> 1.2 fold, p < 0.05, n = 6) in bones from 1D11 treated jck mice compared with PBS-treated ones at 12 weeks of age
| Gene | Description | 1D11 vs PBS (fold) | jck vs WT (fold) |
|---|---|---|---|
| Csnk2b | casein kinase 2, beta polypeptide | −1.29 | 1.39 |
| Dvl3 | dishevelled, dsh homolog 3 (Drosophila) | 1.56 | N.S. |
| Pkd1 | polycystic kidney disease 1 | 1.41 | −1.40 |
| Smo | smoothened, frizzled family receptor | 1.34 | −1.34 |
| Ctnnb1 | catenin (cadherin-associated protein), beta 1, 88kDa | 1.31 | −1.36 |
| Appl2 | adaptor protein, phosphotyrosine interaction, PH domain and leucine zipper containing 2 | 1.31 | N.S. |
| Fzd5 | frizzled family receptor 5 | 1.26 | N.S. |
| Dvl1 | dishevelled, dsh homolog 1 (Drosophila) | 1.20 | −1.16 |
N.S, not significant
Expression of Sost, a Wnt antagonist, was decreased in jck bones compared to WT mice at 12 weeks of age most likely due to significantly elevated serum PTH levels (Table 3, Fig 11 A and Fig. 1). 1D11 treatment was associated with a strong trend toward a further suppression of Sost mRNA expression in the jck bones at this time point. As we have previously shown, Sost mRNA expression is most highly up-regulated at an earlier CKD stage in this model and in human bone biopsies and may contribute to the early repression of osteocyte Wnt/βcatenin signaling. Therefore to understand the effect of 1D11 on Sost expression, we performed a similar 1 week 1D11 study using 7 week old mice (Fig. 3). Consistent with our previous observation, Sost mRNA expression was significantly increased in jck bones compared to WT bones at 8 but not 12 weeks. 1D11 treatment for 1 week completely normalized the increased Sost expression in the 8-week jck bones (Fig 11A). To further explore changes in sclerostin, serum Sost levels were measured using a commercially available ELISA assay. However, no significant changes were observed between WT and jck mice with or without 1D11 treatment (Fig. 11B).
Fig. 11.
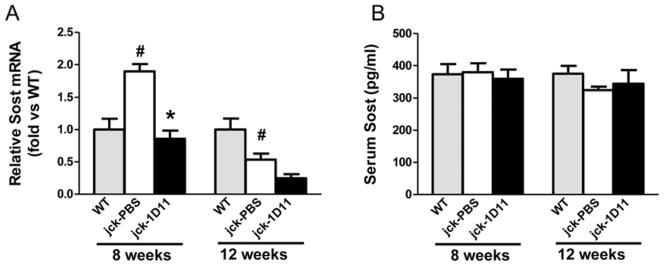
Effect of 1D11 on Sost expression in bone. 7- and 11-week old jck mice treated with PBS or 1D11 (5 mg/kg) at days 1, 3, 5 and 7. Long bones were collected from these animals and age-matched WT mice to serve as controls at day 8 (8 or 12 weeks old). (A) Total RNA was extracted from tibia and femur bone shafts and whole genome mRNA expression were analyzed. Sost mRNA levels were significantly elevated in jck bones at 8 weeks but suppressed at 12 week. 1D11 treatment suppressed Sost expression in jck bone at both 8 and 12 weeks. (B) serum Sost levels were not different between WT and jck mice and 1D11 treatment had no effect on serum Sost levels. Data are shown as mean ± SEM. # indicates p < 0.05 compared with WT mice and * indicates p < 0.05 compared with jck mice treated with PBS by one-way ANOVA and Tukey’s multiple comparison test (n = 6).
Discussion
Renal osteodystrophy represents a spectrum of bone diseases from high- to low-turnover In CKD, abnormal bone turnover is associated with dysregulated mineral metabolism, increased risk for cardiovascular calcification, left ventricular hypertrophy, and mortality. (9,11,46) Identification of additional factors regulating bone turnover, especially in the early stages, is important for understanding the pathogenesis of CKD-MBD. Previously reported longitudinal analysis of jck mice demonstrated that the initial stages of high-turnover disease occurred independently of detectable PTH changes. Increased osteoclast activity was likely caused by induction of sclerostin, decreased β-catenin signaling in osteocytes, and a corresponding increase in the RANKL/OPG ratio. (6) Similar changes were found in human bone biopsies suggesting that alterations in Wnt/β-catenin signaling may be a common feature of ROD. This evidence is supported by clinical epidemiologic studies demonstrating increased serum sclerostin in ROD. (28,29)
Jck mice develop CKD as a consequence of activating mutations in Nek8, leading to increased renal expression of polycystin 1 and 2 (PC1 and PC2) with subsequent alterations in cilia structure and function. (24) In contrast, loss of function PKD1 mutations induce polycystic kidney disease and skeletal defects. (26,27) Although primary osteoblast cilia are mechanosensors influencing bone remodeling via β-catenin signaling (47), NEK8 mutations did not influence bone disease – presumably because slight increases in PC1 and PC2 expression do not have the same detrimental effects as no or insufficient levels of these proteins. (6) In vivo bone parameters and ex vivo bone marrow stromal cell differentiation potential were not different between 6 week old WT and jck mice before the onset of renal dysfunction. These observations suggest that observed differences in bone are a consequence of renal dysfunction. Coupled to evidence for similar molecular changes in clinical biopsies, our data supports the use of jck mouse as a reasonable model that replicates the salient features of human CKD-MBD with associated high turnover ROD.
Our study focused on TGF-β’s potential role on bone in early CKD as this cytokine’s positive role in maintaining skeletal health is well known (30,48,49) and TGF-β1 deletion or transgenic inhibition of the TGF-β pathway in osteoblasts results in decreased bone formation. (32,37) Additionally, TGF-β1 circulating levels and bone expression are up-regulated during CKD progression along with increased sclerostin and FGF23. (39,40,50) Elevated TGF-β activity is also associated with enhanced osteoblast and/or osteoclast activity in genetic bone diseases such as Camurati-Engelmann disease (CED) and osteogenesis imperfecta (OI). (31,32,51–54) Finally, TGF-β and Wnt/β-catenin cross-talk has been well described.(34)
The observed elevations of TGF-β1 mRNA, its receptor expression and TGF-β signaling in jck mice suggest that TGF-β1 may play an important role in the pathogenesis of high-turnover ROD. TGF-β neutralization in jck mice attenuated the elevated levels of bone turnover markers, reduced bone formation rates, decreased osteoclast and osteoblast surface areas, increased trabecular bone volume, and increased cortical thickness with clear reduction in cortical porosity and fibrosis (Fig. 4 and 5). In addition, TGF-β antagonism did not change serum BUN, PTH, Pi or 1,25(OH)2D3 levels suggesting the a direct effect on bone rather than a systemic effect.
Our findings are consistent with the observations of transgenic mice expressing an osteoblast specific truncated type II TGF-β receptor which developed an age-dependent increase in trabecular bone mass due to decreased resorption and formation. (37) These results coupled to the observations that TGFβ1 expression increases with age raises the possibility that TGFβ1 may contribute to age associated bone loss. In contrast, our findings are distinct from studies in normal juvenile mice, where TGF-β inhibition was associated with increased osteoblast differentiation and decreased osteoclast differentiation. (38,55) Taken together, our results contribute to the growing evidence that TGF-β’s effects on bone are dose and context dependent.
The complexity of TGF-β’s regulation on bone turnover is illustrated by its influence on osteoblast/osteocyte differentiation, osteoclastogenesis and the coupling between bone formation and resorption. Our findings suggest that blocking TGFβ’s actions primarily lead to attenuation of osteoblast activity in the high-turnover ROD setting. We observed increased pSMAD2/SMAD2 expression only in protein extracted from jck bone shafts but not bone marrow. It is possible that a small cell sub-population within the bone marrow may also respond to TGF-β as the significant increase in osteoblast precursors derived from jck bone marrow is attenuated by TGF-β neutralization (Fig. 10 A). Since immunostaining in jck bones clearly demonstrated that pSMAD2/3 was induced primarily in osteoblasts and early osteocytes but not osteoclasts (Fig. 2), this observation together with the immunoblot data (Fig. 9) supports a direct role on osteoblast lineage cells. Indeed, the reduced pSMAD2 in osteoblasts and osteocytes was expected as TGF-β’s influence on osteoblast lineage is well described both in vitro and in vivo. TGF-β1 has been shown to temporally influence the differentiation state of osteoblasts through promotion of proliferation and differentiation including increased matrix/osteoid deposition necessary for normal mineralization. Although observed signaling changes were limited to the osteoblast lineage, osteoclast number and activity were significantly suppressed by long-term TGF-β antagonism (Fig. 4, 5 and 7).
As several in vitro studies have demonstrated cell and dose dependent effects of TGF-β on osteoclasts via modulation of MAP kinase pathways, we cannot rule out direct effects based on the absence of pSMAD2/3 modulation. (56–60) However, it should be noted that in vivo evidence for a direct role of TGF-β on osteoclasts is lacking. Alternatively, TGF-β may modulate osteoclast activity indirectly through the relative ratio of osteoblast/osteocyte expressed RANKL/OPG. Regulation of osteoclast proliferation and/or differentiation by osteoblasts/osteocytes is not a novel mechanism. For example, continuous elevation of PTH leads to increased bone resorption by stimulating RANKL expression in osteoblasts. (61)
TGF-β1 is the key factor responsible for recruitment of osteoblast precursor cells to resorption sites thereby coupling osteoblast and osteoclast differentiation/activity both temporally and spatially. (32,62) Co-staining of TRAP and osterix confirmed increased numbers of remodeling units containing co-localized osteoclasts and osteoblasts with no evidence of resorption/formation de-coupling. Nonetheless, the antibody’s effect on bone formation could be at least partially due to the neutralization of osteoclast released TGF-β and subsequent inhibition of osteoblast precursor migration.
All major regulators of bone metabolism contribute to the regulation of osteoblast and osteocyte life span by modulating apoptosis. (63) TGF-β is known to induce apoptosis in a variety of cell types, however data on its role in osteoblastic or osteocytic apoptosis are contradictory. TGF-β inhibits osteoblast and osteocyte apoptosis in vitro (64,65) but mice lacking Smad3 exhibit decreased bone mass associated with increased osteoclast apoptosis. (66) Our data demonstrated that inhibiting TGF-β could attenuate bone disease in CKD with corresponding restoration of Wnt/β-catenin signaling, an important regulator of osteocyte apoptosis. TGF-β could contribute to disease pathogenesis via effects on apoptosis and/or indirectly antagonizing Wnt/β-catenin promotion of survival. However, repression of TGF-β signaling did not have a significant effect on osteocyte apoptosis in jck mice as measured by TUNEL staining of bone sections (Fig. 10).
Our whole genome RNA sequencing data from 12 week old mice further validated our previously reported repression of osteocyte Wnt/β-catenin signaling (Table 3 and 4). (6) Wnts (Wnt16, Wnt10b and Wnt5b), Wnt receptors (Frzb and Lrp5), and β-catenin are all significantly suppressed, whereas, negative regulators of Wnts (Sfrp1, Sfrp4 and Dkk1) are significantly elevated. In addition, Pkd1 a known downstream gene for β-catenin is also significantly up-regulated.(26) More importantly, 1 week antagonism of TGF-β normalized expression of β-catenin, casein kinase β2 and Pkd1 expression and modulated other genes associated with stimulation of the Wnt/β-catenin pathway.
Sclerostin is significantly increased in jck bones and human biopsies from the early stages of CKD. This change is associated with an expected repression of β-catenin signaling and increased osteoclast activity. (6) Consistent with this finding, our whole genome RNA data from 8 week mice demonstrated that Sost expression was increased 2.3 fold in jck bones compared to WT bones (p < 0.05). After 1 week of anti-TGF-β administration, Sost expression in the jck bones was normalized to levels similar to that in age matched WT mice. (p < 0.05 vs. jck). At 12 weeks of age, elevated SOST could no longer account for changes in β-catenin signaling, presumably because PTH, a negative regulator of Sost expression is elevated.(67–69) To further confirm our observation, we measured serum Sost levels with an ELISA assay. However, significant changes were not observed between WT and jck, or jck treated with vehicle or 1D11 at 8 weeks of age. Previously, we demonstrated that mRNA levels as detected by real-time RT-PCR were consistent with changes in sclerostin protein levels as assessed by immunostaining. (6) Taking together, these data raise the possibility that local Sost’s effect on bone may predominant. Indeed, Jastrzebsk, et al. have recently reported a similar discrepancy between Sost bone mRNA levels and serum protein levels in serum from an ovariectomy model. (70)
The current studies focused solely on initial mechanisms associated with onset of high bone turnover and did not utilize experimental conditions to fully address the potential influence of TGF-β on vascular calcification. Although we have previously demonstrated that jck mice do exhibit vascular calcification and early signs of left ventricular hypertrophy, these events occur in significantly older mice than analyzed in the current studies. Similarly, rats treated with high doses of adenine, vitamin D, calcium and phosphorus can also exhibit significant vascular calcification. However, these conditions induce very severe changes in bone disease that do not reflect changes typically observed in clinical biopsies. The adenine model described in our studies exhibits a high-turnover bone disease similar to jck mice without the treatments previously described to drive vascular calcification. Additional studies will be required to assess the role of TGF-β on vascular calcification.
In summary, our data demonstrates that increased TGF-β1 expression and signaling is associated with the suppression of Wnt/β-catenin signaling in bone during CKD progression and may contribute to the pathogenesis of high-turnover ROD. TGF-β neutralization attenuates increased bone turnover and improved bone quality via a SMAD dependent restoration of Wnt/β-catenin signaling in osteoblast/osteocytes. Our findings also provide important evidence that TGF-β contributes to the pathogenesis of high-turnover ROD independent of serum PTH level.
Acknowledgments
The authors would like to thank, from Genzyme, Kuber Sampath for discussions and data interpretation, William Weber for imaging analysis, Leah Curtin for colony management, Michael Phipps, Matthew DeRiso, Patrick DeCourcy and Timothy Devlin for genotyping. The authors also thank Keith Condon, Nicoletta Bivi and David Southern from Indiana University School of Medicine for technical help in quantification of apoptosis.
Footnotes
This article has been accepted for publication and undergone full peer review but has not been through the copyediting, typesetting, pagination and proofreading process, which may lead to differences between this version and the Version of Record. Please cite this article as doi: [10.1002/jbmr.2120]
Disclosures: SLiu, WS, JHB, WT, YS, BK, RG, SR, LP, KM, SC, THX, HL, SL and SCS are employees of Genzyme, a Sanofi company.
The rest of the authors state that they have no conflicts of interest.
Authors’ roles
SLiu and SCS contributed to project concept and strategy development. SLiu, WS, JHB, WT, YS, BK, RG, SR, LP, KM, GZ contributed to specific study design, data acquisition and analysis. SLiu, YS, LP, CX, TB, SL and SCS contributed to data interpretation. All authors participated in revising the manuscript and approved manuscript submission.
References
- 1.Group KC-MW. KDIGO clinical practice guideline for the diagnosis, evaluation, prevention, and treatment of Chronic Kidney Disease-Mineral and Bone Disorder (CKD-MBD) Kidney Int Suppl. 2009;(113):S1–130. doi: 10.1038/ki.2009.188. [DOI] [PubMed] [Google Scholar]
- 2.Jamal SA, West SL, Miller PD. Fracture risk assessment in patients with chronic kidney disease. Osteoporos Int. 2012;23(4):1191–8. doi: 10.1007/s00198-011-1781-0. [DOI] [PubMed] [Google Scholar]
- 3.Hamdy NA, Kanis JA, Beneton MN, Brown CB, Juttmann JR, Jordans JG, Josse S, Meyrier A, Lins RL, Fairey IT. Effect of alfacalcidol on natural course of renal bone disease in mild to moderate renal failure. BMJ. 1995;310(6976):358–63. doi: 10.1136/bmj.310.6976.358. [DOI] [PMC free article] [PubMed] [Google Scholar]
- 4.Moe SM, Radcliffe JS, White KE, Gattone VH, 2nd, Seifert MF, Chen X, Aldridge B, Chen NX. The pathophysiology of early-stage chronic kidney disease-mineral bone disorder (CKD-MBD) and response to phosphate binders in the rat. J Bone Miner Res. 2011;26(11):2672–81. doi: 10.1002/jbmr.485. [DOI] [PubMed] [Google Scholar]
- 5.Wesseling-Perry K, Pereira RC, Tseng CH, Elashoff R, Zaritsky JJ, Yadin O, Sahney S, Gales B, Juppner H, Salusky IB. Early skeletal and biochemical alterations in pediatric chronic kidney disease. Clin J Am Soc Nephrol. 2012;7(1):146–52. doi: 10.2215/CJN.05940611. [DOI] [PMC free article] [PubMed] [Google Scholar]
- 6.Sabbagh Y, Graciolli FG, O’Brien S, Tang W, Dos Reis LM, Ryan S, Phillips L, Boulanger J, Song W, Bracken C, Liu S, Ledbetter S, Dechow P, Canziani ME, Carvalho AB, Jorgetti V, Moyses RM, Schiavi SC. Repression of osteocyte Wnt/beta-catenin signaling is an early event in the progression of renal osteodystrophy. J Bone Miner Res. 2012;27(8):1757–72. doi: 10.1002/jbmr.1630. [DOI] [PubMed] [Google Scholar]
- 7.Lobao R, Carvalho AB, Cuppari L, Ventura R, Lazaretti-Castro M, Jorgetti V, Vieira JG, Cendoroglo M, Draibe SA. High prevalence of low bone mineral density in pre-dialysis chronic kidney disease patients: bone histomorphometric analysis. Clin Nephrol. 2004;62(6):432–439. doi: 10.5414/cnp62432. [DOI] [PubMed] [Google Scholar]
- 8.Tomiyama C, Carvalho AB, Higa A, Jorgetti V, Draibe SA, Canziani ME. Coronary calcification is associated with lower bone formation rate in CKD patients not yet in dialysis treatment. J Bone Miner Res. 2010;25 (3):499–504. doi: 10.1359/jbmr.090735. [DOI] [PubMed] [Google Scholar]
- 9.Moe S, Drueke T, Cunningham J, Goodman W, Martin K, Olgaard K, Ott S, Sprague S, Lameire N, Eknoyan G Kidney Disease: Improving Global O. Definition, evaluation, and classification of renal osteodystrophy: a position statement from Kidney Disease: Improving Global Outcomes (KDIGO) Kidney Int. 2006;69(11):1945–53. doi: 10.1038/sj.ki.5000414. [DOI] [PubMed] [Google Scholar]
- 10.Malluche HH, Mawad H, Monier-Faugere MC. The importance of bone health in end-stage renal disease: out of the frying pan, into the fire? Nephrol Dial Transplant. 2004;19(Suppl 1):i9–13. doi: 10.1093/ndt/gfh1002. [DOI] [PubMed] [Google Scholar]
- 11.Hruska KA, Mathew S, Lund RJ, Memon I, Saab G. The pathogenesis of vascular calcification in the chronic kidney disease mineral bone disorder: the links between bone and the vasculature. Semin Nephrol. 2009;29 (2):156–65. doi: 10.1016/j.semnephrol.2009.01.008. [DOI] [PMC free article] [PubMed] [Google Scholar]
- 12.Price PA, Faus SA, Williamson MK. Bisphosphonates alendronate and ibandronate inhibit artery calcification at doses comparable to those that inhibit bone resorption. Arterioscler Thromb Vasc Biol. 2001;21 (5):817–24. doi: 10.1161/01.atv.21.5.817. [DOI] [PubMed] [Google Scholar]
- 13.Price PA, June HH, Buckley JR, Williamson MK. Osteoprotegerin inhibits artery calcification induced by warfarin and by vitamin D. Arterioscler Thromb Vasc Biol. 2001;21(10):1610–6. doi: 10.1161/hq1001.097102. [DOI] [PubMed] [Google Scholar]
- 14.Lomashvili KA, Monier-Faugere MC, Wang X, Malluche HH, O’Neill WC. Effect of bisphosphonates on vascular calcification and bone metabolism in experimental renal failure. Kidney Int. 2009;75(6):617–25. doi: 10.1038/ki.2008.646. [DOI] [PMC free article] [PubMed] [Google Scholar]
- 15.Gonzalez EA, Lund RJ, Martin KJ, McCartney JE, Tondravi MM, Sampath TK, Hruska KA. Treatment of a murine model of high-turnover renal osteodystrophy by exogenous BMP-7. Kidney Int. 2002;61 (4):1322–31. doi: 10.1046/j.1523-1755.2002.00258.x. [DOI] [PubMed] [Google Scholar]
- 16.Shanahan CM, Crouthamel MH, Kapustin A, Giachelli CM. Arterial calcification in chronic kidney disease: key roles for calcium and phosphate. Circ Res. 2011;109(6):697–711. doi: 10.1161/CIRCRESAHA.110.234914. [DOI] [PMC free article] [PubMed] [Google Scholar]
- 17.Ferreira A, Frazão JM, Monier-Faugere MC, Gil C, Galvao J, Oliveira C, Baldaia J, Rodrigues I, Santos C, Ribeiro S, Hoenger RM, Duggal A, Malluche HH Sevelamer Study G. Effects of sevelamer hydrochloride and calcium carbonate on renal osteodystrophy in hemodialysis patients. J Am Soc Nephrol. 2008;19 (2):405–412. doi: 10.1681/ASN.2006101089. [DOI] [PMC free article] [PubMed] [Google Scholar]
- 18.Mathew S, Lund RJ, Strebeck F, Tustison KS, Geurs T, Hruska KA. Reversal of the adynamic bone disorder and decreased vascular calcification in chronic kidney disease by sevelamer carbonate therapy. J Am Soc Nephrol. 2007;18(1):122–130. doi: 10.1681/ASN.2006050490. [DOI] [PubMed] [Google Scholar]
- 19.Chertow GM, Burke SK, Raggi P Treat to Goal Working G. Sevelamer attenuates the progression of coronary and aortic calcification in hemodialysis patients. Kidney Int. 2002;62(1):245–252. doi: 10.1046/j.1523-1755.2002.00434.x. [DOI] [PubMed] [Google Scholar]
- 20.Drueke TB. Which vitamin D derivative to prescribe for renal patients. Curr Opin Nephrol Hypertens. 2005;14 (4):343–349. doi: 10.1097/01.mnh.0000172720.34229.39. [DOI] [PubMed] [Google Scholar]
- 21.Andress DL. Vitamin D in chronic kidney disease: a systemic role for selective vitamin D receptor activation. Kidney Int. 2006;69(1):33–43. doi: 10.1038/sj.ki.5000045. [DOI] [PubMed] [Google Scholar]
- 22.Raggi P, James G, Burke SK, Bommer J, Chasan-Taber S, Holzer H, Braun J, Chertow GM. Decrease in thoracic vertebral bone attenuation with calcium-based phosphate binders in hemodialysis. J Bone Miner Res. 2005;20(5):764–772. doi: 10.1359/JBMR.041221. [DOI] [PubMed] [Google Scholar]
- 23.Stubbs JR, He N, Idiculla A, Gillihan R, Liu S, David V, Hong Y, Quarles LD. Longitudinal evaluation of FGF23 changes and mineral metabolism abnormalities in a mouse model of chronic kidney disease. J Bone Miner Res. 2012;27(1):38–46. doi: 10.1002/jbmr.516. [DOI] [PMC free article] [PubMed] [Google Scholar]
- 24.Sohara E, Luo Y, Zhang J, Manning DK, Beier DR, Zhou J. Nek8 regulates the expression and localization of polycystin-1 and polycystin-2. J Am Soc Nephrol. 2008;19(3):469–76. doi: 10.1681/ASN.2006090985. [DOI] [PMC free article] [PubMed] [Google Scholar]
- 25.Smith LA, Bukanov NO, Husson H, Russo RJ, Barry TC, Taylor AL, Beier DR, Ibraghimov-Beskrovnaya O. Development of polycystic kidney disease in juvenile cystic kidney mice: insights into pathogenesis, ciliary abnormalities, and common features with human disease. J Am Soc Nephrol. 2006;17(10):2821–31. doi: 10.1681/ASN.2006020136. [DOI] [PubMed] [Google Scholar]
- 26.Xiao Z, Zhang S, Cao L, Qiu N, David V, Quarles LD. Conditional disruption of Pkd1 in osteoblasts results in osteopenia due to direct impairment of bone formation. J Biol Chem. 2010;285(2):1177–87. doi: 10.1074/jbc.M109.050906. [DOI] [PMC free article] [PubMed] [Google Scholar]
- 27.Xiao Z, Zhang S, Mahlios J, Zhou G, Magenheimer BS, Guo D, Dallas SL, Maser R, Calvet JP, Bonewald L, Quarles LD. Cilia-like structures and polycystin-1 in osteoblasts/osteocytes and associated abnormalities in skeletogenesis and Runx2 expression. J Biol Chem. 2006;281(41):30884–95. doi: 10.1074/jbc.M604772200. [DOI] [PMC free article] [PubMed] [Google Scholar]
- 28.Cejka D, Herberth J, Branscum AJ, Fardo DW, Monier-Faugere MC, Diarra D, Haas M, Malluche HH. Sclerostin and Dickkopf-1 in renal osteodystrophy. Clin J Am Soc Nephrol. 2011;6(4):877–82. doi: 10.2215/CJN.06550810. [DOI] [PMC free article] [PubMed] [Google Scholar]
- 29.Pelletier S, Dubourg L, Carlier MC, Hadj-Aissa A, Fouque D. The Relation between Renal Function and Serum Sclerostin in Adult Patients with CKD. Clin J Am Soc Nephrol. 2013 doi: 10.2215/CJN.07670712. [DOI] [PMC free article] [PubMed] [Google Scholar]
- 30.Balooch G, Balooch M, Nalla RK, Schilling S, Filvaroff EH, Marshall GW, Marshall SJ, Ritchie RO, Derynck R, Alliston T. TGF-beta regulates the mechanical properties and composition of bone matrix. Proc Natl Acad Sci U S A. 2005;102(52):18813–8. doi: 10.1073/pnas.0507417102. [DOI] [PMC free article] [PubMed] [Google Scholar]
- 31.Alliston T. TGF-beta regulation of osteoblast differentiation and bone matrix properties. J Musculoskelet Neuronal Interact. 2006;6(4):349–50. [PubMed] [Google Scholar]
- 32.Tang Y, Wu X, Lei W, Pang L, Wan C, Shi Z, Zhao L, Nagy TR, Peng X, Hu J, Feng X, Van Hul W, Wan M, Cao X. TGF-beta1-induced migration of bone mesenchymal stem cells couples bone resorption with formation. Nat Med. 2009;15(7):757–65. doi: 10.1038/nm.1979. [DOI] [PMC free article] [PubMed] [Google Scholar]
- 33.Breen EC, Ignotz RA, McCabe L, Stein JL, Stein GS, Lian JB. TGF beta alters growth and differentiation related gene expression in proliferating osteoblasts in vitro, preventing development of the mature bone phenotype. J Cell Physiol. 1994;160(2):323–35. doi: 10.1002/jcp.1041600214. [DOI] [PubMed] [Google Scholar]
- 34.Zhou S. TGF-beta regulates beta-catenin signaling and osteoblast differentiation in human mesenchymal stem cells. J Cell Biochem. 2011;112(6):1651–60. doi: 10.1002/jcb.23079. [DOI] [PMC free article] [PubMed] [Google Scholar]
- 35.Chen G, Deng C, Li YP. TGF-beta and BMP signaling in osteoblast differentiation and bone formation. Int J Biol Sci. 2012;8(2):272–88. doi: 10.7150/ijbs.2929. [DOI] [PMC free article] [PubMed] [Google Scholar]
- 36.Zhao L, Hantash BM. TGF-beta1 regulates differentiation of bone marrow mesenchymal stem cells. Vitam Horm. 2011;87:127–41. doi: 10.1016/B978-0-12-386015-6.00042-1. [DOI] [PubMed] [Google Scholar]
- 37.Filvaroff E, Erlebacher A, Ye J, Gitelman SE, Lotz J, Heillman M, Derynck R. Inhibition of TGF-beta receptor signaling in osteoblasts leads to decreased bone remodeling and increased trabecular bone mass. Development. 1999;126(19):4267–79. doi: 10.1242/dev.126.19.4267. [DOI] [PubMed] [Google Scholar]
- 38.Edwards JR, Nyman JS, Lwin ST, Moore MM, Esparza J, O’Quinn EC, Hart AJ, Biswas S, Patil CA, Lonning S, Mahadevan-Jansen A, Mundy GR. Inhibition of TGF-beta signaling by 1D11 antibody treatment increases bone mass and quality in vivo. J Bone Miner Res. 2010;25(11):2419–26. doi: 10.1002/jbmr.139. [DOI] [PubMed] [Google Scholar]
- 39.Santos FR, Moyses RM, Montenegro FL, Jorgetti V, Noronha IL. IL-1beta, TNF-alpha, TGF-beta, and bFGF expression in bone biopsies before and after parathyroidectomy. Kidney Int. 2003;63(3):899–907. doi: 10.1046/j.1523-1755.2003.00835.x. [DOI] [PubMed] [Google Scholar]
- 40.Duarte ME, Carvalho EF, Cruz EA, Lucena SB, Andress DL. Cytokine accumulation in osteitis fibrosa of renal osteodystrophy. Braz J Med Biol Res. 2002;35(1):25–9. doi: 10.1590/s0100-879x2002000100004. [DOI] [PubMed] [Google Scholar]
- 41.Tamagaki K, Yuan Q, Ohkawa H, Imazeki I, Moriguchi Y, Imai N, Sasaki S, Takeda K, Fukagawa M. Severe hyperparathyroidism with bone abnormalities and metastatic calcification in rats with adenine-induced uraemia. Nephrol Dial Transplant. 2006;21(3):651–659. doi: 10.1093/ndt/gfi273. [DOI] [PubMed] [Google Scholar]
- 42.Parfitt AM, Drezner MK, Glorieux FH, Kanis JA, Malluche H, Meunier PJ, Ott SM, Recker RR. Bone histomorphometry: standardization of nomenclature, symbols, and units. Report of the ASBMR Histomorphometry Nomenclature Committee. J Bone Miner Res. 1987;2(6):595–610. doi: 10.1002/jbmr.5650020617. [DOI] [PubMed] [Google Scholar]
- 43.Plotkin LI, Lezcano V, Thostenson J, Weinstein RS, Manolagas SC, Bellido T. Connexin 43 is required for the anti-apoptotic effect of bisphosphonates on osteocytes and osteoblasts in vivo. J Bone Miner Res. 2008;23(11):1712–21. doi: 10.1359/JBMR.080617. [DOI] [PMC free article] [PubMed] [Google Scholar]
- 44.Bivi N, Condon KW, Allen MR, Farlow N, Passeri G, Brun LR, Rhee Y, Bellido T, Plotkin LI. Cell autonomous requirement of connexin 43 for osteocyte survival: consequences for endocortical resorption and periosteal bone formation. J Bone Miner Res. 2012;27(2):374–89. doi: 10.1002/jbmr.548. [DOI] [PMC free article] [PubMed] [Google Scholar]
- 45.Bouxsein ML, Boyd SK, Christiansen BA, Guldberg RE, Jepsen KJ, Muller R. Guidelines for assessment of bone microstructure in rodents using micro-computed tomography. J Bone Miner Res. 2010;25 (7):1468–86. doi: 10.1002/jbmr.141. [DOI] [PubMed] [Google Scholar]
- 46.London GM, Marty C, Marchais SJ, Guerin AP, Metivier F, de Vernejoul MC. Arterial calcifications and bone histomorphometry in end-stage renal disease. J Am Soc Nephrol. 2004;15(7):1943–51. doi: 10.1097/01.asn.0000129337.50739.48. [DOI] [PubMed] [Google Scholar]
- 47.Wallingford JB, Mitchell B. Strange as it may seem: the many links between Wnt signalling, planar cell polarity, and cilia. Genes and Development. 2011;25:201–213. doi: 10.1101/gad.2008011. [DOI] [PMC free article] [PubMed] [Google Scholar]
- 48.Mundy GR, Bonewald LF. Role of TGF beta in bone remodeling. Ann N Y Acad Sci. 1990;593:91–7. doi: 10.1111/j.1749-6632.1990.tb16102.x. [DOI] [PubMed] [Google Scholar]
- 49.Janssens K, ten Dijke P, Janssens S, Van Hul W. Transforming growth factor-beta1 to the bone. Endocr Rev. 2005;26(6):743–74. doi: 10.1210/er.2004-0001. [DOI] [PubMed] [Google Scholar]
- 50.Lee SB, Kanasaki K, Kalluri R. Circulating TGF-beta1 as a reliable biomarker for chronic kidney disease progression in the African-American population. Kidney Int. 2009;76(1):10–2. doi: 10.1038/ki.2009.130. [DOI] [PMC free article] [PubMed] [Google Scholar]
- 51.Kinoshita A, Saito T, Tomita H, Makita Y, Yoshida K, Ghadami M, Yamada K, Kondo S, Ikegawa S, Nishimura G, Fukushima Y, Nakagomi T, Saito H, Sugimoto T, Kamegaya M, Hisa K, Murray JC, Taniguchi N, Niikawa N, Yoshiura K. Domain-specific mutations in TGFB1 result in Camurati-Engelmann disease. Nat Genet. 2000;26(1):19–20. doi: 10.1038/79128. [DOI] [PubMed] [Google Scholar]
- 52.Hernandez MV, Peris P, Guanabens N, Alvarez L, Monegal A, Pons F, Ponce A, Munoz-Gomez J. Biochemical markers of bone turnover in Camurati-Engelmann disease: a report on four cases in one family. Calcif Tissue Int. 1997;61(1):48–51. doi: 10.1007/s002239900293. [DOI] [PubMed] [Google Scholar]
- 53.Whyte MP, Totty WG, Novack DV, Zhang X, Wenkert D, Mumm S. Camurati-Engelmann disease: unique variant featuring a novel mutation in TGFbeta1 encoding transforming growth factor beta 1 and a missense change in TNFSF11 encoding RANK ligand. J Bone Miner Res. 2011;26(5):920–33. doi: 10.1002/jbmr.283. [DOI] [PMC free article] [PubMed] [Google Scholar]
- 54.Gebken J, Brenner R, Feydt A, Notbohm H, Brinckmann J, Muller PK, Batge B. Increased cell surface expression of receptors for transforming growth factor-beta on osteoblasts from patients with Osteogenesis imperfecta. Pathobiology. 2000;68(3):106–12. doi: 10.1159/000055910. [DOI] [PubMed] [Google Scholar]
- 55.Mohammad KS, Chen CG, Balooch G, Stebbins E, McKenna CR, Davis H, Niewolna M, Peng XH, Nguyen DH, Ionova-Martin SS, Bracey JW, Hogue WR, Wong DH, Ritchie RO, Suva LJ, Derynck R, Guise TA, Alliston T. Pharmacologic inhibition of the TGF-beta type I receptor kinase has anabolic and anti-catabolic effects on bone. PLoS One. 2009;4(4):e5275. doi: 10.1371/journal.pone.0005275. [DOI] [PMC free article] [PubMed] [Google Scholar]
- 56.Cicek M, Vrabel A, Sturchio C, Pederson L, Hawse JR, Subramaniam M, Spelsberg TC, Oursler MJ. TGF-beta inducible early gene 1 regulates osteoclast differentiation and survival by mediating the NFATc1, AKT, and MEK/ERK signaling pathways. PLoS One. 2011;6(3):e17522. doi: 10.1371/journal.pone.0017522. [DOI] [PMC free article] [PubMed] [Google Scholar]
- 57.Houde N, Chamoux E, Bisson M, Roux S. Transforming growth factor-beta1 (TGF-beta1) induces human osteoclast apoptosis by up-regulating Bim. J Biol Chem. 2009;284(35):23397–404. doi: 10.1074/jbc.M109.019372. [DOI] [PMC free article] [PubMed] [Google Scholar]
- 58.Gingery A, Bradley EW, Pederson L, Ruan M, Horwood NJ, Oursler MJ. TGF-beta coordinately activates TAK1/MEK/AKT/NFkB and SMAD pathways to promote osteoclast survival. Exp Cell Res. 2008;314(15):2725–38. doi: 10.1016/j.yexcr.2008.06.006. [DOI] [PMC free article] [PubMed] [Google Scholar]
- 59.Karst M, Gorny G, Galvin RJ, Oursler MJ. Roles of stromal cell RANKL, OPG, and M-CSF expression in biphasic TGF-beta regulation of osteoclast differentiation. J Cell Physiol. 2004;200(1):99–106. doi: 10.1002/jcp.20036. [DOI] [PMC free article] [PubMed] [Google Scholar]
- 60.Yasui T, Kadono Y, Nakamura M, Oshima Y, Matsumoto T, Masuda H, Hirose J, Omata Y, Yasuda H, Imamura T, Nakamura K, Tanaka S. Regulation of RANKL-induced osteoclastogenesis by TGF-beta through molecular interaction between Smad3 and Traf6. J Bone Miner Res. 2011;26(7):1447–56. doi: 10.1002/jbmr.357. [DOI] [PubMed] [Google Scholar]
- 61.Silva BC, Costa AG, Cusano NE, Kousteni S, Bilezikian JP. Catabolic and anabolic actions of parathyroid hormone on the skeleton. J Endocrinol Invest. 2011;34(10):801–10. doi: 10.3275/7925. [DOI] [PMC free article] [PubMed] [Google Scholar]
- 62.Mundy GR. The effects of TGF-beta on bone. Ciba Found Symp. 1991;157:137–43. discussion 143–51. [PubMed] [Google Scholar]
- 63.Jilka RL, Weinstein RS, Parfitt AM, Manolagas SC. Quantifying osteoblast and osteocyte apoptosis: challenges and rewards. J Bone Miner Res. 2007;22(10):1492–501. doi: 10.1359/jbmr.070518. [DOI] [PubMed] [Google Scholar]
- 64.Jilka RL, Weinstein RS, Bellido T, Parfitt AM, Manolagas SC. Osteoblast programmed cell death (apoptosis): modulation by growth factors and cytokines. J Bone Miner Res. 1998;13(5):793–802. doi: 10.1359/jbmr.1998.13.5.793. [DOI] [PubMed] [Google Scholar]
- 65.Bodine PV, Billiard J, Moran RA, Ponce-de-Leon H, McLarney S, Mangine A, Scrimo MJ, Bhat RA, Stauffer B, Green J, Stein GS, Lian JB, Komm BS. The Wnt antagonist secreted frizzled-related protein-1 controls osteoblast and osteocyte apoptosis. J Cell Biochem. 2005;96(6):1212–30. doi: 10.1002/jcb.20599. [DOI] [PubMed] [Google Scholar]
- 66.Borton AJ, Frederick JP, Datto MB, Wang XF, Weinstein RS. The loss of Smad3 results in a lower rate of bone formation and osteopenia through dysregulation of osteoblast differentiation and apoptosis. J Bone Miner Res. 2001;16(10):1754–64. doi: 10.1359/jbmr.2001.16.10.1754. [DOI] [PubMed] [Google Scholar]
- 67.Keller H, Kneissel M. SOST is a target gene for PTH in bone. Bone. 2005;37(2):148–58. doi: 10.1016/j.bone.2005.03.018. [DOI] [PubMed] [Google Scholar]
- 68.Silvestrini G, Ballanti P, Leopizzi M, Sebastiani M, Berni S, Di Vito M, Bonucci E. Effects of intermittent parathyroid hormone (PTH) administration on SOST mRNA and protein in rat bone. J Mol Histol. 2007;38(4):261–9. doi: 10.1007/s10735-007-9096-3. [DOI] [PubMed] [Google Scholar]
- 69.Trombetti A, Cortes F, Kaelin A, Morris M, Rizzoli R. Intranasal calcitonin reducing bone pain in a patient with Camurati-Engelmann disease. Scand J Rheumatol. 2012;41(1):75–7. doi: 10.3109/03009742.2011.608195. [DOI] [PubMed] [Google Scholar]
- 70.Jastrzebski S, Kalinowski J, Stolina M, Mirza F, Torreggiani E, Kalajzic I, Won HY, Lee SK, Lorenzo J. Changes in bone sclerostin levels in mice after ovariectomy vary independently of changes in serum sclerostin levels. J Bone Miner Res. 2013;28(3):618–26. doi: 10.1002/jbmr.1773. [DOI] [PMC free article] [PubMed] [Google Scholar]