

Abstract
Background
Alcohol use in excessive quantities has deleterious effects on brain structure and behavior in adults and during periods of rapid neurodevelopment, such as prenatally. Whether similar outcomes characterize other developmental periods, such as adolescence, and in the context of less extensive use is unknown. Recent cross-sectional studies suggest that binge drinking as well as alcohol use disorders in adolescence are associated with disruptions in white matter microstructure and gray matter volumes.
Objectives
The current study followed typically developing adolescents from a baseline assessment, where no experience with alcohol was present, through two years, after which some individuals transitioned into regular use.
Methods
Participants (n = 55) completed MRI scans and behavioral assessments.
Results
Alcohol initiators (n = 30; mean baseline age 16.7 ± 1.3 years), compared to non-users (n = 25; mean baseline age 17.1 ± 1.2 years), showed altered patterns of neurodevelopment. They showed greater-than-expected decreases in cortical thickness in the right middle frontal gyrus from baseline to follow-up as well as blunted development of white matter in the right hemisphere precentral gyrus, lingual gyrus, middle temporal gyrus and anterior cingulate. Diffusion tensor imaging revealed a relative decrease over time in fractional anisotropy in the left caudate/thalamic region as well as in the right inferior frontal occipital fasciculus. Alcohol initiators did not differ from non-users at the baseline assessment; the groups were largely similar in other premorbid characteristics.
Conclusions
Subclinical alcohol use during mid-to-late adolescence is associated with deviations in neurodevelopment across several brain tissue classes. Implications for continued development and behavior are discussed.
Keywords: Adolescence, brain development, MRI
Introduction
It has been recognized for decades that the ingestion of alcohol in large quantities is associated with impaired attention, memory and executive functions in adults (1). These associations have been typically reported in individuals with severe alcohol dependence where high amounts of alcohol lead to neurotoxicity. Brain regions that are most commonly affected include the dorsomedial thalamic region, mammilary bodies, striatum and other periventricular regions that contribute to memory and attention abilities as well as regions of the frontal lobes (2,3). Moreover, chronic alcohol exposure accelerates loss of brain gray and white matter volumes in the context of normal aging (4), supporting the notion that alcohol interferes with expected developmental changes in neuronal structure in the elderly. This observation is further supported by alcohol’s neurotoxic effects in the context of prenatal exposure (5).
Alcohol’s effects on brain white matter are a particular area of interest given the advent of diffusion imaging techniques (6-8). It has been suggested that white matter microstructure may be particularly vulnerable to toxic effects of alcohol and that disruptions may be among the first signs of cerebral damage. Both early and later chronic exposure to alcohol are associated with white matter disruptions in multiple regions of the corpus callosum (1,9-12). A recent study of detoxified alcohol-dependent males found evidence of decreased white matter integrity (lower fractional anisotropy) in the body of the corpus callosum as well as other regions including the left anterior corona radiata, the left internal capsule, the left superior frontal gyrus, and multiple regions of the right hemisphere including the cerebellum, insula and pallidum (13).
Alcohol’s negative effects on brain structure are perhaps not surprising as a consequence of prenatal exposure, because this is a recognized time of rapid neurodevelopment. Similarly, alcohol’s acceleration of normative age-based declines in neuronal volume is understandable, particularly in the context of alcohol dependence and associated nutritional compromise. Whether alcohol exerts deleterious effects during other periods of the lifespan that are similarly characterized by marked organizational changes in brain structure is unknown. Adolescence represents one such period (14). Studies of brain structure during adolescence have revealed normative patterns of decrease in gray matter volume, particularly in cortical regions (15,16), as well as linear increases in white matter volume (17) throughout the brain (but see (18) for a contrary pattern of findings where white matter volumes were observed to decrease in the prefrontal cortex, particularly in females, in late adolescence). Diffusion tensor imaging (DTI) studies suggest that white matter becomes increasingly well-organized during adolescence (19-21) and that functional connectivity across cortical-to-subcortical circuits becomes more efficient (22).
Given that use of alcohol often begins during adolescence (23,24) and that significant numbers of adolescents describe themselves as regular binge drinkers (consuming at least 4–5 drinks per occasion of use (25)), the possibility of alcohol-induced neurotoxicity and interference with normal patterns of brain and behavioral development is disturbing (26). The limited work that has been done to characterize alcohol’s effects on these processes has focused on comparisons of non-using teens with teens who are self-reported binge drinkers and who often report use of other drugs of abuse. Recent findings suggest alterations in major white matter tracts in teens who report heavy drinking as compared to those who do not (26-36). Dose-response associations are difficult to establish in such studies, so it is unknown whether alcohol exerts deleterious effects based on cumulative exposure or if damage occurs at some dose threshold. As in all studies of substance abusing humans, cause-effect associations are difficult to establish, because most studies are cross-sectional, and baseline status is difficult to verify. That is, it may be that other neurobiologically-based trait factors (e.g. sensation seeking: (37)) influence who will go on to use substances in large quantities, and these trait factors may be the foundation of any observed neural differences during or after prolonged use. Moreover, interpretation is frequently complicated by several confounds including concomitant use of other drugs, the presence of comorbid psychiatric disorders that can exert independent effects on brain structure, and lack of attention to premorbid characteristics that could affect outcomes given that most work is cross-sectional (see (7) for review).
The current study adds to this literature by prospectively examining the effects of alcohol use initiation on ongoing structural brain development in a typically developing low-risk sample of adolescents without histories of externalizing behavior or other psychopathology, without concomitant use of other substances, and – most notably – without substance exposure at the baseline assessment. Across a two-year follow-up interval, participants who transitioned into alcohol use were compared to those who did not. Based on the fact that alcohol use generally begins after age-related declines in cortical gray matter have stabilized (15,16), we hypothesized that we would not observe altered patterns of cortical thickness in alcohol initiators versus non-users. Differences, if observed, would likely be limited to anterior brain regions given that these are among the last to reach maturational plateaus (15,16). Rather, we expected to observe deviations in white matter development within alcohol initiators, particularly in subcortical regions involved in reward processing (e.g. ventral striatum) and executive functions (e.g. dorsal striatum; thalamus) as well as areas and tracts such as the superior longitudinal fasciculus and cingulate cortex, that interconnect higher frontal regions with other cortical and subcortical regions.
Methods
Participants were enrolled between 2005 and 2007 in a longitudinal study of adolescent brain development. At enrollment, the full cohort (n = 203) ranged in age from 9 to 23 years. Exclusion criteria included any contraindications to MRI scanning, any lifetime evidence of DSM-IV psychopathology, including substance abuse problems, history of neurological disorder, chronic physical health conditions, estimated full-scale IQs below 70, history of learning or attention problems, any complications at the time of the child’s birth including preterm birth, and any history of head injury. In addition, participants were required to be right-handed, which was assessed at baseline and verified at follow-up with the Edinburgh Handedness Inventory (38). For the sample as a whole, it was not required that individuals be alcohol-naïve at baseline, but any reported history of binge drinking was grounds for exclusion. It should be stated at the outset that the study was designed to capture normative adolescent development and was not originally conceptualized as a study of substance use or alcohol abstinence. However, a subsample of the full range of study participants is particularly informative in relation to longitudinal trajectories associated with later substance use given its overall health and low-risk nature. This report focuses on that subsample (n = 55), comprised of individuals who reported no experience with alcohol or drugs at baseline enrollment. That is, they had never ingested even a single drink. These 55 individuals were aged 14 to 19 at baseline, representing the group that was most likely to initiate alcohol use over the follow-up interval.
Exclusion criteria were verified by a demographic and health interview questionnaire administered to the participant as well as a parent, by the Wechsler Abbreviated Scale of Intelligence (WASI: (39)), and by structured diagnostic interviews (the Kiddie Schedule for Affective Disorders: (40)) administered to the participant as well as (for those under age 18) a parent. Family history interviews verified that participants did not have first-degree relatives with substance use disorders.
Personality trait features at baseline and follow-up
An important consideration in interpreting potential effects of alcohol use is to verify that participants did not vary at baseline in major behavioral domains related to affective dispositions or externalizing tendencies, which might confound interpretation. The Achenbach Youth Self-Report Inventory (YSR; (41)) was utilized to measure externalizing tendencies. To measure major personality trait domains, the Multidimensional Personality Questionnaire (MPQ) was administered in brief form (42) to assess tendencies toward positive emotion, negative emotion and behavioral constraint. Constraint and its facets are of particular interest, because they reflect high impulse control, low risk-taking, and adherence to conventional rules. Constraint is operationalized in relation to sub-domains of Control, Harm Avoidance, and Traditionalism. Control reflects tendencies to be reflective; cautious, planful and level-headed. It is the opposite of impulsivity. Harm Avoidance reflects a tendency to avoid participation in dangerous or thrill-seeking activities (e.g. skydiving; natural disasters). High scorers prefer safer, even tedious, activities. Traditionalism reflects a bias toward the endorsement of high moral standards, religious values and institutions, positive regard for parents, the endorsement of strict child-rearing practices, and valuation of conventional propriety and a good reputation. High scorers tend to oppose rebelliousness. Low scores across these facets of Constraint suggest externalizing tendencies. The MPQ was administered at both baseline and follow-up.
All participants completed magnetic resonance imaging (MRI) scans of the brain as well as a battery of behavioral tasks. Two years after initial enrollment and testing, all were invited back for retesting. Retention was excellent with 90% of participants returning for the follow-up assessment. Follow-up intervals were close to two years for all participants, as indicated in Table 1. This report focuses on analysis of MRI data from two assessment waves (baseline and follow-up).
Table 1.
Characteristics of alcohol initiators versus non-users.
| Variable | Non-Users | Initiators | F or X2 | p |
|
|
|---|---|---|---|---|---|---|
| N | 25 | 30 | – | – | – | |
| Baseline characteristics | ||||||
| Age at baseline | 16.7 (1.3) | 17.1 (1.2) | F = 1.42 | 0.24 | 0.03 | |
| Baseline age range | 14.2 to 19.1 | 14.3 to 18.9 | – | – | – | |
| #Male/#Female | 14/11 | 16/14 | X2 = 0.039 | 0.84 | – | |
| #Caucasian/#Other Ethnicity | 23/2 | 29/1 | X2 = 3.27 | 0.20 | – | |
| Father’s education (years) | 16.8 (3.2) | 16.2 (2.6) | F = 0.54 | 0.47 | 0.01 | |
| Mother’s education (years) | 15.7 (1.7) | 15.8 (1.7) | F = 0.07 | 0.80 | 0.00 | |
| Family Income (US dollars) | 95666.7 (34323.4) | 85454.6 (37246.1) | F = 0.52 | 0.48 | 0.02 | |
| Verbal IQ | 112.5 (11.9) | 114.3 (9.1) | F = 0.64 | 0.43 | 0.01 | |
| Nonverbal IQ | 112.3 (11.8) | 110.3 (11.3) | F = 0.68 | 0.41 | 0.01 | |
| YSR Externalizing % | 0.10 (0.06) | 0.10 (0.05) | F = 0.00 | 0.99 | 0.00 | |
| Follow-up characteristics | ||||||
| Time between assessments (years) | 2.2 (0.35) | 2.15 (0.47) | F = 0.00 | 0.98 | 0.00 | |
| Age at follow-up (years) | 18.6 (1.3) | 19.2 (1.4) | F = 1.85 | 0.18 | 0.04 | |
| Age range at follow-up | 16.7 to 21.2 | 16.4 to 22.3 | – | – | – | |
| Age of first drink | – | 16.4 (2.0) | – | – | – | |
| Age of regular alcohol use | – | 17.6 (1.3), range = 15 to 20 | ||||
| Alcohol times per month | – | 3.9 (2.9), range = 1 to 12 | ||||
| Alcohol average drinks per occasion | – | 5.4 (2.6), range = 1 to 10 | ||||
| Total drinks per month | – | 22.3 (23.5), range = 1 to 84 |
Values represent means and (in parentheses) standard deviation units. Group comparisons using chi-square (X2) or one-way analysis of variance are presented; effect sizes are represented by partial eta-squared values ( ). IQs are estimated from the Wechsler Abbreviated Scale of Intelligence; YSR = Achenbach Youth Self-Report Inventory (41) percent of possible items endorsed for the Externalizing scale.
Alcohol use at baseline and follow-up
The 55 participants reported no lifetime use of alcohol or illicit drugs at baseline. None were cigarette smokers. Several measures were used to verify the participants’ alcohol use status at the follow-up assessment. These included information on frequency and amounts of alcohol as reported through the KSADS interview, self-reported drug and alcohol use from the Personal Experiences Inventory (43), and self-reported patterns of alcohol use from an in-house substance use interview, derived from NIAAA recommendations, that assessed current, past year, and lifetime use. Of the 55 participants, 25 continued to report no alcohol use at the follow-up assessment. The remainder (n = 30) initiated use of alcohol during the two-year follow-up interval and (at Time 2) reported regular drinking episodes during the past 12-months and during which they consumed, on average, multiple drinks several times weekly. In other words, across a two-year period, ingestion of alcohol had become part of these participants’ typical social routines. Within this group, the average age of first drink was reported to be 16.4, and escalation to regular use was reported to be on average at age 17.6, which coheres with national surveys that suggest accelerations of use after age 16. For instance, in 2010, it was reported that rates of current alcohol use accelerate with increasing age in the United States with 24.6% of 16 or 17 year olds reporting active use, a proportion that grows to 48.9% among 18 to 20 year-olds, reaching 70.0% among 21 to 25 year olds (www.samsha.gov, 2010). Alcohol use initiators reported drinking from 1 to 10 drinks per occasion of use in the context of weekly use of alcohol. Alcohol use characteristics are presented in Table 1 for the initiator sample.
MRI data acquisition, processing and statistical analysis
MRI data were collected on a Siemens 3 T scanner (Siemens Medical Systems, Erlangen, Germany) using an eight-channel array head coil at the University of Minnesota. Three-dimensional T1 weighted brain images were acquired in the coronal plane using a magnetization prepared rapid gradient echo (MPRAGE) sequence (TR = 2530 ms, TE = 3.65 ms, TI = 1100 ms, flip angle = 7°, 240 slices, no gap, voxel size = 1.0 × 1.0 × 1.0 mm, FOV = 256 mm). Diffusion weighted brain images were acquired by applying gradients in 12 noncollinear directions in the axial plane using a dual spin echo, single-shot, pulsed-gradient, echo-planar imaging (EPI) sequence (TR = 12.5 s, TE = 99 ms, 64 slices, no gap, voxel size = 2.0 × 2.0 × 2.0 mm, FOV = 256 mm, 2 averages, b value = 1000 s/mm2). For off-line EPI geometric distortion correction, b0 field maps were constructed from two gradient-echo images acquired using different echo times (TE = 4.62 ms and 7.08 ms; TR = 700 ms, flip angle = 90°, 64 slices, no gap, voxel size = 2.0 × 2.0 × 2.0 mm, FOV = 256 mm).
The longitudinal study began on a Siemens 3 T Trio scanner, which was upgraded to a Tim Trio after follow-up data collection was initiated. Scanner status at follow-up is entered as a covariate in all reported analyses. Continued assessment of the initial sample, at two year intervals, is ongoing in our laboratory.
T1 weighted images were corrected for distortions caused by gradient nonlinearity and then submitted to the standard longitudinal processing pipeline in the FreeSurfer software suite (v4.5.0, http://surfer.nmr.mgh.harvard.edu). Procedures are described in detail in publications by the FreeSurfer group (44-57). Briefly, to extract reliable volume and thickness estimates across repeated MRI measurements, T1 weighted images were processed longitudinally in FreeSurfer (54), beginning with the construction of an unbiased within-subject template space and image using robust, inverse consistent registration (56). Several processing steps in the standard FreeSurfer pipeline, such as skull stripping, Talairach transforms, atlas registration as well as spherical surface maps and parcellations are then initialized with common information from the within-subject template, significantly increasing reliability and statistical power (54).
The standard FreeSurfer pipeline itself includes removal of non-brain tissue using a hybrid watershed/surface deformation procedure (58), automated Talairach transformation, segmentation of the subcortical white matter and deep gray matter volumetric structures including hippocampus, amygdala, caudate, putamen, and ventricles (49,50), intensity normalization (59), tessellation of the gray/white matter boundary, automated topology correction (48,57), and surface deformation following intensity gradients to place optimally the gray/white and gray/cerebrospinal fluid borders at the locations where the greatest shifts in intensity define the transitions between tissue classes (45-47). Once the cortical models were complete, a number of deformable procedures were performed including surface inflation (51), registration to a spherical atlas that utilized individual cortical folding patterns to match cortical geometry across subjects (52), parcellation of the cerebral cortex into units based on gyral and sulcal structure (53,60), and creation of a variety of surface based data maps. All automatically generated volumes and maps were inspected visually for accuracy, and manual corrections using FreeSurfer tools were carried out as needed.
Cortical thickness and white matter extent
We performed statistical analysis on two types of surface based data maps, cortical thickness and white matter extent. FreeSurfer calculates cortical thickness as the closest distance from the grey/white boundary to the grey/CSF boundary at each vertex on the tessellated surface (47). White matter extent is measured by the jacobian of the spherical transform derived during atlas registration and reflects the amount of distortion needed to warp individual participant’s white matter maps into register with the common atlas. Difference maps for cortical thickness and white matter extent were created by subtracting each participant’s follow-up map from his/her baseline map, then smoothed at 10 mm FWHM prior to statistical analysis. FreeSurfer’s mri_glmfit program was used to perform general linear model (GLM) analysis of relations between cortical thickness or white matter extent difference maps and non-brain variables. To maintain proper statistical control over family-wise error in the mapping analysis, GLM effects were thresholded with reference to Monte Carlo–style simulations (10,000 iterations) using the FreeSurfer program mri_surfcluster under the assumption that the statistical output was z-distributed. These simulations provided estimates of the size of map vertex clusters expected 5% of the time or less if the GLM were performed on sets of random data with the same dimensions as our observed data sets, i.e., cluster-size thresholds corresponding to alpha values of p < =0.05 for two-tailed tests.
White matter fractional anisotropy and mean diffusivity
For the diffusion MRI data, the diffusion tensor was computed using the Diffusion Toolbox (FDT) from the FMRIB software library, (61–63; FSL, v.4.0.1, http://www.fmrib.ox.ac.uk). Each diffusion weighted volume was aligned to the b0 image using an affine transformation to correct for the distortions caused by eddy currents (64). The entire diffusion series was corrected for geometric distortion caused by magnetic field inhomogeneity using FMRIB’s Utility for Geometrically Unwarping EPIs (FUGUE) in conjunction with the b0 field maps. The diffusion tensor was derived from the b0 image and the twelve aligned, distortion corrected diffusion weighted images. Fractional anisotropy (FA) and mean diffusivity (MD) images were created from the diffusion tensor eigenvalues. FSL’s tract-based spatial statistics (TBSS) program was used to align the FA and MD images so that voxelwise statistical analysis could be performed between time points and across participants.
In this processing step, all FA maps were aligned to a common space template using the nonlinear registration IRTK (65; www.doc.ic.ac.uk/~dr/software). The template was an average FA volume constructed from 72 participants drawn from our full research sample, aligned to 2 mm isotropic MNI voxel space. The 72 diffusion volumes were chosen to sample the adolescent age range evenly and with balanced sex ratios, while selecting only participants who had high quality diffusion scans from the perspective of intersubject registration (symmetrical anatomy, normal ventricular size, no cysts, minimal scanning artifacts, good signal-to-noise ratios, etc.). See reference (66) for further details. MD maps were aligned to common space by applying the transformation matrices previously computed during the FA map alignments. FA maps were masked at a threshold of FA = 0.2 to reduce partial volume effects, and the same voxel masks were applied to MD maps.
Next, FA and MD difference maps were created by subtracting each participant’s follow-up map from his/her baseline map, then smoothed at 4 mm FWHM prior to statistical analysis.
SPM8 (www.fil.ion.ucl.ac.uk/spm/software/spm8) was used to perform GLM analysis of relations between FA and MD difference maps and non-brain variables, with cluster-level statistical thresholding of effects maintained at family-wise p < = 0.05 according to corrections derived from random field theory (67).
Statistical approach
Demographic data as well as behavioral characteristics related to externalizing and personality traits were compared between groups using analyses of covariance at baseline to verify that trait differences would not confound interpretation of potential alcohol-related differences observed at follow-up. Personality trait domains were also examined at follow-up to determine whether experience with alcohol altered aspects of self-reported behavioral control.
Trajectories of brain development across the two-year follow-up interval were compared between adolescents who remained alcohol free from baseline to Time 2 and those who began to use alcohol during the follow-up interval. Whole-brain cortical thickness, white matter extent, fractional anisotrophy and mean diffusivity were examined. For these analyses, age at initial enrollment, sex, scanner status (upgrade or not at Time 2), and the time interval between assessments were entered as nuisance covariates.
Results
Demographic and behavioral distinctions between non-users and alcohol initiators
Tables 1 and 2 present baseline demographic comparisons of non-users versus initiators. As indicated, the initiator group was very slightly but not significantly older at baseline. The groups are matched on estimated IQ scores, sex distribution, ethnicities, background socioeconomic indicators as well as self-reported externalizing. The sample is largely Caucasian and from middle to upper-middle class backgrounds as reflected by parental education (college-level) and family incomes (see Table 1). At baseline, future alcohol initiators reported marginally higher levels of MPQ Aggression (a facet of Negative Emotionality and a second-order facet of Constraint) as well as significantly lower levels of Traditionalism (see Table 2). Otherwise, the groups were indistinct in terms of major trait domains of personality.
Table 2.
Personality trait scores between alcohol initiators and non-initiators at baseline.
| Variable | Non-initiators | Initiators | F | p |
|
|
|---|---|---|---|---|---|---|
| Positive emotionality | 74.4 (16.7) | 72.0 (12.7) | 0.94 | 0.34 | 0.02 | |
| Well-being | 8.3 (4.0) | 8.4 (2.8) | 0.32 | 0.57 | 0.01 | |
| Achievement | 7.1 (2.4) | 7.1 (3.3) | 0.02 | 0.90 | 0.00 | |
| Social closeness | 9.8 (3.1) | 9.6 (2.4) | 0.25 | 0.62 | 0.01 | |
| Social potency | 6.8 (3.2) | 5.7 (3.2) | 1.6 | 0.22 | 0.04 | |
| Negative emotionality | 33.4 (14.5) | 33.8 (15.4) | 0.89 | 0.35 | 0.02 | |
| Stress reactivity | 3.2 (2.7) | 4.1 (3.0) | 2.05 | 0.16 | 0.05 | |
| Alienation | 2.5 (2.2) | 1.7 (2.2) | 0.48 | 0.49 | 0.01 | |
| Aggression | 2.4 (2.9) | 3.0 (3.4) | 3.4 | 0.07 | 0.08 | |
| Constraint | 76.6 (14.8) | 71.9 (15.3) | 1.6 | 0.21 | 0.04 | |
| Control | 8.8 (2.8) | 8.4 (3.6) | 0.52 | 0.48 | 0.01 | |
| Harm avoidance | 6.7 (3.2) | 6.1 (3.4) | 0.12 | 0.73 | 0.00 | |
| Traditionalism | 7.1 (2.8) | 5.7 (2.3) | 3.9 | 0.05 | 0.09 |
Values represent raw scores means and standard deviations (in parentheses). Group comparisons were assessed covarying age and sex as detailed in the text; effect sizes are represented by partial eta-squared values ( ). Total scores possible for each scale are as follows: Well-being: 14; Social Potency: 14; Achievement: 12; Social Closeness: 12: Stress Reactivity: 15; Alienation: 13; Aggression: 12; Control: 13; Harm Avoidance: 12; Traditionalism: 12.
At the follow-up assessment (after the onset of drinking behavior in the initiator group), the groups continued to differ in Traditionalism (data available upon request). The Control scale (a facet of behavioral Constraint) was marginally lower (p = 0.09) in the initiator group, suggesting a tendency toward more impulsive behavior. The Control scale does not include items related to substance use.
The group of alcohol initiators exhibited no or relatively low use of other substances at follow-up. Some participants reported experience with marijuana but at levels that fell short of regular use.
Cortical thickness: developmental changes in non-users versus initiators
Significant differences between non-users and initiators in two-year cortical thickness change were observed in a single cluster centered on the middle frontal gyrus of the right hemisphere (see Table 3 and Figure 1). Two-year cortical thickness changes were more positive (that is, slightly increasing) in the non-users and negative in the initiators. No significant differences in cortical thickness were observed between the groups at baseline.
Table 3.
Cluster information from whole-brain mapping analysis of T1 and diffusion weighted MRI. All results are from the group contrast of non-initators > initiators. Maximum t statistic value, Talairach xyz coordinates, and region labels are given for cluster peaks;
| Hemisphere | Measure | Max t-stat | Cluster Size | CWP | X | Y | Z | Anatomical region |
|---|---|---|---|---|---|---|---|---|
| Right | Cortical thickness | 3.54 | 1227 mm2 | 0.006 | 24 | 26 | 34 | Middle frontal gyrus |
| Right | White matter volume | 5.47 | 1059 mm2 | 0.002 | 58 | 0 | 24 | Precentral gyrus |
| Right | White matter volume | 4.38 | 806 mm2 | 0.012 | 4 | −69 | 5 | Lingual gyrus |
| Right | White matter volume | 3.62 | 734 mm2 | 0.022 | 66 | −34 | −6 | Middle temporal gyrus |
| Right | White matter volume | 4.18 | 715 mm2 | 0.026 | 11 | −9 | 40 | Cingulate gyrus |
| Left | FA | 4.51 | 2344 mm3 | 0.021 | −6 | 16 | −8 | Dorsal caudate |
| Right | FA | 4.32 | 2080 mm3 | 0.039 | 32 | 0 | −22 | Inferior fronto-occiptal fasciculus |
CWP=cluster-wise probability.
Figure 1.
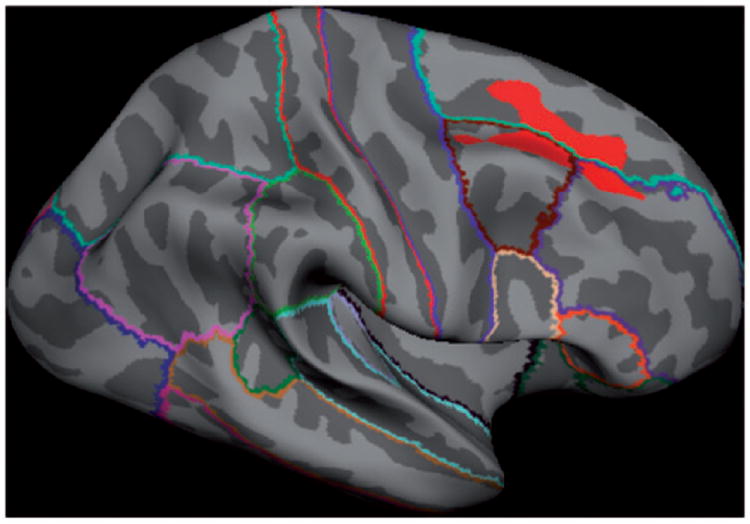
Two-year change in cortical thickness in non-users versus alcohol use initiators. Initiators have accelerated rates of loss of cortical thickness relative to non-users in the right middle frontal gyrus (red region reflects significant group contrast of non-initiators > initiators).
White matter extent: developmental changes in non-users versus initiators
Four regions in the right hemisphere showed significant group differences in two-year change in cortical white matter extent (see Table 3 and Figure 2). Two-year white matter changes were greater in non-users versus initiators such that non-users showed increasing white matter over time relative to initiators. On the lateral surface, one white matter cluster was located toward the far lateral aspect of the precentral gyrus, but also extended into lateral borders of the precentral and supramarginal regions. The other lateral cluster was located in white matter along the central portion of the middle temporal gyrus. On the medial surface, an anterior cluster extended along the posterior two-thirds of the white matter associated with the superior frontal gyrus, while a posterior cluster was located along the caudal portion of the lingual gyrus. No significant differences in white matter volume were observed between groups at baseline.
Figure 2.
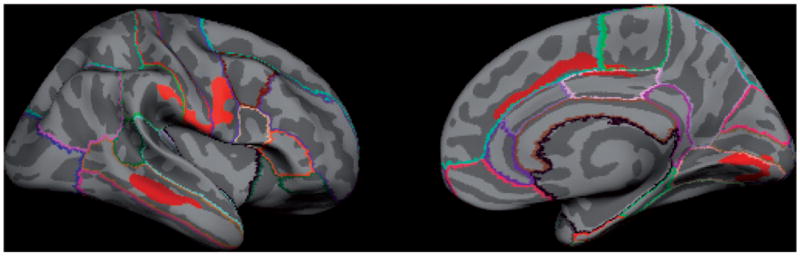
Two-year change in cortical white matter volume in non-users versus alcohol use initiators. Non-users have greater increases in white matter volumes over time in the right hemisphere precentral gyrus, lingual gyrus, middle temporal gyrus and anterior cingulate cortex relative to alcohol use initiators (red regions reflect significant group contrast of non-initiators > initiators).
DTI indices of connectivity: developmental changes in non-users versus initiators
Significant differences between non-users and initiators in two-year FA change were observed in two voxel clusters (Table 3 and Figure 3). For both clusters, the non-users had greater FA increases than initiators over the two year follow-up interval. One cluster was located in the left hemisphere along the dorsal portion of the caudate and extending toward the thalamus. The other cluster was located in the right hemisphere along the mid-temporal to polar-temporal regions of the inferior fronto-occipital fasciulus (IFOF), extending anteriorly to the junction of the IFOF and the uncinate fasciculus. No clusters were found that indicated a greater FA increases in the initiator group. Non-users did not differ in FA from initiators at baseline. To clarify the nature of the FA changes in the two significant clusters, mean radial and axial diffusivity values were extracted within each cluster. In the non-user group, both clusters demonstrated a greater decrease in radial versus axial diffusivity over the two year follow-up, consistent with increased fiber myelination (68), a pattern that was not evident for the initiator group. However, these are only descriptive trends; radial and axial changes were not statistically significant for either group. No significant clusters were obtained from either baseline or two-year change analyses of mean diffusivity.
Figure 3.
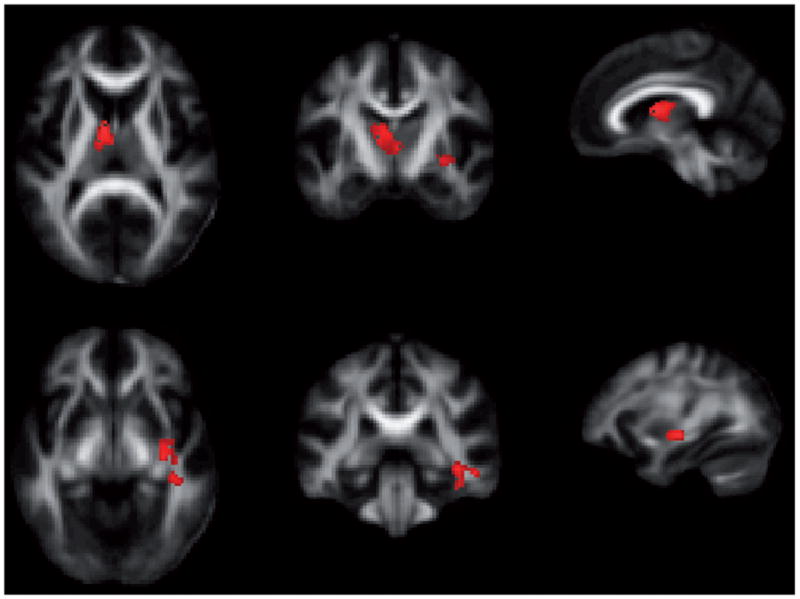
Two-year change in fractional anisotropy in non-users versus alcohol use initiators. Upper row: cluster with peak near dorsal caudate in left hemisphere. Lower row: cluster with peak in mid-temporal/polar-temporal region of inferior fronto-occipital fasciculus in right hemisphere. Non-users show relative increases in FA over time in these regions relative to alcohol use initiators (red regions reflect significant group contrast of non-initiators > initiators).
Discussion
This study is unique as it provides the opportunity to examine brain-based changes as a function of alcohol use initiation in the context of a longitudinal design where baseline use is absent, and premorbid characteristics are highly similar between non-users and initiators. Overall, findings cohere with an increasing body of evidence that normative developmental changes in cortical thickness, white matter extent, and white matter microstructure are impacted by the initiation of alcohol use in the mid-to-late adolescent period. Participants in the current study reported that they initiated regular alcohol use, typically in peer-related social contexts, between the ages of 17 and 18 on average. As indicated through many recent studies of adolescent brain development, mid-adolescence is an active phase of brain development characterized primarily by increases in white matter as well as evidence of microstructural changes in the directional organization of white matter, particularly in circuits that link the striatum and limbic regions with the frontal lobe (19,20,22). In contrast, although declines in cortical gray matter as well as cortical thickness are also observed, these changes are maximal early in adolescence with much more subtle changes thereafter. Thus, we hypothesized that if alcohol functions as a neurotoxin when ingested in small to moderate quantities during middle-to-later adolescence, its effects might be more readily observed in relation to indices of white matter extent and organization versus gray matter volumes or cortical thickness, because developmental changes in the latter tissue types have largely stabilized prior to use onset.
Across a one-to-two-year period of active use, initiators demonstrated a greater-than-expected decline in cortical thickness in the right hemisphere middle frontal gyral region. The expected pattern is for this area to show evidence of pruning (operationalized as loss of gray matter volume or decreasing cortical thickness) with increasing age. The middle frontal gyrus is part of the cognitive control network that subserves inhibitory control (69), working memory, particularly for spatial information (70), and episodic memory retrieval (71). Indeed, it is a region with numerous links to executive processing, particularly under conditions of high demand (72). The middle frontal gyrus shows both structural (73) and functional (74) changes as a consequence of fetal alcohol exposure in human children, adolescents and young adults as well as in adolescents with positive family histories of alcohol abuse (75). The relative decline in cortical thickness observed in the current study is consistent with these findings as well as with the observed correlation between decreased prefrontal gray matter volumes and heightened drinking behavior in adolescents with substance use disorders (76). Similarly, Medina et al. (30) reported lower prefrontal gray matter volumes in adolescents with heavy alcohol use relative to controls, but this pattern was observed only in females and in the context of a cross-sectional comparison. Given that cortical thickness did not differ between groups at baseline, our findings suggest that alcohol use in relatively small quantities may result in neurotoxic changes in neuronal structure within the middle frontal region, providing a substrate for potential later difficulties with impulse control and executive dysfunction.
These findings are paralleled by intriguing patterns of personality trait expression at baseline and follow-up. There was a stable tendency to challenge social conventions in the initiator group (relative to non-drinkers), which persisted over time, and was accompanied only after the onset of alcohol use by marginally declining levels of self-reported behavioral control. This decline could reflect the observed changes in the middle frontal region. It should be emphasized, though, that our analysis of personality trait dimensions did not correct for multiple comparisons. Thus, these positive findings should be interpreted with caution and may not reflect true group differences.
Findings related to white matter extent and microstructure further support the idea that alcohol acts as a neurotoxin in the context of adolescent brain development. Most studies of alcohol effects on white matter have not reported changes in white matter volumes (7). We found that cortical white matter extent, particularly in right hemisphere regions associated with motor function (precentral gyrus), complex visual processing/visual integration (lingual gyrus), recognition memory (middle temporal gyrus) and conflict monitoring/cognitive control (anterior cingulate cortex) failed to show the expected rate of increase over time in alcohol initiators. These relative developmental distinctions between groups cohere with other findings regarding the integrity of major fiber tracts in adolescent alcohol users. Work in this area is sparse to date. The few current studies of alcohol effects on brain white matter in human adolescent samples have reported decreased fractional anisotropy and/or increased mean diffusivity throughout the brain. McQueeney et al. (31) reported that binge-drinking adolescents, as compared to controls, had significantly lower FA values in 18 brain regions, including multiple areas of the corpus callosum, the superior longitudinal fasciculus, the corona radiate, portions of the internal and external capsules, and cerebellum. Age and sex were apparently not controlled in these analyses. Bava et al. (32) reported upon a larger group (that may have overlapped with the McQueeney sample), finding that combined alcohol and marijuana users had lower FA in 10 fiber tracts. Within the same lab, Jacobus et al. (29) reported that adolescent binge drinkers without concomitant marijuana use had significantly lower FA values in eight brain regions, including the superior longitudinal fasciculus. Given that these studies were cross-sectional, cause-effect associations cannot be determined. A more recent study by Bava et al. (77) followed heavy alcohol plus marijuana using adolescents versus those with less significant use over an 18-month period. At follow-up, the substance use group exhibited lower FA values in seven fiber tracts, including the superior longitudinal fasciculus, thalamic fibers and the corona radiata. Notably, higher mean diffusivity in the superior longitudinal fasciculus was associated with more alcohol use during the longitudinal testing interval. However, the substance users were not free of use at the initial assessment, complicating interpretation relative to premorbid characteristics.
The current sample did not have concomitant use of other substances, nor did they report the same degree of binge drinking as participants in the above-mentioned studies. Our findings of relatively decreased development of white matter microstructure in the left dorsal caudate/thalamic region as well as the right hemisphere’s inferior fronto-occipital fasciculus suggest that adolescent alcohol use even in smaller quantities has the potential to impact circuitry that is important for behavioral regulation, attention, and executive function given that these regions are important hubs for various information-processing functions.
Several limitations must be mentioned to place these findings in the appropriate context. First, due to the nature of the parent study from which the current participants were drawn, the sample sizes reported herein are small. Moreover, the sample is largely Caucasian and does not represent lower SES backgrounds. Although the patterns reported here cohere well with the existing literature, replication and extension within larger, more representative, samples, across a broader age range, and across multiple years of longitudinal assessment is needed. We are in the midst of data collection to pursue those aims.
A second limitation concerns the age range of the sample at study enrollment. Within the full study cohort, baseline ages ranged from 9 to 23, which is a broad range within which to consider issues related specifically to adolescent substance use. This report focuses only on individuals who were at or above the age of 14 years at baseline and around the age of 16 or older at follow-up, given that alcohol use is virtually nonexistent before that time. The youngest members of our initial baseline cohort are now reaching mid-adolescence when they are expected to initiate use. As these data become available, techniques such as linear mixed modeling and structural equation modeling can be applied to the data to examine more precisely the hypotheses suggested by the current findings.
Third, the study incorporated a user-defined template for normalization within the DTI analyses. Although this procedure is one of several recommended for use with TBSS, the pattern of findings may have differed had we used the standard FMRIB58_FA standard-space image or had we created a template based on only the 55 participants in the current study. The current strategy reduces potential normalization errors through the use of an age-appropriate template and by eliminating the potential for nuisance variance in comparing findings across studies (see 66 for an example) published from our laboratory.
In addition, we have not addressed dose-response associations in the current analysis. Such associations are needed to clarify alcohol’s role as a potential neurotoxin. It would be expected that not all use patterns are equivalent and that greater exposure will result in more pronounced developmental anomalies.
Moreover, it is a weakness of the study that we did not assess alcohol use patterns at more frequent time intervals; recent work suggests that text messaging or other technologies might represent reliable means of capturing variations in use at more frequent intervals (78). More frequent behavioral assessment could be accompanied by equally frequent assessments of brain structure. Recent studies (79) indicate that longitudinal MRI assessment using robust registration methods is sensitive in detecting regional brain changes over a relatively brief retest interval (7 months) in adolescence. Thus, the use of shorter retest intervals in longitudinal developmental studies may permit dynamic changes in brain structure to be readily observed as they occur through typical adolescence, allowing deviations from the norm as a consequence of substance use to be more precisely identified as they occur.
Finally, a fundamental hypothesis that guides our work is that age-by-use interactions will be present. Neurodevelopment is more pronounced earlier versus later in the adolescent period (15,16,20). Thus, it is expected that neural circuitry will be most impacted in individuals who initiate use earlier versus later in the typical developmental course. We expect to be able to examine, with subsequent assessment waves, how the timing of initiation impacts the status of this circuitry in young adulthood after the adolescent-limited use has abated. This is important because adolescent alcohol use is widespread and the extent to which brain structure normalizes with abstinence is unclear (7). None of the participants in this study were diagnosed with alcohol dependence at the follow-up assessment, and few met formal diagnostic criteria for alcohol abuse. Their self-reported use patterns are similar to what might be described as “typical” for the United States adolescent population. As suggested here by emerging differences in self-reported behavioral control over time in alcohol use initiators, those impacts are likely to be neurodevelopmental but also behavioral. Behavioral effects associated with subclinical patterns of substance use are often subtle in late adolescence or young adulthood, because these periods are recognized as times of relatively enhanced cognitive reserve. Future analyses will examine microstructural properties of white matter in more detail to assess the impact of alcohol use on myelination. Although we did not find differences between groups in radial versus axial diffusivity, we expect that such differences may emerge with continued follow-up of alcohol users. Thus, an ongoing goal of our work is to characterize longer-term neurocognitive and affective development as a function of the timing of alcohol use initiation in adolescence.
In summary, the strength of the current study lies in the ability to prospectively characterize impacts of alcohol use in a low-risk non-using (at baseline) sample. Given the sample’s low-risk nature, the findings reported here are compelling in suggesting that patterns of cortical and subcortical connectivity are developmentally altered as a function of subclinical levels of alcohol use, perhaps leading to later disruptions in behavioral control.
Acknowledgments
This work was supported by grants DA017843 and AA020033 awarded to Monica Luciana by the National Institutes of Health. The present study was also supported by BTRC grants awarded to the Center for Magnetic Resonance Research, P41 RR008079, P41 EB015894, and 1P30 NS076408 as well as by the Minnesota Supercomputing Institute. The authors alone are responsible for the content and writing of this article.
Footnotes
Declaration of interest
The authors report no conflicts of interest.
References
- 1.Pfefferbaum A, Adalsteinsson E, Sullivan E. Dysmorphology and microstructural degradation of the corpus callosum: interaction of age and alcoholism. Neurobiol Aging. 2006;27:994–1009. doi: 10.1016/j.neurobiolaging.2005.05.007. [DOI] [PubMed] [Google Scholar]
- 2.Oscar-Berman M, Marinkovic K. Alcohol: effects on neurobehavioral functions and the brain. Neuropsychol Rev. 2007;17:239–257. doi: 10.1007/s11065-007-9038-6. [DOI] [PMC free article] [PubMed] [Google Scholar]
- 3.Robbins TW, Ersche KD, Everitt BJ. Drug addiction and the memory systems of the brain. Ann N Y Acad Sci. 2008;1141:1–21. doi: 10.1196/annals.1441.020. [DOI] [PubMed] [Google Scholar]
- 4.Pfefferbaum A, Lim KO, Zipursky RB, Mathalon DH, Rosenbloom MJ, Lane B, Ha CN, Sullivan EV. Brain gray and white matter volume loss accelerates with aging in chronic alcoholics: a quantitative MRI study. Alcoholism: Clin Experiment Res. 1992;16:1078–1089. doi: 10.1111/j.1530-0277.1992.tb00702.x. [DOI] [PubMed] [Google Scholar]
- 5.Streissguth AP, Landesman-Dwyer S, Martin JC, Smith DW. Teratogenic effects of alcohol in humans and laboratory animals. Science. 1980;209:353–361. doi: 10.1126/science.6992275. [DOI] [PubMed] [Google Scholar]
- 6.Buhler M, Mann K. Alcohol and the human brain: a systematic review of different neuroimaging methods. Alcoholism: Clin Experiment Res. 2011;35:1771–1793. doi: 10.1111/j.1530-0277.2011.01540.x. [DOI] [PubMed] [Google Scholar]
- 7.Elofson J, Gongvatana W, Carey KB. Alcohol use and cerebral white matter compromise in adolescence. Addict Behav. 2013;38:2295–2305. doi: 10.1016/j.addbeh.2013.03.001. [DOI] [PMC free article] [PubMed] [Google Scholar]
- 8.Wozniak J, Muetzel R. What does diffusion tensor imaging reveal about the brain and cognition in fetal alcohol spectrum disorders? Neuropsychol Rev. 2011;21:133–147. doi: 10.1007/s11065-011-9162-1. [DOI] [PubMed] [Google Scholar]
- 9.Liu I, Chiu C, Chen C, Kuo L, Lo Y, Tseng W. The microstructural integrity of the corpus callosum and associated impulsivity in alcohol dependence: a tractography-based segmentation study using diffusion spectrum imaging. Psychiatric Res: Neuroimaging. 2010;184:128–134. doi: 10.1016/j.pscychresns.2010.07.002. [DOI] [PubMed] [Google Scholar]
- 10.Pfefferbaum A, Sullivan E, Adalsteinsson E, Lim K, Moseley M. In vivo detection and functional correlates of white matter microstructural disruption in chronic alcoholism. Alcoholism: Clin Experiment Res. 2000;24:1214–1221. [PubMed] [Google Scholar]
- 11.Ruiz SM, Oscar-Berman M, Sawyer KS, Valmas MM, Urban T, Harris GJ. Drinking history associations with regional white matter volumes in alcoholic men and women. Alcoholism: Clin Experiment Res. 2013;37:110–122. doi: 10.1111/j.1530-0277.2012.01862.x. [DOI] [PMC free article] [PubMed] [Google Scholar]
- 12.Wozniak JR, Muetzel RL, Mueller BA, McGee CL, Freerks MA, Ward EE, Nelson ML, et al. Microstructural corpus callosum anomalies in children with prenatal alcohol exposure: an extension of previous diffusion tensor imaging findings. Alcoholism: Clin Experiment Res. 2009;33:1825–1835. doi: 10.1111/j.1530-0277.2009.01021.x. [DOI] [PMC free article] [PubMed] [Google Scholar]
- 13.Konrad A, Vucurevic G, Lorscheider M, Bernow N, Thummel M, Chai C, Pfeifer P, et al. Broad disruption of brain white matter microstructure and relationship with neuropsychological performance in male patients with severe alcohol dependence. Alcohol Alcoholism. 2012;47:118–126. doi: 10.1093/alcalc/agr157. [DOI] [PubMed] [Google Scholar]
- 14.Clark DB, Thatcher DL, Tapert SF. Alcohol, psychological dysregulation, and adolescent brain development. Alcoholism: Clin Experiment Res. 2008;32:375–385. doi: 10.1111/j.1530-0277.2007.00601.x. [DOI] [PubMed] [Google Scholar]
- 15.Giedd JN, Blumenthal J, Jeffries NO, Castellanos FX, Liu H, Zijdenbos A, Paus T, et al. Brain development during childhood and adolescence: a longitudinal MRI study. Nat Neurosci. 1999;2:861–3. doi: 10.1038/13158. [DOI] [PubMed] [Google Scholar]
- 16.Sowell ER, Thompson PM, Tessner KD, Toga AW. Mapping continued brain growth and gray matter density reduction in dorsal frontal cortex: Inverse relationships during postadolescent brain maturation. J Neurosci. 2001;21:8819–8829. doi: 10.1523/JNEUROSCI.21-22-08819.2001. [DOI] [PMC free article] [PubMed] [Google Scholar]
- 17.Paus T, Zijdenbos A, Worsley K, Collins DL, Blumenthal J, Giedd JN, Rapoport JL, Evans AC. Structural maturation of neural pathways in children and adolescents: an in vivo study. Science. 1999;283:1908–1911. doi: 10.1126/science.283.5409.1908. [DOI] [PubMed] [Google Scholar]
- 18.Nagel BJ, Medina KL, Yoshii J, Schweinsburg AD, Moadab I, Tapert SF. Age-related changes in prefrontal white matter volume across adolescence. Neuroreport. 2006;17:1427–1431. doi: 10.1097/01.wnr.0000233099.97784.45. [DOI] [PMC free article] [PubMed] [Google Scholar]
- 19.Asato M, Terwilliger R, Woo J, Luna B. White matter development in adolescents: a DTI study. Cerebral Cortex. 2010;20:2122–2131. doi: 10.1093/cercor/bhp282. [DOI] [PMC free article] [PubMed] [Google Scholar]
- 20.Lebel C, Gee M, Camicioli R, Wieler M, Martin W, Beaulieu C. Diffusion tensor imaging of white matter tract evolution over the lifespan. NeuroImage. 2012;60:340–352. doi: 10.1016/j.neuroimage.2011.11.094. [DOI] [PubMed] [Google Scholar]
- 21.Peters B, Szeszko P, Radua J, Ikuta T, Gruner P, DeRosse P, Zhang JP, et al. White matter development in adolescence: diffusion tensor imaging and meta- analytic results. Schizophrenia Bull. 2012;38:1308–1317. doi: 10.1093/schbul/sbs054. [DOI] [PMC free article] [PubMed] [Google Scholar]
- 22.Hwang K, Velanova K, Luna B. Strengthening of top-down frontal cognitive control networks underlying the development of inhibitory control: a functional magnetic resonance imaging effective connectivity study. J Neurosci. 2010;30:15535–15545. doi: 10.1523/JNEUROSCI.2825-10.2010. [DOI] [PMC free article] [PubMed] [Google Scholar]
- 23.Adeyi G, Chen CM, Williams GD, Faden VB. Trends in underage drinking in the United States, 1991-2005. Surveillance Report #81. Bethesda, MD: National Institute on Alcohol Abuse and Alcoholism, Division of Epidemiology and Prevention Research; Oct, 2007. [Google Scholar]
- 24.Substance Abuse and Mental Health Services Administration. Results from the 2010 National Survey on Drug Use and Health: summary of national findings, NSDUH Series H-41, HHS Publication No (SMA) 11-4658. Rockville, MD: Substance Abuse and Mental Health Services Administration; 2011. [Google Scholar]
- 25.Johnston LD, O’Malley PM, Bachman JG, Schulenberg JE. Monitoring the future national results on adolescent drug use: overview of key findings. Ann Arbor, MI: Ann Arbor Institute for Social Research, The University of Michigan; 2011. [Google Scholar]
- 26.Lubman DI, Yucel M, Hall WD. Substance use and the adolescent brain: a toxic combination? J Psychopharmacol. 2007;21:792–794. doi: 10.1177/0269881107078309. [DOI] [PubMed] [Google Scholar]
- 27.DeBellis MD, Clark DB, Beers SR, Soloff PH, Boring AM, Hall J, Kersh A, Keshavan MS. Hippocampal volume in adolescent-onset alcohol use disorders. Am J Psychiatry. 2000;137:737–744. doi: 10.1176/appi.ajp.157.5.737. [DOI] [PubMed] [Google Scholar]
- 28.De Bellis MD, Van Voorhees E, Hooper SR, Gibler N, Nelson L, Hege SG, Payne ME, MacFall J. Diffusion tensor measures of the corpus callosum in adolescents with adolescent onset alcohol use disorders. Alcoholism: Clin Experiment Res. 2008;32:395–404. doi: 10.1111/j.1530-0277.2007.00603.x. [DOI] [PMC free article] [PubMed] [Google Scholar]
- 29.Jacobus J, McQueeny T, Bava S, Schweinsburg B, Frank L, Yang T, Tapert SF. White matter integrity in adolescents with histories of marijuana use and binge drinking. Neurotoxicol Teratol. 2009;31:349–355. doi: 10.1016/j.ntt.2009.07.006. [DOI] [PMC free article] [PubMed] [Google Scholar]
- 30.Medina KL, McQueeny T, Nagel BJ, Hanson KL, Schweinsburg AD, Tapert SF. Prefrontal cortex volumes in adolescents with alcohol use disorders: unique gender effects. Alcoholism: Clin Experiment Res. 2008;32:386–394. doi: 10.1111/j.1530-0277.2007.00602.x. [DOI] [PMC free article] [PubMed] [Google Scholar]
- 31.McQueeny T, Schweinsburg BC, Schweinsburg AD, Jacobus J, Bava S, Frank LR, Tapert SF. Altered white matter integrity in adolescent binge drinkers. Alcoholism: Clin Experiment Res. 2009;33:1278–1285. doi: 10.1111/j.1530-0277.2009.00953.x. [DOI] [PMC free article] [PubMed] [Google Scholar]
- 32.Bava S, Frank L, McQueeny T, Schweinsburg B, Schweinsburg A, Tapert S. Altered white matter microstructure in adolescent substance users. Psychiatry Res: Neuroimaging. 2009;173:228–237. doi: 10.1016/j.pscychresns.2009.04.005. [DOI] [PMC free article] [PubMed] [Google Scholar]
- 33.Nagel BJ, Schweinsburg AD, Phan V, Tapert SF. Reduced hippocampal volume among adolescents with alcohol use disorders without psychiatric comorbidity. Psychiatry Res. 2005;139:181–190. doi: 10.1016/j.pscychresns.2005.05.008. [DOI] [PMC free article] [PubMed] [Google Scholar]
- 34.Venkatasubramanian G, Anthony G, Reddy US, Reddy VV, Jayakumar PN, Benegal V. Corpus callosum abnormalities associated with greater externalizing behaviors in subjects at high risk for alcohol dependence. Psychiatry Res: Neuroimaging. 2007;156:209–215. doi: 10.1016/j.pscychresns.2006.12.010. [DOI] [PubMed] [Google Scholar]
- 35.Windle M, Spear LP, Fuligni AJ, Angold A, Brown JD, Pine D, Smith GT, et al. Transitions into underage and problem drinking: Developmental processes and mechanisms between 10 and 15 years of age. Pediatrics. 2008;121:S273–S289. doi: 10.1542/peds.2007-2243C. [DOI] [PMC free article] [PubMed] [Google Scholar]
- 36.Wrase J, Makris N, Braus DF, Mann K, Smolka MN, Kennedy DN, Caviness VS, et al. Amygdala volume associated with alcohol abuse relapse and craving. Am J Psychiatry. 2008;165:1179–1184. doi: 10.1176/appi.ajp.2008.07121877. [DOI] [PubMed] [Google Scholar]
- 37.Granö N, Virtanen M, Vahtera J, Elovainio M, Kivimäki M. Impulsivity as a predictor ofsmoking and alcohol consumption. Pers Individual Diff. 2004;37:1693–1700. [Google Scholar]
- 38.Oldfield RC. The assessment and analysis of handedness: The Edinburgh inventory. Neuropsychologia. 1971;9:97–113. doi: 10.1016/0028-3932(71)90067-4. [DOI] [PubMed] [Google Scholar]
- 39.Wechsler D. Manual for the Wechsler Abbreviated Scale of Intelligence. San Antonio, TX: Psychological Corporation; 1999. [Google Scholar]
- 40.Kaufman J, Birmaher B, Brent D, Rao U, Flynn C, Moreci P, Williamson D, Ryan N. Schedule for Affective Disorders and Schizophrenia for School-Age Children – Present and Lifetime Version (K-SADS-PL): Initial reliability and validity data. J Am Acad Child Adolescent Psychiatry. 1997;36:980–988. doi: 10.1097/00004583-199707000-00021. [DOI] [PubMed] [Google Scholar]
- 41.Achenbach TM. Manual for the Child Behavior Checklist/4-18 and 1991 Profile. Burlington, VT: University of Vermont Department of Psychiatry; 1991. [Google Scholar]
- 42.Patrick C, Curtin J, Tellegen A. Development and validation of a brief form of the Multidimensional Personality Questionnaire. Psychol Assess. 2002;14:150–163. doi: 10.1037//1040-3590.14.2.150. [DOI] [PubMed] [Google Scholar]
- 43.Winters KC, Henly GA. Personal Experience Inventory (PEI) Test and Manual. Los Angeles, CA: Western Psychological Services; 1999. [Google Scholar]
- 44.Jovicich J, Czanner S, Greve D, Haley E, van der Kouwe A, Gollub R, Kennedy D, et al. Reliability in multi-site structural MRI studies: effects of gradient non-linearity correction on phantom and human data. NeuroImage. 2006;30:436–443. doi: 10.1016/j.neuroimage.2005.09.046. [DOI] [PubMed] [Google Scholar]
- 45.Dale AM, Sereno MI. Improved localization of cortical activity by combining EEG and MEG with MRI cortical surface reconstruction: a linear approach. J Cognitive Neurosci. 1993;5:162–176. doi: 10.1162/jocn.1993.5.2.162. [DOI] [PubMed] [Google Scholar]
- 46.Dale AM, Fischl B, Sereno MI. Cortical surface-based analysis. I. Segmentation and surface reconstruction. NeuroImage. 1999;9:179–194. doi: 10.1006/nimg.1998.0395. [DOI] [PubMed] [Google Scholar]
- 47.Fischl B, Dale AM. Measuring the thickness of the human cerebral cortex from magnetic resonance images. Proc Nat Acad Sci USA. 2000;97:11050–11055. doi: 10.1073/pnas.200033797. [DOI] [PMC free article] [PubMed] [Google Scholar]
- 48.Fischl B, Liu A, Dale AM. Automated manifold surgery: constructing geometrically accurate and topologically correct models of the human cerebral cortex. IEEE Transactions Medi Imag. 2001;20:70–80. doi: 10.1109/42.906426. [DOI] [PubMed] [Google Scholar]
- 49.Fischl B, Salat DH, Busa E, Albert M, Dieterich M, Haselgrove C, van der Kouwe A, et al. Whole brain segmentation: automated labeling of neuroanatomical structures in the human brain. Neuron. 2002;33:341–355. doi: 10.1016/s0896-6273(02)00569-x. [DOI] [PubMed] [Google Scholar]
- 50.Fischl B, Salat DH, van der Kouwe AJ, Makris N, Segonne F, Quinn BT, Dale AM. Sequence-independent segmentation of magnetic resonance images. NeuroImage. 2004a;23:S69–84. doi: 10.1016/j.neuroimage.2004.07.016. [DOI] [PubMed] [Google Scholar]
- 51.Fischl B, Sereno MI, Dale AM. Cortical surface-based analysis. II: Inflation, flattening, and a surface-based coordinate system. NeuroImage. 1999;9:195–207. doi: 10.1006/nimg.1998.0396. [DOI] [PubMed] [Google Scholar]
- 52.Fischl B, Sereno MI, Tootell RB, Dale AM. High-resolution intersubject averaging and a coordinate system for the cortical surface. Human Brain Mapping. 1999;8:272–284. doi: 10.1002/(SICI)1097-0193(1999)8:4<272::AID-HBM10>3.0.CO;2-4. [DOI] [PMC free article] [PubMed] [Google Scholar]
- 53.Fischl B, van der Kouwe A, Destrieux C, Halgren E, Segonne F, Salat DH, Busa E, et al. Automatically parcellating the human cerebral cortex. Cerebral Cortex. 2004b;14:11–22. doi: 10.1093/cercor/bhg087. [DOI] [PubMed] [Google Scholar]
- 54.Reuter M, Schmansky NJ, Rosas HD, Fischl B. Within-subject template estimation for unbiased longitudinal image analysis. NeuroImage. 2012;61:1402–1418. doi: 10.1016/j.neuroimage.2012.02.084. [DOI] [PMC free article] [PubMed] [Google Scholar]
- 55.Reuter M, Fischl B. Avoiding asymmetry-induced bias in longitudinal image processing. NeuroImage. 2011;57:19–21. doi: 10.1016/j.neuroimage.2011.02.076. [DOI] [PMC free article] [PubMed] [Google Scholar]
- 56.Reuter M, Rosas HD, Fischl B. Highly accurate inverse consistent registration: a robust approach. NeuroImage. 2010;53:1181–1196. doi: 10.1016/j.neuroimage.2010.07.020. [DOI] [PMC free article] [PubMed] [Google Scholar]
- 57.Segonne F, Pacheco J, Fischl B. Geometrically accurate topology-correction of cortical surfaces using nonseparating loops. IEEE Transactions Med Imag. 2007;26:518–529. doi: 10.1109/TMI.2006.887364. [DOI] [PubMed] [Google Scholar]
- 58.Segonne F, Dale AM, Busa E, Glessner M, Salat D, Hahn HK, Fischl B. A hybrid approach to the skull stripping problem in MRI. NeuroImage. 2004;22:1060–1075. doi: 10.1016/j.neuroimage.2004.03.032. [DOI] [PubMed] [Google Scholar]
- 59.Sled JG, Zijdenbos AP, Evans AC. A nonparametric method for automatic correction of intensity nonuniformity in MRI data. IEEE Transactions Med Imag. 1998;17:87–97. doi: 10.1109/42.668698. [DOI] [PubMed] [Google Scholar]
- 60.Desikan RS, Segonne F, Fischl B, Quinn BT, Dickerson BC, Blacker D, Buckner RL, et al. An automated labeling system for subdividing the human cerebral cortex on MRI scans into gyral based regions of interest. NeuroImage. 2006;31:968–980. doi: 10.1016/j.neuroimage.2006.01.021. [DOI] [PubMed] [Google Scholar]
- 61.Smith SM, Jenkinson M, Woolrich MW, Beckmann CF, Behrens TEJ, Johansen-Berg H, Bannister PR, et al. Advances in functional and structural MR image analysis and implementation as FSL. NeuroImage. 2004;23:208–219. doi: 10.1016/j.neuroimage.2004.07.051. [DOI] [PubMed] [Google Scholar]
- 62.Woolrich MW, Jbabdi S, Patenaude B, Chappell M, Makni S, Behrens T, Beckmann C, et al. Bayesian analysis of neuroimaging data in FSL. NeuroImage. 2009;45:S173–86. doi: 10.1016/j.neuroimage.2008.10.055. [DOI] [PubMed] [Google Scholar]
- 63.Jenkinson M, Beckmann CF, Behrens TE, Woolrich MW, Smith SM. FSL. NeuroImage. 2012;62:782–790. doi: 10.1016/j.neuroimage.2011.09.015. [DOI] [PubMed] [Google Scholar]
- 64.Haselgrove JC, Moore JR. Correction for distortion of echo-planar images used to calculate the apparent diffusion coefficient. Magnet Resonance Med. 1996;36:960–964. doi: 10.1002/mrm.1910360620. [DOI] [PubMed] [Google Scholar]
- 65.Rueckert D, Sonoda LI, Hayes C, Hill DLG, Leach MO, Hawkes DJ. Non-rigid registration using free-form deformations: application to breast MR images. IEEE Transactions Med Imag. 1999;18:712–721. doi: 10.1109/42.796284. [DOI] [PubMed] [Google Scholar]
- 66.Olson EA, Collins PF, Hooper CJ, Muetzel R, Lim KO, Luciana M. White matter integrity predicts delay discounting behavior in 9- to 23-year-olds: a diffusion tensor imaging study. J Cogn Neurosci. 2009;21:1406–1421. doi: 10.1162/jocn.2009.21107. [DOI] [PMC free article] [PubMed] [Google Scholar]
- 67.Worsley KJ, Marrett S, Neelin P, Evans AC. A three-dimensional statistical analysis for CBF activation studies in human brain. J Cerebral Blood Flow Metab. 1992;12:900–918. doi: 10.1038/jcbfm.1992.127. [DOI] [PubMed] [Google Scholar]
- 68.Song SK, Sun SW, Ramsbottom MJ, Chang C, Russell J, Cross AH. Dysmyelination revealed through MRI as increased radial (but unchanged axial) diffusion of water. Neuroimage. 2002;17:1429–1436. doi: 10.1006/nimg.2002.1267. [DOI] [PubMed] [Google Scholar]
- 69.Aron AR, Fletcher PC, Bullmore ET, Sahakian BJ, Robbins TW. Stop-signal inhibition disrupted by damage to right inferior frontal gyrus in humans. Nat Neurosci. 2003;6:115–116. doi: 10.1038/nn1003. [DOI] [PubMed] [Google Scholar]
- 70.Leung HC, Gore JC, Goldman-Rakic PS. Sustained mnemonic response in the human middle frontal gyrus during online storage of spatial memoranda. J Cogn Neurosci. 2002;14:659–671. doi: 10.1162/08989290260045882. [DOI] [PubMed] [Google Scholar]
- 71.Rajah MN, Languay R, Grady CL. Age-related changes in right middle frontal gyrus volume correlate with altered episodic retrieval activity. J Neurosci. 2011;31:17941–17954. doi: 10.1523/JNEUROSCI.1690-11.2011. [DOI] [PMC free article] [PubMed] [Google Scholar]
- 72.Banich MT. Executive function: the search for a integrated account. Curr Direct Psychol Sci. 2009;18:89–94. [Google Scholar]
- 73.Zhou D, Lebel C, Lepage C, Rasmussen C, Evans A, Wyper K, Pei J, et al. Developmental cortical thinning in fetal alcohol spectrum disorders. Neuroimage. 2011;58:16–25. doi: 10.1016/j.neuroimage.2011.06.026. [DOI] [PubMed] [Google Scholar]
- 74.Norman AL, O’Brien JW, Spadoni AD, Tapert SF, Jones KL, Riley EP, Mattson SN. A functional magnetic resonance imaging study of spatial working memory in children with prenatal alcohol exposure: contribution of familial history of alcohol use disorders. Alcoholism: Clin Experiment Res. 2012;37:132–140. doi: 10.1111/j.1530-0277.2012.01880.x. [DOI] [PMC free article] [PubMed] [Google Scholar]
- 75.Silveri MM, Rogowska J, McCaffrey A, Yurgelun-Todd DA. Adolescents at risk for alcohol abuse demonstrate altered frontal lobe activation during Stroop performance. Alcoholism: Clin Experiment Res. 2011;35:218–228. doi: 10.1111/j.1530-0277.2010.01337.x. [DOI] [PMC free article] [PubMed] [Google Scholar]
- 76.De Bellis MD, Narasimhan A, Thatcher DL, Keshavan MS, Soloff P, Clark DB. Prefrontal cortex, thalamus and cerebellar volumes in adolescents and young adults with adolescent onset alcohol use disorders and co-morbid mental disorders. Alcoholism: Clin Experiment Res. 2005;29:1590–1600. doi: 10.1097/01.alc.0000179368.87886.76. [DOI] [PubMed] [Google Scholar]
- 77.Bava S, Jacobus J, Thayer R, Tapert S. Longitudinal changes in white matter integrity among adolescent substance users. Alcoholism: Clin Experiment Res. 2013;37:E181–E189. doi: 10.1111/j.1530-0277.2012.01920.x. [DOI] [PMC free article] [PubMed] [Google Scholar]
- 78.Thayer RE, Hutchison KE. Improving accuracy of adolescents’ substance use reports via text messaging. Addiction. 2012;107:1015–1016. doi: 10.1111/j.1360-0443.2011.03768.x. [DOI] [PubMed] [Google Scholar]
- 79.Sullivan EV, Pfefferbaum A, Rohlfing T, Baker FC, Padilla ML, Colrain IM. Developmental change in regional brain structure over 7 months in early adolescence: comparison of approaches for longitudinal atlas-based parcellation. Neuroimage. 2001;57:214–224. doi: 10.1016/j.neuroimage.2011.04.003. [DOI] [PMC free article] [PubMed] [Google Scholar]