

Abstract
As part of a larger organizational study, we sought to survey biobanks in the United States. However, we encountered two problems with this population. First, no common definition of biobanks exists. Second, no census is available of these facilities from which to sample in order to implement a survey. In light of these problems, we employed a multifaceted approach using electronic searches of PubMed, RePORTER, and Google. In addition, we systematically searched for biobanks housed within universities that have NIH-designated Clinical and Translational Science Awards (CTSA). We expanded this part of the search by looking for biobanks among all members of the American Association of Medical Colleges (AAMC). Finally, we added banks to our database found previously by other researchers and banks found via correspondence with our colleagues. Our search strategy produced a database of 624 biobanks for which we were able to confirm contact information in order to conduct our online survey. Another 140 biobanks were identified but did not respond to our requests to confirm their existence or contact information. In order to maximize both the uniqueness of banks found and the greatest return on effort for each search, we suggest targeting resources that are already organized. In our work, these included the CTSA, AAMC, and part of the Google searches. We contend that our search provides a model for analysis of new fields of research and/or rapidly evolving industries. Furthermore, our approach demonstrates that with the appropriate tools it is possible to develop a systematic and comprehensive database to investigate undefined populations.
Introduction
The proliferation of large-scale genomic and gene–environment studies has increasingly relied on “biobanks” to collect, store, and oversee the distribution of specimens and data. Often supplanting traditional researcher–participant relationships, these organizations work to enhance biomedical research as they balance the interests of specimen and data contributors, researchers, and other stakeholders. In response to the dearth of empirical data on biobank policies and governance structures, our research team undertook an organizational study of biobanks in the United States, funded by the National Human Genome Research Institute (NHGRI). We conducted in-depth case studies of selected biobanks in the United States, constructed a database of biobanks, and administered an online survey.
The ultimate goal for survey research is to draw a representative sample of a study population. In the case of biobanks, however, two immediate problems posed significant barriers to accomplishing this goal. We describe these problems, the measures we took to address them, and offer recommendations for other researchers working with similarly undefined and rapidly evolving populations.
The first problem is one of naming/identification. A variety of entities with many different names collect and store biological specimens.1–3 For example, “biobank,” “biorepository,” “specimen bank/repository,” and “tissue bank/repository” are just some of the terms used to describe these entities. We use the term “biobank” in this article. We also limited the scope of our search and our use of the term “biobank” to our research interests: organizations that acquire and store genetically identifiable human biospecimens and associated data for future research and sharing purposes. Examples of biobanks include: (1) commercial entities that sell and/or collect specimens; (2) university-based collections, including research cores; (3) small collections, created by an investigator or group of investigators whose ongoing research uses stored specimens; (4) government-funded or facilitated networks that house centralized specimen repositories; and (5) nonprofit disease advocacy organizations that store samples relating to a specific condition or population. These examples are neither exhaustive nor mutually exclusive.
The second problem is the lack of a reliable biobank census. Whatever term is used, the total number of biobanks is unknown. In the late 1990s, RAND researchers attempted to catalog collections of stored tissue specimens (not biobanks per se). They conservatively estimated that over 307 million specimens from more than 178 million cases were stored in the United States.4 Since the RAND study, tissue collections and biobanks have proliferated in many settings, further complicating any census or comprehensive list from which to sample. Thus, to accomplish our research goals, we needed to develop a strategy for cataloging these heterogeneous entities with no agreed-upon definition or known census.
Methods
Given the problems noted above, we adopted a multifaceted approach similar to that employed by RAND to build a database of US biobanks. RAND began with a literature review for information on tissue and DNA banks; searched NIH's CRISP database (now named RePORTER), RAND's proprietary RaDiUS database, and the Internet; and used communication with knowledgeable sources.4
Using search terms that included all names commonly used for biobanks, we conducted a systematic search of articles listed in PubMed for the year 2010; a search of abstracts of currently funded federal grants from NIH's RePORTER database for 2010; and a systematic Google search which included both initial and follow-up searches of lists and directories of biobanks appearing in the initial search. In addition, because a significant portion of medical research is sponsored by medical institutions and research institutes, and more recently by NIH-sponsored Clinical and Translational Science Awards (CTSAs), we conducted searches on American Association of Medical Colleges (AAMC) member websites and on CTSA websites. Lastly, personal communication with other investigators provided information about additional US biobanks.
Search procedures
PubMed and NIH RePORTER searches
The PubMed and NIH RePORTER searches began with keyword finds using the nested Boolean strings described in Table 1. We constructed the search strings to account for the fact that some terms imply the storage of specimens (e.g., “biorepository”) while other terms do not (e.g., “collection”). We included genomic criteria in our search strings because our survey was specifically interested in the use of biobanks to facilitate genomic research.
Table 1.
PubMed and NIH RePORTER Nested Boolean Search Strings
| First Disjunctive Nesting Level |
| (Bank String)=bank* OR biobank* OR repositor* OR biorepositor* |
| (Collection String)=collection* OR registr* OR database* OR databank* |
| (Specimen String)=specimen* OR biospecimen* OR sample* OR biosample* OR tissue* OR blood* |
| (Genomic String)=genom* OR gene* OR genetic* or DNA OR sequence* |
| Second Conjunctive Nesting Level |
| (A String)=(Bank String) AND (Genomic String) |
| (B String)=(Collection String) AND (Specimen String) AND (Genomic String) |
| Final Disjunctive Nesting Level =(A String) OR (B String) |
While NIH RePORTER now accepts nested Boolean search strings, at the time of our search (2010), it did not. NIH RePORTER also does not allow for the export of more than 15,000 records at one time. To circumvent these obstacles, we rearranged the nested Boolean strings into groups that (1) allowed for use of a single Boolean operator per search, and (2) returned results in batches of less than 15,000. This required splitting the disjunctive “genomic string” and conjunctively distributing it across other strings in multiple searches. It also required including some grants by comparing some results for overlap by their unique database ID numbers, as well as removing some duplicate results. The end result was logically equivalent to using the final nested Boolean string described in Table 1.
The PubMed keyword find was conducted in February 2011, applied to titles and abstracts, and limited to articles published in English in 2010; it resulted in 1126 “hits.” The NIH RePORTER keyword find was conducted in December 2010, applied to titles and abstracts and scientific terms, and limited to active projects during fiscal year 2010; it resulted in 3333 “hits.” A total of 4459 abstracts resulted from these “hits.”
All PubMed and RePORTER abstracts were systematically reviewed for content mentioning the use, management, or creation of any biobank. A software program highlighted all terms from the “Bank String” and “Collection String” in Table 1 so that abstracts only using those terms in ways not relevant to biobanking could be excluded (e.g., “World Bank”). Because of our research interests, we excluded abstracts that only discussed nonhuman specimens or specimens kept outside the US. Any cases not specific about the kind of specimens or location of storage were included.
Biobanks were only recorded for the study if they were mentioned by a proper name, or if it was clear from context they were specifically associated with an organization or study with a proper name. An example of an abstract citing a properly named biobank includes “[Specimens] were successfully genotyped in 9483 samples accrued over 4 months into BioVU, the Vanderbilt University Medical Center DNA biobank.”5 Some abstracts only mentioned banked specimens associated with an organization, for example, “…histologically normal nontumor brain specimens…were obtained from the University of Iowa Hospital.”6 If banked specimens were only mentioned generally in a PubMed abstract, we searched the full-text article using the same methods and criteria described above, for example, “…single nucleotide polymorphisms were investigated through in vitro (53 human livers from primarily White donors) and in vivo (26 mainly White or African-American volunteers)…”7 Because we did not have access to the full text of the grants, if banked specimens were only mentioned generally in an NIH RePORTER abstract, we did not record the bank.
Google™ searches
The Google search involved two steps. In the first step, called “Google Direct”, keywords were searched using the Google search engine. Because Google search results are vast in number with ranking dependent on word order, and synonyms and word variations are automatically included, we did not use the same search strategy as with PubMed and NIH RePORTER. Instead we conducted six Google searches, each using one of the following phrases: (1) biobank, (2) biorepository, (3) specimen bank, (4) specimen repository, (5) tissue bank, and (6) tissue repository. For each search, the first 100 “hits” were retrieved and results combined into a single list with duplicates culled by URL, resulting in a total of 518 page hits. We set Google to return 100 hits per page, but it returned a few more per page. The combined total was 641 hits across the 6 searches. 123 duplicates were culled resulting in the final total of 518 page hits.
These web pages were reviewed via the same methods and criteria used for the PubMed and NIH RePORTER abstracts. Google searches did not include genomic search string terms because we did not want to exclude biobanks that failed to mention on their websites that they facilitated genomic research. (This holds true for AAMC and CTSA searches, described below.)
Many web pages did not describe a single biobank but served as a listing or directory of biobanks. This led to the second search, called the “Google Lists.” Any web page that listed 3 or more apparent biobanks was added to a list of lists to be reviewed as well. This resulted in 31 lists, with an average of 34.5 items per list. Most of these lists contained URL links to further descriptions of a biobank. These web pages were reviewed further using the same methods and criteria described above. In cases where only a proper name of a biobank was listed with no URL link or a broken URL link, we searched for the proper name of the bank using Google and reviewed the first five hits for mention of that bank.
AAMC and CTSA searches
Each member website of the AAMC member list (137 U.S. Medical Institutions)8 was searched for biobanks using the terms “bank,” “repositor,” “collection,” “registr,” “databa,” “specimen,” or “sample.” We also employed a Google™ search combining the institution's name and the following terms: “Biobank” OR “Specimen Bank” OR “Tissue Bank” OR “DNA Bank” OR “Biorepository” OR “Specimen Repository” OR “Tissue Repository” OR “DNA Repository.”
Using a listing of the then-NIH-awarded CTSAs at 60 universities,9 we searched each CTSA website for direct links to biobanks using the terms “core facilities” or “resources: Core.” If a biobank website was not found, the CTSA site was searched using the following terms: “repository”, “biorepository”, “tissue bank”, and “specimen storage.”
Previous research and personal correspondence
Professor Susan Wolf and colleagues at the University of Minnesota shared a list of biobanks identified by searching NIH websites and Google collected for a separate research study led by Gina Johnson and colleagues.10 This information was treated similar to a list found using Google, using the inclusion criteria noted above.
Throughout the database development process, we obtained the names of biobanks from personal communications, similar to the RAND study. For example, we contacted CTSA Clinical Research Ethics Core members who comprised a “biobank working group” to obtain additional referrals for biobanks at CTSA institutions. However, since we did not explicitly search for these banks, we do not include them in the results section.
Results
Our search strategy produced a database of 624 biobanks for which we were able to confirm contact information for recruitment to the online survey. Another 140 biobanks were identified but did not respond to our requests to confirm their existence or obtain contact information.
Table 2 shows the search results. The column labeled “Effort” displays the total number of possible sources of biobanks, or “hits,” for each type of search conducted. Since all of the medical school websites in the US, all CTSAs, and the list of biobank names identified by Johnson and colleagues. were searched, we provide estimates for effort for those searches. The total number of biobanks found in each search is listed in the column labeled “# Banks Responding.” For example, 1126 PubMed articles identified by the search produced 56 total biobanks (i.e., confirmed as existing and having contact information). The column labeled “Sensitivity,” or the # of Banks divided by the Effort, represents a “return on investment” for each search. Thus, return on investment from the PubMed search is 5%, or 56/1126.
Table 2.
Results from Multifaceted Search Strategy
| Source | Effort* | Banks** | Sensitivity (Banks/ Effort) | Unique Banks | Unique/ Banks in Search | Unique/ All Banks | Unique/ Effort |
|---|---|---|---|---|---|---|---|
| PubMed | 1126 | 56 | 5% | 18 | 32% | 3% | 2% |
| NIH RePORTER | 3300 | 197 | 6% | 68 | 35% | 11% | 2% |
| Google Direct | 518 | 173 | 33% | 33 | 19% | 5% | 6% |
| Google Lists | 1100 | 327 | 30% | 135 | 41% | 22% | 12% |
| CTSA Search*** | 300 | 57 | 19% | 25 | 44% | 4% | 8% |
| AAMC Search**** | 685 | 200 | 29% | 78 | 39% | 13% | 11% |
| Johnson Study | 115 | 78 | 68% | 9 | 12% | 1% | 8% |
| All Sources | 7144 | 624 | 9% | 366 | 59% | 59% | 5% |
Effort is roughly equal to things searched (article abstracts, grants abstracts, single web pages).
“Banks” includes only those contacted and confirmed as biobanks.
Estimate from 60 CTSA universities × 5 pages per university.
Estimate from 137 medical institutions × 5 pages per institutions.
The “# Unique Banks” column in Table 2 denotes the number of unique biobanks for each search. The column entitled “Unique Banks in Search” represents the number of unique banks divided by the number of banks responding, as a percent, for each search. Continuing with the PubMed example, this search provided 18 unique banks, or 32 percent of all banks identified (18/56). The column entitled “Unique Banks/All Banks” denotes the total number of banks found for that entity divided by the total of all banks (624); for PubMed, this is 3% (18/624).
The final column in Table 2, labeled “Unique/Effort,” represents the number of unique biobanks found for each search divided by the total number of banks; for PubMed, this is 2% (18/1126).
Examining the data in Table 2 shows that the PubMed and RePORTER searches produced 18 and 68 unique banks, respectively. The sensitivity or return on investment of these searches was the lowest of all the searches while requiring the greatest effort. However, the uniqueness of the banks found within each of the searches denoted in the column “Unique Banks in Search” is relatively high in comparison to other searches.
The Google searches provided over 150 unique banks for our database. These searches had a high degree of sensitivity, but differ with percent uniqueness of each search. That the “Google Lists” had a higher percent unique for each search is not surprising given these searches included already-organized lists of entities that would likely fit our definition of a biobank.
The AAMC and CTSA searches added significantly to our database with over 100 unique banks and the highest uniqueness for each search and relatively high sensitivity. These results are also not surprising given the propensity to find biobanks in academic settings. Conversely, the Johnson study provided high sensitivity, but low uniqueness and percent unique for this search. This is likely due to our diligence in looking for academic and government biobanks in other searches.
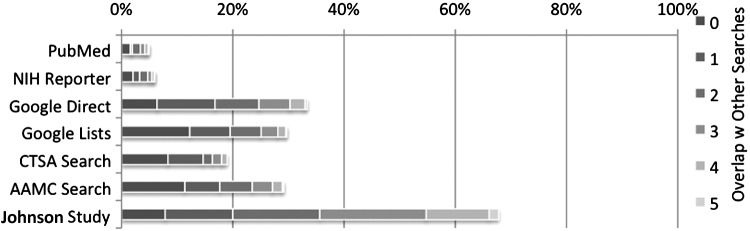
Figures 1 and 2 provide a visual representation of the uniqueness of each search and the degree of overlap with other searches. Figure 1, the analog of the “# Unique Banks” column in Table 2, shows the overlap between the searches where the darkest part of each bar represents the unique banks (no overlap) of that individual search. The increasingly lighter segments show banks found by one other search, two other searches, and so on up to five other searches. Figure 2 shows the same information as a percentage, the analog of the “Unique Banks in Search” column in Table 2. Again, the darkest, furthest left part of each bar denotes banks found only using that particular search.
FIG. 1.
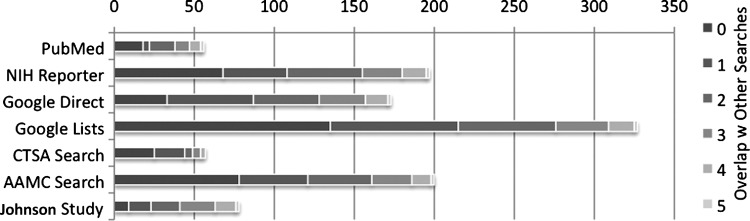
Banks and overlap between searches.
FIG. 2.

Banks/Sum for that search.
In Figure 3, the darkest, furthest left part of each bar denotes the same data as the “Unique/Effort” column of Table 2. The remainder of each bar in Figure 3 represents the percentage of the overlap for each search with other searches. For the “Google Direct” search, approximately 11% of biobanks found with this search overlapped with one other search (58/500). (The tables with counts used to create Figures 1, 2, and 3 are included in Appendix A).
FIG. 3.
Banks/Effort for that search.
Figure 4 plots the relationship between sensitivity and uniqueness. As sensitivity increases, uniqueness also increases up to approximately 45%.
FIG. 4.

Percent unique in each search vs. sensitivity.
Discussion
Two problems persist in identifying a population of biobanks to survey. To address the naming problem, we used a wide variety of keywords in our searches. Those keywords were read in context in the abstracts and webpages. Ultimately, if the information found online was ambiguous, the people associated with the collection were contacted and asked if the collection was a biobank by our definition. To address the fact that there is no reliable census, we used multiple search strategies, and carefully recorded the sources and cross-referenced for overlap so that we could both identify duplicates and identify the strengths and weaknesses of different sources.
Our results suggest that if one hopes to maximize both uniqueness and sensitivity, one would want to target searches found in the upper, right-hand quadrant of Figure 4. None of our searches met this goal. However, the Google List, AAMC, and CTSA searches came the closest. The searches were likely so productive because they tap resources that are already organized to find or display biobanks. The other searches produced biobanks, but had lower levels of sensitivity and uniqueness. The sensitivity measure might be biased downward for the PubMed and RePORTER searches because of the effort/work for both. The Johnson Study search was highly sensitive but not unique, given the types of organizations included in this and the AAMC, CTSA, and Google searches. The Google Direct search fell somewhat outside the relationship, but was still relatively sensitive and unique.
It is important to note that a positive relationship persisted between effort and uniqueness. Putting more effort into searches provided us with biobanks that we might not have found otherwise and might have skewed our sample to one particular kind (academic, commercial, government, nonprofit) of biobank. While overlap occurs, our diligence in searching PubMed, RePORTER, and Google for possible biobanks provided us with a diversity of organizations to survey. In fact, as Table 2 shows, over half of all biobanks in our database (366/624) were found by only one search.
While we were rewarded with greater effort, the two Google searches provided over 500 banks. The CTSA and AAMC searches provided over 250 banks. Thus, if time is a limiting factor, using already-organized and/or easy to obtain resources for searches might provide an adequate list. However, such a list may have limited diversity given the types of resources used.
Strategies for future research include narrowing the search for specific diseases, enlarging the search to include more years, tracking government investment in biobanks, and/or increasing the search breadth. These strategies and their respective applications, listed in Table 3, can be used by biobank researchers to network and collaborate with their peers.
Table 3.
Strategies and Applications for Future Work
| Strategy | Application |
|---|---|
| 1. More Specificity The search strategy could be tailored for specific diseases, conditions, and populations. |
Adding Boolean strings for specifics such as “prostate cancer”, “metabolic syndrome”, and/or “African American” to our search would narrow the search based on the investigator's interest. |
| 2. Additional Years/Track Over Time More years can be added to the search in order to understand the growth/change of biobanks over time. |
Repeating our PubMed and RePORTER search strategies for additional years would provide a window to the growth of biobanks over time. The remaining searches would be done at predetermined time intervals. This strategy could be added to strategy number 1. |
| 3. Track Government Investment in Biobanks The search strategy could be tailored to look specifically at government resources over time. |
By using RePORTER, public investment in biobanks could be tracked. This strategy could be combined with strategies 1 and/or 2 above. |
| 4. Greater Breadth Our search parameters could be changed to include nonhuman specimens and/or specimens not housed in the U.S. |
Instead of excluding non-human and/or non-U.S. specimens, one could easily include such specimens in a search. Thus, one would rely on Google and PubMed, and less on RePORTER, CTSA, and AAMC. This strategy could be combined with any or all of the above strategies. |
Limitations
Each search had limitations. The PubMed and RePORTER searches were limited to 2010, likely missing more recently established biobanks. Furthermore, it was limited to information from a published article or grant abstract. Some articles did not mention a biobank specifically and/or were vague about the use of specimens. Grant abstracts could also be vague and were occasionally missing entirely. In addition, because the RePORTER and CTSA searches are tied to NIH funding, these searches may have missed biobanks that do not receive such funding.
The Google search had several limitations. The terms for the Google search were not identical to those for the PubMed and RePORTER searches. Furthermore, Google disallowed strict search parameters. Google is not a static resource; a search done on a given day will be different than the same search performed on a subsequent day.
With regard to the CTSA and AAMC searches, there is no standardized way to list biobanks or to display or advertise ongoing research on a website. Certain facilities may be biobanks, but not captured in our search due to unclear descriptions. This lack of uniformity likely means that these searches missed biobanks that were not displayed through university websites. Thus, we were limited to the information available on the respective websites at the time of our search.
These limitations were addressed by combining different search strategies, and through seeking additional bank names from experts and those involved with the development of biobanks. In addition, our procedures for recording details about each biobank allowed us to check for overlap within and across searches. This approach produces data that can be used to address inevitable selection biases.
Appendix A: Counts for Figures 1, 2, and 3
Appendix Table A1.
Counts for Figure 1
| Overlap with Other Searches | |||||||
|---|---|---|---|---|---|---|---|
| 0 | 1 | 2 | 3 | 4 | 5 | Sum | |
| PubMed | 18 | 4 | 16 | 9 | 7 | 2 | 56 |
| NIH RePORTER | 68 | 40 | 47 | 25 | 15 | 2 | 197 |
| Google Direct | 33 | 54 | 41 | 29 | 14 | 2 | 173 |
| Google Lists | 135 | 80 | 61 | 33 | 16 | 2 | 327 |
| CTSA Search | 25 | 19 | 5 | 5 | 3 | 0 | 57 |
| AAMC Search | 78 | 43 | 40 | 25 | 12 | 2 | 200 |
| Johnson Study | 9 | 14 | 18 | 22 | 13 | 2 | 78 |
Numbers in Table are (Banks).
Appendix Table A2.
Counts for Figure 2
| Overlap with Other Searches | |||||||
|---|---|---|---|---|---|---|---|
| 0 | 1 | 2 | 3 | 4 | 5 | Sum | |
| PubMed | 32% | 7% | 29% | 16% | 13% | 4% | 100% |
| NIH RePORTER | 35% | 20% | 24% | 13% | 8% | 1% | 100% |
| Google Direct | 19% | 31% | 24% | 17% | 8% | 1% | 100% |
| Google Lists | 41% | 24% | 19% | 10% | 5% | 1% | 100% |
| CTSA Search | 44% | 33% | 9% | 9% | 5% | 0% | 100% |
| AAMC Search | 39% | 22% | 20% | 13% | 6% | 1% | 100% |
| Johnson Study | 12% | 18% | 23% | 28% | 17% | 3% | 100% |
Percentages in Table are (Banks)/(Sum for that Search).
Appendix Table A3.
Counts for Figure 3
| Overlap with Other Searches | ||||||||
|---|---|---|---|---|---|---|---|---|
| 0 | 1 | 2 | 3 | 4 | 5 | Sum | Effort* | |
| PubMed | 1.6% | 0.4% | 1.4% | 0.8% | 0.6% | 0.2% | 5% | 1126 |
| NIH RePORTER | 2.1% | 1.2% | 1.4% | 0.8% | 0.5% | 0.1% | 6% | 3300 |
| Google Direct | 6.4% | 10.4% | 7.9% | 5.6% | 2.7% | 0.4% | 33% | 518 |
| Google Lists | 12.3% | 7.3% | 5.5% | 3.0% | 1.5% | 0.2% | 30% | 1100 |
| CTSA Search | 8.3% | 6.3% | 1.7% | 1.7% | 1.0% | 0.0% | 19% | 300** |
| AAMC Search | 11.4% | 6.3% | 5.8% | 3.6% | 1.8% | 0.3% | 29% | 685*** |
| Johnson Study | 7.8% | 12.2% | 15.7% | 19.1% | 11.3% | 1.7% | 68% | 115 |
Effort is roughly equal to things searched (article abstracts, grants abstracts, single web pages).
Estimate from 60 CTSA universities×5 pages per university.
Estimate from 137 medical institutions×5 pages per institution.
Acknowledgments
The authors wish to thank Kelle Basta, Ian Conlon, Mark Cornell, Maria Hobbs, Kriste Kuczynski, Jennifer Lewis, Marsha Michie, Anders Nelson, and Erik Reavely for their help in constructing the database. We would also like to thank Kurt Ribisl for his feedback and Rene Sterling for originating the approach. Funding for this project was provided by NIH Grant 1R01HG005227-01A1, “From Specimen to Biobank: Using An Organizational Perspective to Study ELSI Issues,” and the UNC Center for Genomics and Society 1P50 HG004488-01. Additional funding was provided by a supplement to the UNC CTSA grant U54RR024382-01A1, “Enhancing Biobank Capacities Across CTSAs”. Last, we are grateful to our colleagues Susan Wolf, Frances Lawrenz, Gina Johnson, and Mao Thao for their contributions to our database, from NIH award 2R01HG003178, “Managing Incidental Findings and Research Results in Genomic Biobanks & Archives.” This research was partially supported by a grant awarded to the UNC Institute on Aging by the National Institute on Aging (NIA) Pre-Doctoral/Post-Doctoral Traineeship, Grant No. 5T32AG000272.
Author Disclosure Statement
There are no known conflicts of financial interest.
References
- 1.Pálsson G. Anthropology and the New Genetics. New York: Cambridge University Press; 2007. [Google Scholar]
- 2.Kaye J. Do we need a uniform regulatory system for biobanks across Europe? Eur J Hum Genet. 2006;14:245–248. doi: 10.1038/sj.ejhg.5201530. [DOI] [PubMed] [Google Scholar]
- 3.Watson PH. Barnes RO. Proposed schema for classifying human research biobanks. Biopreserv Biobank. 2011;9:327–333. doi: 10.1089/bio.2011.0020. [DOI] [PubMed] [Google Scholar]
- 4.Eiseman E. Haga S. Handbook of Human Tissue Sources: A National Resource of Human Tissue Samples. Santa Monica: RAND; 1999. [Google Scholar]
- 5.Ritchie MD. Denny JC. Crawford DC, et al. Robust replication of genotypye-phenotype associations across multiple diseases in an electronic medical record. Am J of Hum Genet. 2010;86:560–572. doi: 10.1016/j.ajhg.2010.03.003. [DOI] [PMC free article] [PubMed] [Google Scholar]
- 6.Lin BA. Madan JG. Yoon X, et al. Massively parallel signature sequencing and bioinformatics analysis identifies up-regulation of TGFBI and SOX4 in human glioblastoma. PLos One. 2010;19:e10210. doi: 10.1371/journal.pone.0010210. [DOI] [PMC free article] [PubMed] [Google Scholar]
- 7.Oleson L. von Moltke LL. Greenblatt DJ, et al. Identification of polymorphisms in the 3′ –untranslated region of the human pregnane X receptor (PXR) gene associated with variability in cytochrome P450 3A (CYP3A) metabolism. Xenobiotica. 2010;40:146–162. doi: 10.3109/00498250903420243. [DOI] [PMC free article] [PubMed] [Google Scholar]
- 8.Association of American Medical Colleges.[www.aamc.org. ] Member Communities[Cited 2012 November 16] https://members.aamc.org/eweb/DynamicPage.aspx?site=webcode=AAMCOrgSearchResult&orgtype=Medical%20School https://members.aamc.org/eweb/DynamicPage.aspx?site=webcode=AAMCOrgSearchResult&orgtype=Medical%20School
- 9.Clinical, Translational Science Awards [www.ctsaweb.org. ] “Clinical, Translational Science Awards” [November 16, 2012] http://www.ctsacentral.org/institutions http://www.ctsacentral.org/institutions
- 10.Johnson G. Lawrenz F. Thao M. An empirical examination of the management of the return of individual research results and incidental findings in genomic biobanks. Genet in Med. 2012;14:444–450. doi: 10.1038/gim.2012.20. [DOI] [PubMed] [Google Scholar]