Abstract
Background
Vitamin D deficiency is common in patients with Crohn’s disease (CD), although whether this impairs immune responsiveness, and is related to disease activity per se, remains unclear. We sought to investigate vitamin D pathways in patients with CD according to measures of inflammation and immune response.
Methods
Prospectively collected samples of a well-characterized cohort of patients with CD were used to measure serum 25(OH)-vitamin D levels by enzyme-linked immunoassay. Related gene expression was determined by polymerase chain reaction in T cells. The effect of vitamin D on the proliferation of isolated CD4+ cells was determined.
Results
Patients with active CD had lower serum vitamin D levels than those in clinical remission; this measurement was independent of season or reported use of vitamin D supplements. Harvey–Bradshaw Index scores, but not C-reactive protein, correlated with serum vitamin D levels. Gene expression of the vitamin D receptor was higher in peripheral blood T cells from patients with active disease than in those in remission. The proportion of CD25hi CD4+ cells from patients with CD increased in the presence of vitamin D. After treatment with infliximab, significant increases in serum vitamin D levels were noted in patients.
Conclusions
Low vitamin D levels are associated with disease activity in CD and increase after infliximab treatment.
Keywords: Crohn’s disease, vitamin D, infliximab
Vitamin D deficiency is common in patients with inflammatory bowel disease although it is not clear if this is cause or effect.1,2 Noted variations in Crohn’s disease (CD) prevalence and activity according to geographic latitude and seasons have been postulated to occur because of seasonal fluctuations in vitamin D levels.3,4 Epidemiological and clinical studies have associated serum vitamin D levels with the risk of developing CD and levels of disease activity with established disease.5,6 Although these associations suggest causality, they have not been universally confirmed.7,8 However, a single trial of vitamin D was shown to decrease disease activity scores in a small cohort of patients with CD, suggesting therapeutic benefits from elevating vitamin D levels.9
Studies of vitamin D in patients with inflammatory bowel disease predominantly report serum levels of 25-hydroxyvitamin D (25(OH)D), an inactive precursor that circulates in the blood and has a half-life of 1 month.2 Conversion of 25(OH) D to active 1α,25-dihydroxyvitamin D (1,25(OH)D) is performed by the enzyme CYP27B1, an enzyme now known to be expressed by many circulating immune cell types.10,11 The active 1,25(OH)D activates the vitamin D receptor (VDR), which eventually binds to VDR-response elements in the target cell’s genome. Local production of 1,25(OH)D by expression of CYP27B1 in the microenvironment is now recognized as a paracrine pathway of immune regulation.12
Numerous in vitro studies have provided mechanistic explanations for the potential immunoprotective effects of vitamin D.13 Binding sites for the VDR have been identified in genes associated with CD, and vitamin D has been shown to enhance the production of interleukin-10 (IL-10) and induction of regulatory T cells.14–16 However, patients treated with vitamin D have also been noted to have increased IL-6 levels and an expansion of CD4+ T cells.17 Other studies on the effect of vitamin D on proliferation of T lymphocytes have produced conflicting results.18,19 Vitamin D also plays a role in the ability of human macrophages to kill intracellular bacteria, and dysfunction in this process has been associated with the risk of CD.20,21 There is recent evidence to support a protective role for vitamin D within epithelial cells against intestinal inflammation, independent of immune cells.22
If low vitamin D levels are a consequence of inflammation, these should correlate with disease activity and be reversed by treatment of the underlying inflammation. Previous studies in patients have reported that low vitamin D levels were associated with lower quality of life and higher disease activity scores.6,23 Little is known about the effects of treatment of active CD with antitumor necrosis factors (anti-TNFs) on vitamin D pathways. We sought to measure vitamin D, VDR, and CYP27B1 levels in the peripheral blood of patients with CD, correlate with biomarkers, and to determine how these were affected by anti-TNF treatment.
MATERIALS AND METHODS
Patients
Patients were prospectively recruited from the Inflammatory Bowel Disease Center at Beth Israel Deaconess Medical Center, Boston. The study was approved by the institutional review board. Age, gender, duration of disease, current medications (including vitamin D supplements), and season of enrollment was recorded for each patient. Activity of disease at enrollment was determined by clinical scores (Harvey–Bradshaw Index [HBI]) and laboratory values (C-reactive protein [CRP]). An HBI score >5 was considered “active” disease.24 A subset of the cohort was enrolled before commencement of infliximab loading and had HBI and vitamin D measured at enrollment, and 2 weeks later.
Blood Isolation
Each patient had 10 mL of heparinized whole blood and 5 mL of serum collected at enrollment, and the subset had a second sample collected 2 weeks later. Peripheral blood mononuclear cells (PBMCs) were isolated by density gradient separation as previously described.17 CD4+ T cells were isolated using the RosetteSep Human CD4+ T-Cell Enrichment Cocktail (Stemcell Technologies, Vancouver, Canada). Serum and PBMCs were frozen at −80°C unless being used immediately.
Vitamin D Measurement
Serum vitamin D levels (25(OH)D) were measured by using a commercial solid phase enzyme-linked immunoassay kit (Calbiotech, San Diego, CA). Briefly, 10 µL of each sample was incubated in anti-vitamin D antibody–coated wells at room temperature for 90 minutes according to the manufacturer’s instructions. This kit has been independently demonstrated to have a lower limit of quantification of 1.25 ng/mL and upper limit of 150 ng/mL.25 The intra-assay variation is <6%, and total imprecision is <8%. The specificity for vitamin D3 is 100%. The manufacturers do not provide a reference range for New England.
Reverse Transcription Polymerase Chain Reaction
Messenger RNA (mRNA) was extracted from CD4+ T cells that were isolated from patients with CD using the Qiagen RNeasy Mini Kit (Qiagen, Valencia, CA). TaqMan VDR, CYP27B1, and CYP24A1 gene expression primers were obtained from Invitrogen (Grand Island, NY). Quantitative polymerase chain reaction was performed on the mRNA extracted from CD4+ T cells using the 7700 Sequence Detector (Applied Biosystems, Foster City, CA) and TaqMan technology as previously described.26 The expression of 18S ribosomal subunit was used as the internal control. Data were analyzed using the relative standard curve method.
CD4+ T-cell Proliferation
About 2 × 10⁵ CD4+ T cells were suspended in 96-well plates (Sigma–Aldrich, St. Louis, MO) with 200 µL of RPMI, 50 U/mL of IL-2, penicillin, and streptomoycin. The CD4+ T cells were stimulated with 1.25 µL of anti-CD3/CD28 (Invitrogen). After 3 days of incubation, 10, 50, and 100 nM of 1,25 vitamin D3 (Sigma–Aldrich) was added to the wells. On the sixth day, 0.25 µCi of thymidine (Perkin Elmer, Waltham, MA) was added to each well. Proliferation was measured on day 7 through Beckman LS 6500 Scintillation Counter (Beckman Coulter Inc., Brea, CA).
Flow Cytometry
The same CD4+ T cells were stained with antibody-fluorochrome conjugates per manufacturer’s methods at day 7 (eBioscience, San Diego, CA and BD Pharmingen, San Jose, CA). Fluorochromes include CD25 FITC and CD39 APC. The cells were incubated with FITC and APC conjugates for 30 minutes. FACScan (Becton Dickinson, Franklin Lakes, NJ) was used for flow cytometry. Data were analyzed with WinMDI2.8 software.
Data Analysis
Mean and SD were recorded for continuous variables. For continuous variables, t test or analysis of variance was used to compare mean between individual or across groups. For categorical variables, χ2 or Fisher’s exact test was used where appropriate to compare frequencies. Spearman’s r was generated to correlate nonparametric continuous variables with vitamin D levels. To account for seasonal variations in vitamin D in New England and small sample size, the year was dichotomized to a “high” season (June to November) and a “low” season (December to May). All data were analyzed using JMP software (version 8.0; SAS Institute, Cary, NC), and figures were generated using GraphPad Prism (version 5.0; GraphPad Software Inc., La Jolla, CA).
RESULTS
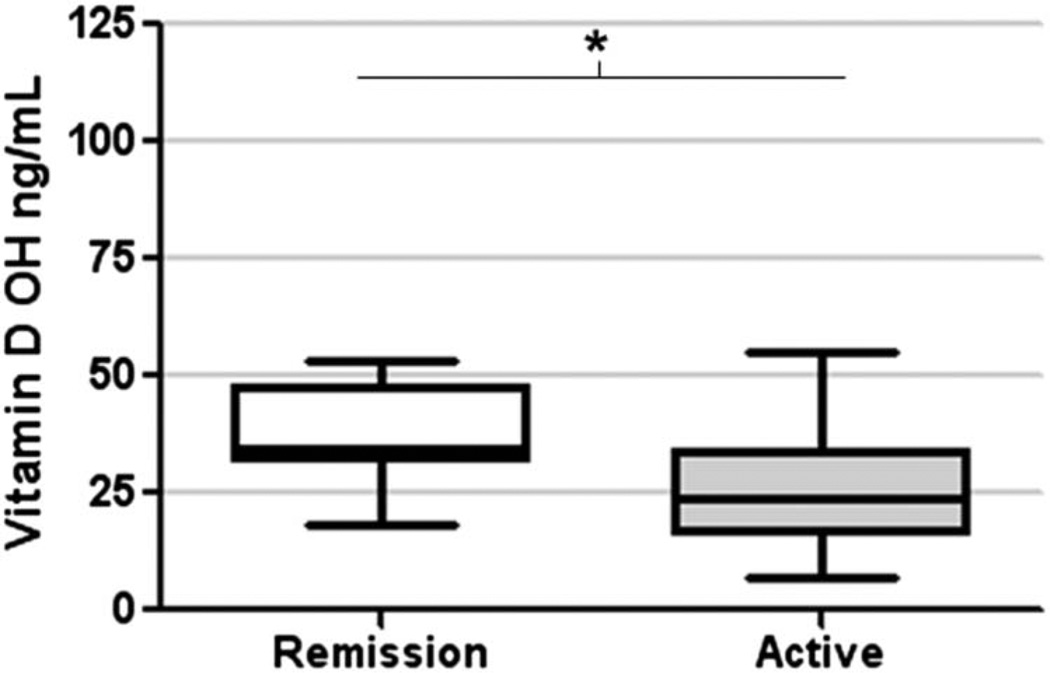
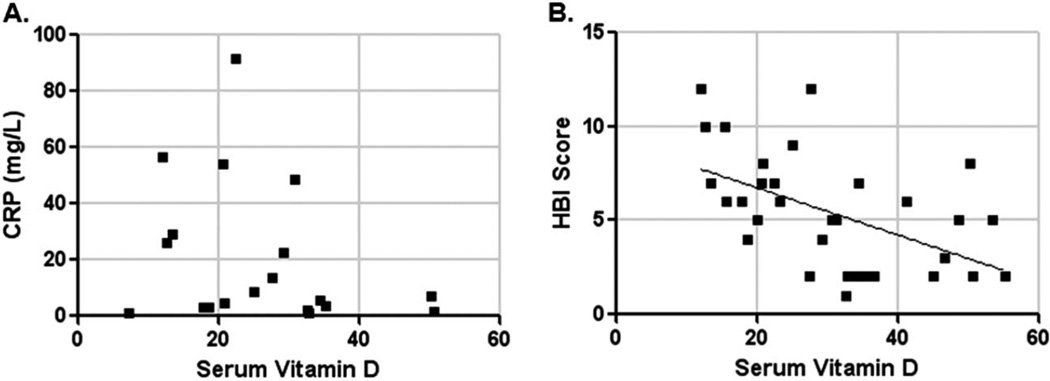
Thirty-seven patients were enrolled in the study, 20 with active disease and 17 in remission. Table 1 describes the patients’ baseline characteristics. Serum vitamin D levels were not significantly different between seasons (June to November, mean 36 ng/mL; and December to May, 28 ng/mL) or according to reported supplement use (taking, mean 44 ng/mL; not taking, 33 ng/mL). However, mean serum vitamin D level at enrollment in patients with active disease was 27 ng/mL (±2) compared with 38 ng/mL (±3) in those in remission (P = 0.02 by t test) (Fig. 1). Serum vitamin D levels correlated with HBI scores (Spearman’s r = −0.5, P = 0.005), but not with CRP levels (Fig. 2A, B).
FIGURE 1.
Mean serum vitamin D levels in patients in remission (white box) or with active CD (gray box) (*P < 0.05).
FIGURE 2.
X–Y plot of serum vitamin D against CRP (A) and HBI score (B). Diagonal line represents logistic regression line (P = 0.005).
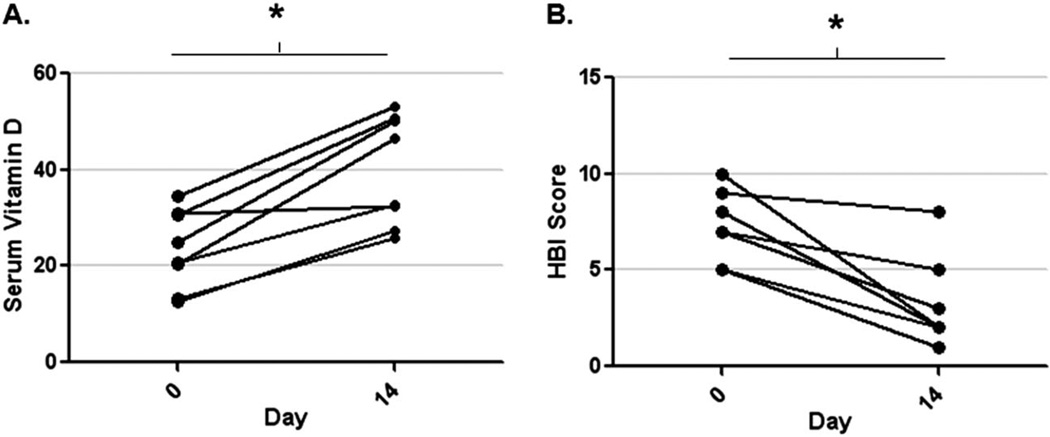
In 8 patients, we measured vitamin D levels at the time of active inflammation (day 0) and at 14 days after receiving infliximab therapy (day 14). Mean serum vitamin D levels were 23 ng/mL (±3) before anti-TNF and 40 (±4) ng/mL 2 weeks later (P < 0.005 by paired t test). Seven of the 8 had higher serum vitamin D level after infliximab, and 5 of the 8 had a significant decline in the HBI scores (>3 decrease) after treatment (Fig. 3A, B). Mean CRP after infliximab (3.2 mg/L, SD = 2.4) was significantly lower than preinfliximab levels (mean 18.4 mg/L, SD = 18, P = 0.04 by Mann–Whitney test). We analyzed the change in serum vitamin D levels (delta) according to “clinical response” (HBI drop >3). The mean increase in serum vitamin D levels after infliximab was similar in both responders (mean 15 ng/mL, SD = 9) and nonresponders (mean 18 ng/mL, SD = 7), suggesting early improvements in vitamin D levels were independent of symptom scores. Only 1 of 8 patients reported taking vitamin D supplements during his infliximab treatment period.
FIGURE 3.
Paired serum vitamin D levels in patients on day 0 and day 14 after an infliximab infusion (A) and HBI scores in the same patients on day 0 and day 14 (B) (*P < 0.05).
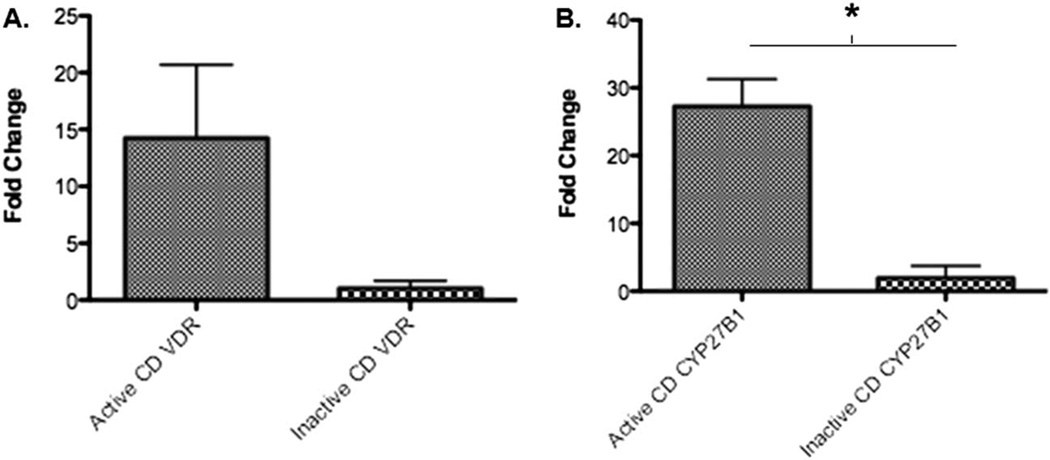
Because circulating 25(OH) D requires the enzyme CYP27B1 to convert to active 1,25(OH)D and expression of the VDR for immunologic activity, we next measured expression of these genes in the CD4+ PBMCs of patients with CD. Mean gene expression (fold change) of VDR and CYP27B1 in PBMCs was higher in those with active CD when compared with those with inactive CD (P = 0.057 for VDR, P < 0.001 for CYP27B1, Fig. 4A, B). There was no correlation between serum vitamin D levels and VDR expression in these samples (data not shown).
FIGURE 4.
Gene expression (fold change to normal) in CD4+ PBMCs of VDR gene (A) and CYP27B1 gene (B) in patients with CD.
Finally, we measured the immunological effects of raising vitamin D levels in patients with active CD. The stimulated polyclonal proliferation of CD4+ T cells increased from a baseline rate of 95,125 counts per minute (cpm) to 148,740 cpm (56% increase) with the addition of 10 nM or 50 nM of vitamin D. This change was not statistically significantly (Fig. 5A). To determine if vitamin D was associated with induction of regulatory T cells (CD25+CD39+), we performed flow cytometry to measure the proportion of CD25+ and CD39+ T cells in the CD4+ pool. The proportion of CD25+ cells among the stimulated CD4+ population increased by 3-fold in the presence of vitamin D at 50 nM, but the proportion of CD39+ cells remained unchanged (Fig. 5B).
FIGURE 5.
A, Cell proliferation of CD4+ PBMCs in increasing concentrations (0, 10, 50 nM) of vitamin D in vitro. B, Proportion of CD4+ PBMCs that were CD25+ (black columns) or CD39+ (gray columns) after being cultured with different concentrations (0, 50 nM) of vitamin D ex vivo (x axis) for 3 days.
DISCUSSION
We demonstrate that vitamin D levels inversely correlate with disease activity in patients with CD. Consistent with the literature, we report that patients with active CD exhibit lower serum vitamin D levels than those in clinical remission. Jorgensen et al27 reported serum vitamin D values in 182 patients with CD and noted an inverse relationship between vitamin D levels and CDAI scores, which was independent of smoking status or body mass index in a regression model. A Japanese cohort of 33 patients with CD also noted an association between CDAI scores, disease duration, and low vitamin D levels; these associations remained significant after multivariate analyses.28 We add additional data to this literature by demonstrating early increases in serum vitamin D levels with clinical response to anti-TNF therapy. This effect may not be explained by improved absorption alone and would suggest that serum levels are responsive to the burden of systemic inflammation. Previous studies have reported improvements in nutritional status and metabolism after infliximab therapy but did not measure vitamin D levels per se.29,30
As expected, VDR gene expression was higher in active disease in our patients, but this was not directly correlated with serum 25(OH)D levels. Previous studies have associated PBMC VDR expression with autoimmune diseases, albeit this was independent of serum vitamin D levels.31,32 IFN-γ and activation of T cells, both seen in patients with active CD, can induce upregulation of VDR in this setting.19,33,34 Similarly, TNF, IFNγ, and IL-1 can also induce CYP27B1 expression by monocytes in the inflammatory milieu.35 The presence of these enzymes would readily permit the conversion of 25(OH)D to 1,25(OH)D and the activation of VDR to undertake local immunoregulatory effects.2 Supportive of this, our finding shows that the CD4+ T-cell population expanded in the presence of elevated levels of vitamin D ex vivo, but these were predominantly CD25+ cells. CD4+CD25+ T cells exhibit suppressive functional properties on CD25− cells, consistent with a regulatory phenotype. Previous studies have reported variable effects of vitamin D on T cells; vitamin D increased proliferation of CD4+CD25+ T cells and overall CD4+ T cells, but decreased numbers of CD4+ RO+/RA+ T cells.17,36,37 Further analyses would be required to characterize the functional activity of vitamin D–responsive cells in more depth.
Limitations of this study include the small sample size, which may lead to type 2 statistical errors and precludes multivariate regression model analysis. Most of our patients had only a single sample analyzed, and such observational associations do not prove causality. Further analysis of a larger cohort, pretreatment and posttreatment of their CD, would be required to validate these results. We did not objectively confirm active inflammation in patients with elevated HBI scores, although all patients with an HBI >5 had a CRP >3 mg/L. In addition, confounders that could have led to increases in vitamin D levels aside from reduction in inflammation could not be accounted for.
In conclusion, our study provides evidence that serum vitamin D levels reflect disease activity in patients with CD, which can be altered by anti-TNF therapy. Patients with active CD exhibit lower vitamin D levels, counter-balanced by a compensatory increase in PBMC, VDR, and CYP27B1 to maximize vitamin D3 production. From a clinical viewpoint, low levels of vitamin D should not be interpreted in isolation, but in the context of the patient’s disease activity at that time, and warrant repeated testing once in remission.
TABLE 1.
Patient Characteristics (N = 37)
| Variable | Active | Inactive |
|---|---|---|
| Mean age (STD), yr | 34 (12) | 30 (14) |
| Women, % | 50 | 47 |
| Smoker, % | 10 | 6 |
| Mean weight in lbs | 162 (53) | 147 (24) |
| Mean duration of disease (STD) | 8 (11) | 6 (12) |
| Disease behavior, % | ||
| B1 | 30 | 65 |
| B2 | 20 | 0 |
| B3 | 35 | 24 |
| Current medications, % | ||
| Steroids | 30 | 24 |
| Mean HBI score (STD) | 8 (2) | 2 (1) |
| Mean CRP in mg/L (STD) | 27 (26) | 3 (2) |
STD, standard deviation.
Acknowledgments
A. C. Moss is supported by NIH Grant K23DK084338.
Footnotes
The authors have no conflicts of interest to disclose.
REFERENCES
- 1.Sentongo TA, Semaeo EJ, Stettler N, et al. Vitamin D status in children, adolescents, and young adults with Crohn disease. Am J Clin Nutr. 2002;76:1077–1081. doi: 10.1093/ajcn/76.5.1077. [DOI] [PubMed] [Google Scholar]
- 2.Palmer MT, Weaver CT. Linking vitamin D deficiency to inflammatory bowel disease. Inflamm Bowel Dis. 2013;19:2245–2256. doi: 10.1097/MIB.0b013e31828a3b6f. [DOI] [PMC free article] [PubMed] [Google Scholar]
- 3.Sonnenberg A, McCarty DJ, Jacobsen SJ. Geographic variation of inflammatory bowel disease within the United States. Gastroenterology. 1991;100:143–149. doi: 10.1016/0016-5085(91)90594-b. [DOI] [PubMed] [Google Scholar]
- 4.Sonnenberg A, Jacobsen SJ, Wasserman IH. Periodicity of hospital admissions for inflammatory bowel disease. Am J Gastroenterol. 1994;89:847–851. [PubMed] [Google Scholar]
- 5.Ananthakrishnan AN, Khalili H, Higuchi LM, et al. Higher predicted vitamin D status is associated with reduced risk of Crohn’s disease. Gastroenterology. 2012;142:482–489. doi: 10.1053/j.gastro.2011.11.040. [DOI] [PMC free article] [PubMed] [Google Scholar]
- 6.Ulitsky A, Ananthakrishnan AN, Naik A, et al. Vitamin D deficiency in patients with inflammatory bowel disease: association with disease activity and quality of life. JPEN J Parenter Enteral Nutr. 2011;35:308–316. doi: 10.1177/0148607110381267. [DOI] [PubMed] [Google Scholar]
- 7.Ahuja V, Tandon RK. Inflammatory bowel disease in the Asia-Pacific area: a comparison with developed countries and regional differences. J Dig Dis. 2010;11:134–147. doi: 10.1111/j.1751-2980.2010.00429.x. [DOI] [PubMed] [Google Scholar]
- 8.Levin AD, Wadhera V, Leach ST, et al. Vitamin D deficiency in children with inflammatory bowel disease. Dig Dis Sci. 2011;56:830–836. doi: 10.1007/s10620-010-1544-3. [DOI] [PubMed] [Google Scholar]
- 9.Yang L, Weaver V, Smith JP, et al. Therapeutic effect of vitamin d supplementation in a pilot study of Crohn’s patients. Clin Transl Gastroenterol. 2013;4:e33. doi: 10.1038/ctg.2013.1. [DOI] [PMC free article] [PubMed] [Google Scholar]
- 10.Gottfried E, Rehli M, Hahn J, et al. Monocyte-derived cells express CYP27A1 and convert vitamin D3 into its active metabolite. Biochem Biophys Res Commun. 2006;349:209–213. doi: 10.1016/j.bbrc.2006.08.034. [DOI] [PubMed] [Google Scholar]
- 11.Moran-Auth Y, Penna-Martinez M, Shoghi F, et al. Vitamin D status and gene transcription in immune cells. J Steroid Biochem Mol Biol. 2013;136:83–85. doi: 10.1016/j.jsbmb.2013.02.005. [DOI] [PubMed] [Google Scholar]
- 12.Hewison M, Burke F, Evans KN, et al. Extra-renal 25-hydroxyvitamin D3-1alpha-hydroxylase in human health and disease. J Steroid Biochem Mol Biol. 2007;103:316–321. doi: 10.1016/j.jsbmb.2006.12.078. [DOI] [PubMed] [Google Scholar]
- 13.Yang CY, Leung PS, Adamopoulos IE, et al. The implication of vitamin D and autoimmunity: a comprehensive review. Clin Rev Allergy Immunol. 2013;45:217–226. doi: 10.1007/s12016-013-8361-3. [DOI] [PMC free article] [PubMed] [Google Scholar]
- 14.Bartels LE, Jorgensen SP, Agnholt J, et al. 1,25-dihydroxyvitamin D3 and dexamethasone increase interleukin-10 production in CD4+ T cells from patients with Crohn’s disease. Int Immunopharmacol. 2007;7:1755–1764. doi: 10.1016/j.intimp.2007.09.016. [DOI] [PubMed] [Google Scholar]
- 15.Ramagopalan SV, Heger A, Berlanga AJ, et al. A ChIP-seq defined genome-wide map of vitamin D receptor binding: associations with disease and evolution. Genome Res. 2010;20:1352–1360. doi: 10.1101/gr.107920.110. [DOI] [PMC free article] [PubMed] [Google Scholar]
- 16.Penna G, Roncari A, Amuchastegui S, et al. Expression of the inhibitory receptor ILT3 on dendritic cells is dispensable for induction of CD4 +Foxp3+ regulatory T cells by 1,25-dihydroxyvitamin D3. Blood. 2005;106:3490–3497. doi: 10.1182/blood-2005-05-2044. [DOI] [PubMed] [Google Scholar]
- 17.Bendix-Struve M, Bartels LE, Agnholt J, et al. Vitamin D3 treatment of Crohn’s disease patients increases stimulated T cell IL-6 production and proliferation. Aliment Pharmacol Ther. 2010;32:1364–1372. doi: 10.1111/j.1365-2036.2010.04463.x. [DOI] [PubMed] [Google Scholar]
- 18.Stio M, Treves C, Martinesi M, et al. Effect of anti-TNF therapy and vitamin D derivatives on the proliferation of peripheral blood mononuclear cells in Crohn’s disease. Dig Dis Sci. 2004;49:328–335. doi: 10.1023/b:ddas.0000017460.90887.11. [DOI] [PubMed] [Google Scholar]
- 19.von Essen MR, Kongsbak M, Schjerling P, et al. Vitamin D controls T cell antigen receptor signaling and activation of human T cells. Nat Immunol. 2010;11:344–349. doi: 10.1038/ni.1851. [DOI] [PubMed] [Google Scholar]
- 20.Liu PT, Stenger S, Li H, et al. Toll-like receptor triggering of a vitamin D-mediated human antimicrobial response. Science. 2006;311:1770–1773. doi: 10.1126/science.1123933. [DOI] [PubMed] [Google Scholar]
- 21.Strisciuglio C, Miele E, Wildenberg ME, et al. T300A variant of autophagy ATG16L1 gene is associated with decreased antigen sampling and processing by dendritic cells in pediatric Crohn’s disease. Inflamm Bowel Dis. 2013;19:2339–2348. doi: 10.1097/MIB.0b013e3182a6a11c. [DOI] [PubMed] [Google Scholar]
- 22.Liu W, Chen Y, Golan MA, et al. Intestinal epithelial vitamin D receptor signaling inhibits experimental colitis. J Clin Invest. 2013;123:3983–3996. doi: 10.1172/JCI65842. [DOI] [PMC free article] [PubMed] [Google Scholar]
- 23.Hassan V, Hassan S, Seyed-Javad P, et al. Association between serum 25 (OH) vitamin D concentrations and inflammatory bowel diseases (IBDs) activity. Med J Malaysia. 2013;68:34–38. [PubMed] [Google Scholar]
- 24.Harvey RF, Bradshaw MJ. Measuring Crohn’s disease activity. Lancet. 1980;1:1134–1135. doi: 10.1016/s0140-6736(80)91577-9. [DOI] [PubMed] [Google Scholar]
- 25.Pandian R, Pandian J, Elias A. Clinical importance of bioavailable vitamin D: development and analytical validation of bioavailable 25 hydroxy vitamin D assay. Amer Assoc Clin Chem. 2013 Ref Type: Abstract. [Google Scholar]
- 26.Kunzli BM, Berberat PO, Dwyer K, et al. Variable impact of CD39 in experimental murine colitis. Dig Dis Sci. 2011;56:1393–1403. doi: 10.1007/s10620-010-1425-9. [DOI] [PubMed] [Google Scholar]
- 27.Jorgensen SP, Hvas CL, Agnholt J, et al. Active Crohn’s disease is associated with low vitamin D levels. J Crohns Colitis. 2013;7:e407–e413. doi: 10.1016/j.crohns.2013.01.012. [DOI] [PubMed] [Google Scholar]
- 28.Tajika M, Matsuura A, Nakamura T, et al. Risk factors for vitamin D deficiency in patients with Crohn’s disease. J Gastroenterol. 2004;39:527–533. doi: 10.1007/s00535-003-1338-x. [DOI] [PubMed] [Google Scholar]
- 29.Nishida N, Sasaki M, Kurihara M, et al. Changes of energy metabolism, nutritional status and serum cytokine levels in patients with Crohn’s disease after anti-tumor necrosis factor-alpha therapy. J Clin Biochem Nutr. 2013;53:122–127. doi: 10.3164/jcbn.13-18. [DOI] [PMC free article] [PubMed] [Google Scholar]
- 30.Wiese D, Lashner B, Seidner D. Measurement of nutrition status in Crohn’s disease patients receiving infliximab therapy. Nutr Clin Pract. 2008;23:551–556. doi: 10.1177/0884533608323421. [DOI] [PMC free article] [PubMed] [Google Scholar]
- 31.Goswami R, Mondal AM, Tomar N, et al. Presence of 25(OH)D deficiency and its effect on vitamin D receptor mRNA expression. Eur J Clin Nutr. 2009;63:446–449. doi: 10.1038/ejcn.2008.29. [DOI] [PubMed] [Google Scholar]
- 32.Tuller T, Atar S, Ruppin E, et al. Common and specific signatures of gene expression and protein-protein interactions in autoimmune diseases. Genes Immun. 2013;14:67–82. doi: 10.1038/gene.2012.55. [DOI] [PubMed] [Google Scholar]
- 33.Edfeldt K, Liu PT, Chun R, et al. T-cell cytokines differentially control human monocyte antimicrobial responses by regulating vitamin D metabolism. Proc Natl Acad Sci U S A. 2010;107:22593–22598. doi: 10.1073/pnas.1011624108. [DOI] [PMC free article] [PubMed] [Google Scholar]
- 34.Spanier JA, Nashold FE, Olson JK, et al. The Ifng gene is essential for Vdr gene expression and vitamin D(3)-mediated reduction of the pathogenic T cell burden in the central nervous system in experimental autoimmune encephalomyelitis, a multiple sclerosis model. J Immunol. 2012;189:3188–3197. doi: 10.4049/jimmunol.1102925. [DOI] [PubMed] [Google Scholar]
- 35.Gyetko MR, Hsu CH, Wilkinson CC, et al. Monocyte 1 alpha-hydroxylase regulation: induction by inflammatory cytokines and suppression by dexamethasone and uremia toxin. J Leukoc Biol. 1993;54:17–22. doi: 10.1002/jlb.54.1.17. [DOI] [PubMed] [Google Scholar]
- 36.Almerighi C, Bergamini A, Lionetti R, et al. Vitamin D3 modulates T lymphocyte responses in hepatitis C virus-infected liver transplant recipients. Dig Liver Dis. 2012;44:67–73. doi: 10.1016/j.dld.2011.08.010. [DOI] [PubMed] [Google Scholar]
- 37.Correale J, Ysrraelit MC, Gaitan MI. Vitamin D-mediated immune regulation in multiple sclerosis. J Neurol Sci. 2011;311:23–31. doi: 10.1016/j.jns.2011.06.027. [DOI] [PubMed] [Google Scholar]


