

Abstract
Objectives
To determine in patients with peripheral arterial disease (PAD) whether novel biomarkers improve prediction of cardiovascular disease (CVD) mortality and total mortality.
Background
Whether novel biomarkers improve risk prediction of mortality beyond standard CVD risk markers in PAD patients, and whether any such prediction differs with length of follow-up, remains controversial.
Methods
A cohort of 397 patients were referred to a vascular lab had PAD diagnosed by non-invasive testing. 58% also had coronary or cerebrovascular disease at baseline. Predictors of total, CVD, and non-CVD mortality were assessed with Cox proportional hazards models, and the incremental value of predictors were evaluated with both the C-statistic and the integrated discrimination improvement (IDI) index.
Results
Total mortality was 11 % at 2 years of follow-up and 65 % at an average of 7 years of follow-up (maximum 11.4 years). At 2 years, hs-CRP was a strong and significant predictor of mortality, with a hazard ratio (HR) of 1.56 per standard deviation, p=.006. However, at full follow-up standard CVD risk markers were significant (age, sex, ankle-brachial index [ABI], other CVD, and hypertension), but hs-CRP no longer showed a significant relationship HR = 1.12, p = .11. None of the other biomarkers studied showed a significant independent association with mortality. Hs-CRP improved the C-statistic and the IDI beyond standard risk markers at 2 years, but not at full follow-up.
Conclusions
Hs-CRP was a strong predictor of short-term mortality in this cohort of PAD patients, while standard risk markers were better at predicting longer-term mortality.
Keywords: biomarkers, peripheral arterial disease, cardiovascular diseases, risk prediction, mortality
Introduction
In recent years, several novel cardiovascular risk factors including inflammatory, thrombotic, and fibrinolytic markers have been studied prospectively in populations of primarily healthy participants at baseline. Reports of associations with cardiovascular disease (CVD) morbidity and mortality have varied, though associations for highly sensitive C reactive protein (hs-CRP) have been fairly consistent (1–3). Although some studies report relatively constant predictive value for mortality throughout follow-up (4, 5), several reports have indicated that inflammatory markers were better predictors of proximate early deaths than later deaths (6–11). These reports were prospective studies in population-based cohorts, with the exception of one report from a group of peripheral arterial disease (PAD) patients (11). However, none of these studies employed ROC curves, C-statistics, or measures of misclassification to evaluate any changes in risk prediction as a function of time.
Patients with vascular disease have a high risk of mortality, primarily from CVD (12). To date, little evidence exists on these newer risk markers from cohorts selected for prevalent vascular disease at baseline. In an older cohort of PAD patients, we evaluated the association of six biomarkers including inflammatory, thrombotic, fibrinolytic, and atherosclerotic risk markers with short term (at 2 years) and longer term (up to 11.4 years, average 7.0 years) mortality. Total, CVD, and non-CVD mortality were separately evaluated. Using the C-statistic and the integrated discrimination improvement (IDI) index, we also determined the degree to which biomarkers provided incremental information in risk prediction and whether this differed between near and longer-term follow-up.
Methods
Subjects were recruited between 1990 and 1994 from patients who had been seen in the previous ten years for non-invasive lower extremity arterial testing at the vascular laboratories of the San Diego Veterans Administration Medical Center (SDVAMC) and the University of California San Diego Medical Center (UCSDMC). Out of 2265 patients having such visits, 481 were deceased and another 1272 could not be located or declined to participate. Informed consent was obtained from the remaining 512 patients, who were included in the baseline visit for this study. A prior analysis of this cohort found that participants had slightly less advanced PAD than surviving non-participants and included a higher percentage of women (13% vs. 8%), but were similar with respect to age (13). Among these 512 patients, PAD was confirmed by non-invasive testing in 397 patients who a frozen blood sample at baseline and mortality follow-up.
At baseline, subjects completed a health history questionnaire. Weight and height were measured. Standard cardiovascular risk factors were measured at baseline. Because of extensive treatment in this high-risk population, composite variables were created for hypertension (systolic BP >140 mmHg, diastolic BP >90 mmHg, or medication use), dyslipidemia (total cholesterol to HDL cholesterol ratio >5 or medication use), and diabetes (fasting glucose >125 mg/dl or diabetes history). Pack-years of cigarette smoking were determined by multiplying the number of years smoked by the average number of packs smoked per day.
Eight biomarkers were measured from baseline serum frozen and stored at −70° centigrade. We have previously reported the results for two biomarkers, N-terminal pro-brain-type natriuretic peptide and lipoprotein associated phospholipase A2, neither of which showed a significant association with mortality in this cohort (14, 15). The remaining six biomarkers can be grouped into three categories: 1) inflammatory markers: CRP, serum amyloid A (SAA), 2) thrombotic and fibrinolytic markers: D-dimer and platelet activating factor (PAF), and atherogenic markers: homocysteine and lipoprotein (a). Hs-CRP assay was performed by an ultra-sensitive immunotechnique on the Behring BNII analyzer (Dade Behring, Newark, DE). The SAA and Lp(a) assay was performed by an immunotechnique on the Behring BNII analyzer (Dade Behring, Newark, DE). D-dimer was quantified using the Kamiya's K-Assay D-dimer Kit (catalogue # KAI-900). PAF was quantified using Azwell's Auto-PAF kit (code 274664847). For both D-dimer and PAF, calibrators and controls were run singly at the beginning and end of each day. All samples were run in single point. Total homocysteine was measured by HPLC with fluorometric detection using reagents from BioRad Laboratories, Hercules, CA.
At the baseline visit systolic BP was measured in the supine position at both ankles with a standard BP cuff, with detection at the toe by photoplethysmography. Brachial pressure was measured in both arms with the appropriate size cuff, with photoplethysmographic detection at the third finger. The ankle-brachial index (ABI) for each leg was computed as the ratio of the ankle pressure for that leg to the higher of the left and right brachial pressures. Because of the strong correlation between PAD and subclavian stenosis, use of the higher brachial pressure was particularly important in this high-risk population (16). The peak posterior tibial flow velocity was measured at each ankle. PAD was defined as an ABI at either ankle of <1.00, or > 1.40, or a peak posterior tibial flow velocity of <11 cm/sec, or previous leg revascularization (angioplasty or surgery) (12). CVD other than PAD was defined as a history of angina, myocardial infarction or coronary revascularization, or a history of TIA, stroke or carotid revascularization. This composite variable was labeled “other CVD”.
Mortality in the study cohort was identified using Social Security Administration data available through the end of 2002. A certified nosologist coded the causes of death based on death certificates obtained from state vital statistics offices. Three endpoints were considered in the analysis: all cause mortality, CVD mortality and non-CVD mortality. Mortality was classified based on the underlying cause of death on the death certificate. CVD mortality was identified by ICD-9 codes 250 (diabetes mellitus), 395–396 and 401–444. Deaths where the underlying cause was diabetes mellitus were classified as CVD since the ICD coding system allows a patient with an MI and stroke listed on the death certificate to have diabetes mellitus as the underlying cause of death. All other deaths were classified as non-CVD mortality.
Subjects were tabulated by mortality status: alive, all-cause mortality, and the mortality subsets of CVD and non-CVD. Age and sex-adjusted mean baseline values of standard risk factors and the biomarkers were calculated for each these groups at longer term (up to 11.4 years, mean = 7 yrs) follow-up. For 2 years of follow-up, all subjects except those censored had those precise follow-up times. The final (and thus “full”) follow-up included a maximum of 11.38 years and an average of 6.95 years. Among the biomarkers, only homocysteine and PAF approximated a normal distribution, so the natural log (ln) of each of the remaining 4 biomarkers was utilized. For presentation of a meaningful number, the geometric mean was back calculated from the ln mean. Next, to explore for relationships between biomarkers, an age and sex-adjusted correlation matrix was run.
In this PAD cohort, the goal was to evaluate the influences of the biomarkers while adjusting for other CVD present at baseline, as well as the traditional CVD risk factors, both for near and longer-term follow-up. Cox proportional hazards models were fit for three endpoints (all cause mortality, CVD mortality, non-CVD mortality) for 2 years and full follow-up respectively. Thus, six separate models were run. All the traditional risk factors were included in these models. To explore for non-linear relationships, each of the selected biomarkers was initially modeled as quartiles, followed by modeling as a continuous variable. To be retained in the final multivariate models, a biomarker had to show an adjusted p value of <0.10 for at least one of the two follow-up periods. Shoenfeld residuals confirmed that the proportional hazards assumptions were met (17). Proportional hazards models were also used to generate C statistics, and the contribution of individual factors to the C statistic at short and longer-term follow-up was evaluated. The IDI, a measure of the extent of correct re-classification of cases and non-cases by a risk variable, was calculated as previously described (19). No adjustment was made for multiple comparisons, and p-values are given. All analyses were performed using SAS software (20). The study protocol was approved by the institutional review boards of SDVAMC and UCSDMC and the subjects all provided informed consent to participate in the study.
Results
Full follow-up ranged from 10 days to 11.38 years (average = 6.95 years). At 2 years there were 44 deaths (11.1%), 25 from CVD. By an average of 7 years follow-up, 259 (65.2%) had died, 150 from CVD.
Table 1 shows mean levels or percentages of each of the risk variables across the four vital status categories at full follow-up. P-values are for comparisons of survivors separately to each of the three mortality groups. Older age and male gender were strongly associated with total, CVD, and non-CVD mortality. Thus, all other risk variables in Table 1 were age and sex-adjusted. Other CVD was significantly associated with total and CVD mortality. Among risk factors, hypertension and diabetes were the strongest predictors for total and CVD mortality. The next strongest correlate was CRP, which showed borderline associations with both CVD and non-CVD mortality (p=.06). Pack-years of cigarettes was the next strongest correlate, and showed a stronger association non-CVD mortality, likely reflecting the significant numbers of respiratory cancer and COPD deaths in the latter category. The only other variable which showed an association with a p value <0.10 for any mortality category was dyslipidemia for CVD mortality.
Table 1.
Levels of Standard Risk Markers and Biomarkers at Baseline in Survivors and Decedents at Full Follow-up (ave.= 7 years)
| Alive | Dead | CVD Mortality | Non-CVD Mortality | |
|---|---|---|---|---|
| Risk Markers | N=138 | N=259 | N=150 | N=109 |
| Age | 66.1 | 70.1 (<0.001) | 69.9 (<0.001) | 70.5 (<0.001) |
| Female % | 18.1 | 8.1 (<0.01) | 6.0 (<0.01) | 11.0 (0.08) |
| Age- and sex-adjusted Standard risk markers | ||||
| Hypertension, % | 70.6 | 84.0 (<0.01) | 87.3 (<0.01) | 79.5 (0.09) |
| CVD, % | 48.4 | 63.4 (<0.01) | 69.6 (<0.01) | 54.9 (0.31) |
| Diabetes, % | 28.0 | 43.4 (<0.01) | 49.5 (<0.01) | 35.0 (0.26) |
| Pack-years cigarettes | 46.8 | 55.0 (0.08) | 53.6 (0.19) | 56.9 (0.07) |
| Dyslipidemia, % | 48.5 | 53.7 (0.34) | 61.9 (0.02) | 42.3 (0.33) |
| Biomarkers | ||||
| Hs-CRP (mg/L) | 2.83 | 3.57 (0.06) | 3.45 (0.15) | 3.74 (0.06) |
| SAA (mg/L) | 0.49 | 0.58 (0.12) | 0.58 (0.19) | 0.59 (0.17) |
| D-dimer (ug/m L) | 0.92 | 1.07 (0.18) | 1.02 (0.40) | 1.14 (0.11) |
| Homocysteine (mg/L) | 14.64 | 13.54 (0.34) | 13.63 (0.43) | 13.43 (0.38) |
| PAF (IU/L) | 645.83 | 656.57 (0.62) | 664.00 (0.44) | 646.55 (0.98) |
| Lp(a) (mg/dL) | 11.41 | 9.72 (0.25) | 10.24 (0.48) | 9.05 (0.16) |
Table 2 shows the multivariable survival model results for total, CVD, and non-CVD mortality at 2yrs and full follow-up. Because of missing data for one or more variables, 21 of the 397 PAD patients were excluded from the multivariate models. Among the biomarkers only hs-CRP met the p <0.10 criterion inclusion for in the models. For total mortality, at two years of follow-up, hs-CRP was the strongest predictor, HR=1.56 per SD (p=.006). The only other significant predictor was diabetes, HR=2.11 (p=.018). At 7 years average follow-up, age, sex, other CVD, and hypertension all showed positive and significant associations, while the ABI was significantly inversely associated with mortality, indicating the greater risk for more severe PAD. The HR for hs-CRP was no longer significant, 1.12, p=.11.
Table 2.
Hazard Ratios for 2-Year and Full Follow-up (ave. = 7 years) for Total, CVD, and Non-CVD Mortality
| Total Mortality | CVD Mortality | Non-CVD Mortality | ||||
|---|---|---|---|---|---|---|
|
|
||||||
| Risk Markers | 2 yr | 7 yr | 2 yr | 7 yr | 2 yr | 7 yr |
| Age (10 yrs) | 1.38 | 1.55 | 1.21 | 1.64 | 1.59 | 1.46 |
| Female | 0.50 | 0.62 | 0.00 | 0.45 | 1.65 | 0.84 |
| Diabetes | 2.11 | 1.30 | 2.14 | 1.53 | 1.90 | 1.00 |
| ABI | 0.24 | 0.41 | 0.04 | 0.14 | 2.73 | 1.39 |
| Other CVD | 0.92 | 1.35 | 0.92 | 1.69 | 1.07 | 1.06 |
| Hypertension | 1.12 | 1.52 | 3.99 | 1.92 | 0.42 | 1.22 |
| Cigarette pack-yrs (40) | 1.00 | 1.11 | 0.99 | 1.11 | 1.14 | 1.13 |
| Dyslipidemia | 1.13 | 1.10 | 2.54 | 1.50 | 0.38 | 0.73 |
| Ln hs-CRP (SD) | 1.56 | 1.12 | 1.21 | 1.05 | 2.19 | 1.22 |
Bold type denotes p < 0.05
For CVD mortality at 2 years (table 2), the inverse association for ABI was the only significant predictor, though dyslipidemia was borderline, HR=2.54 (p=.055). At 7 years, age, gender, diabetes, ABI, other CVD, hypertension, and dyslipidemia all significantly predicted CVD mortality. Although the HR for hs-CRP was greater at 2 years (1.21) than at 7 (1.05), neither HR was statistically significant. For non-CVD mortality, hs-CRP was the only significant predictor at 2 years of follow-up, HR = 2.19 (p=.001). Only age was a significant predictor at 7 years.
Figure 1 shows Kaplan-Meier survival curves for quartiles of hs-CRP for total mortality. Over the first 2 years, there was a sharp divergence in risk for higher levels of hs-CRP, followed by roughly parallel curves for the remainder of follow-up, visually confirming the greater hazard for hs-CRP over the first two years. Figure 2 shows the test characteristics of the upper half vs. the lower half of hs-CRP values at 1, 2, and average 7 years of follow-up. The sensitivity decreases over time, from 75 to 60 to 50%, while the specificity remains similar at about 50%. As expected over time as the mortality rates increased, the positive predictive value increased and the negative predictive value decreased. These results confirm the greater early hazard of hs-CRP.
Figure 1.

Total mortality by hs-CRP quartile
Figure 2.
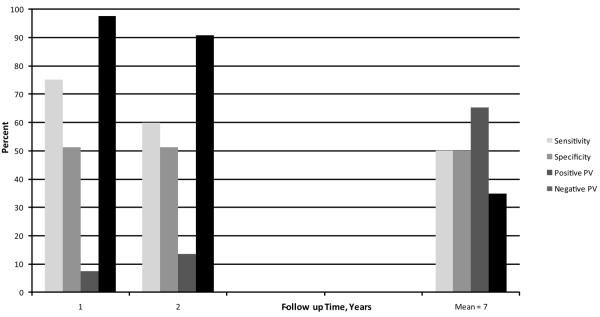
Test Characteristics for Total Mortality for hs-CRP Above vs. at or Below the 50th Percentile
Table 3 shows standard risk marker and biomarker contributions to the C statistic and the IDI for total mortality at 2 and 7 years. The first two rows are for standard risk markers alone and hs-CRP alone, followed by standard risk markers and hs-CRP. The next row is the difference in the C-statistic with vs. without the biomarkers. At 2 years, hs-CRP was a strong predictor variable, with a C statistic of 0.635, compared to 0.668 for all the standard risk markers combined. Addition of hs-CRP to the standard risk markers increased the C-statistic by .019, an increase that was not significant (p=.11) in part due to the sample size. In contrast, at full follow-up the c statistic for hs-CRP was much smaller (0.545) compared to the standard risk markers (.654), with only a trivial 0.002 (p=.55) additional increment for hs-CRP. The Integrated Discrimination Improvement (IDI) for hs-CRP, a measure of the degree of correct reclassification of fatal and non-fatal outcomes, was highly significant for hs-CRP at 2 years (p=.023) but not at 7 years (p=.307).
Table 3.
Cox Model C-statistics and Integrated Discrimination Improvement (IDI) P-values for All-Cause Mortality at 2 years and Full Follow-up (ave. = 7 years)
| Risk Markers | Year 2 | Year 7 |
|---|---|---|
| Standard Risk Factors | 0.668 | 0.654 |
| hs-CRP alone | 0.635 | 0.545 |
| Standard RFs + hs-CRP | 0.687 | 0.658 |
| Difference in C-statistic adding | ||
| hs-CRPto standard RFs | 0.019 (p-value 0.11) | 0.004 (p-value 0.55) |
| Integrated Discrimination | ||
| Improvement (IDI) p-value adding | ||
| hs-CRP to standard risk factors | 0.023 | 0.307 |
Discussion
An important unresolved question is the degree to which novel biomarkers, and for that matter standard risk factors, predict who will or will not have a CVD event. There is debate over the use of ROC curves, C-statistics, R-squared, measures of misclassification, or other methodologies to assess the independent incremental value of a given risk factor (18,19, 21–24). In fact, age and gender are the major drivers of risk equations in population-based studies (18), and if extant CVD is present that also serves as a major driver (25). Other variables, even potent risk factors, typically add only small amounts of additional discrimination (18). These data in PAD patients emphasize the importance of the follow-up time in this setting. Mortality rates were high, and at 2 years of follow-up, hs-CRP contributed in terms of prediction of total mortality. However, at full follow-up the standard risk markers dominated the C-statistic. Thus, the question of independent incremental contributors to the risk equation may depend on the baseline risk composition of the cohort and the length of the risk period in question.
Our hypothesis that inflammatory biomarkers, here hs-CRP, would show a stronger relation to short vs. longer-term mortality was strongly supported. The odds ratios at year 2 were attenuated substantially by an average of seven years of follow-up. None of the other biomarkers significantly predicted mortality.
In the Cardiovascular Health Study of older participants, a report employing a prospective nested case-control design found a stronger association of hs-CRP for earlier CVD events than latter, but significant results were limited to women with subclinical CVD at baseline (6). A recent report from the same cohort analyzing the entire group confirmed that hs-CRP predicted early CVD and total death (within 3 years) much stronger than latter deaths, but the results were stronger in men (10). In the Quebec Cardiovascular Study (men only), hs-CRP predicted CHD events only within two years of baseline, and only in men <56 years of age (8). In the Honolulu Heart Program (men only), hs-CRP predicted incident myocardial infarction primarily in participants <56 years of age, but this association lessened with long-term (15+ years) follow-up (9). In a study of PAD patients, SAA, hs-CRP and D-dimer all predicted CVD and total mortality in the first two years of follow-up, but only D-dimer showed an association at three years, and only for CVD mortality (11). None of the above studies utilized C statistics or measures of misclassification to quantify the additional discrimination provided by biomarkers. The Edinburgh Study indicated little additional contribution of individual biomarkers to ROC curves, but only presented data for the full follow-up (mean = 17 years) (3).
A recent study looked at 4 biomarkers, hs-CRP, troponin 1, NT-pro-BNP, and cystatin C in a cohort of elderly men with a median follow-up of 10 years (5). Each of these biomarkers independently contributed to CVD death, and the improvement in the C-statistic for these 4 biomarkers combined was greater in the whole cohort (0.102) than in the group free of disease at baseline (0.059). In contrast to our results and the several other studies (6, 8–11), they apparently did not see a time dependent relationship for hs-CRP, although results stratified by follow-up time were not presented.
In patients with PAD, mortality is primarily from CVD causes (12). The proportion of CVD death in our cohort is conservative, since we coded only the underlying cause of death. In fact, many “non-CVD deaths” had CVD causes listed as contributing, and for at least some other “non-CVD deaths“ unlisted CVD conditions likely contributed. Thus, in a PAD cohort total mortality is the most reliable outcome measure, and the apparent stronger association of hs-CRP with (short term) non-CVD vs. CVD mortality should be interpreted with caution.
Standard CVD risk factors generally showed significant associations with total and CVD mortality at full follow-up. In this elderly population with a heavy CVD burden, the vast majority of ever-smokers were ex-smokers, and this likely attenuated the results for the pack-years variable. The results for dyslipidemia were interesting. The strong association for CVD mortality at 2 and 7 years was balanced by a “protective“ effect at both short and longer term follow-up for “non-CVD deaths“, resulting in a null association for total mortality. Since the dyslipidemia variable was primarily high lipids, with treatment playing a lesser role, these data are consistent with the expected significant role for dyslipidemia in CVD mortality, and possible reduced lipid values from chronic illness leading to non-CVD mortality.
Our study has a number of limitations. First, the distinction between CVD and non-CVD mortality in this cohort is somewhat problematic. Thus, more confidence should be placed in the total mortality results, where the misclassification rate is near zero, than in the cause-specific results. Second, assessment of standard CVD risk factors is somewhat problematic given extensive treatment in this high-risk cohort. Nonetheless, CVD risk factors predicted CVD mortality. Third, we had a single baseline assessment of biomarkers, which may not have reflected earlier or later measures had they been available. However, such misclassification would have biased results toward the null, suggesting our results are likely conservative.
We conclude that a measures of inflammation, hs-CRP, was a strong predictor of short-term mortality in a PAD cohort, but that its predictive value diminished over time. Recent data suggest that elevations in hs-CRP result from the atherosclerotic process rather than cause it (26). Either way, elevated hs-CRP is a strong predictor of short-term risk and indicates PAD patients who should be receiving aggressive risk factor modification, including smoking cessation and lipid, hypertension, and anti-platelet therapy.
Acknowledgements
We thank Nova Rogers for assistance with manuscript formatting.
Funding Sources:
This research was supported by NIH grant HL42973, HIH-NCRR General Clinical Research Center Program Grant M01 RR00827, American Heart Association Grant-in-Aid No. 0050002N, and a small grant from Glaxo Smith Kline.
Footnotes
Publisher's Disclaimer: This is a PDF file of an unedited manuscript that has been accepted for publication. As a service to our customers we are providing this early version of the manuscript. The manuscript will undergo copyediting, typesetting, and review of the resulting proof before it is published in its final citable form. Please note that during the production process errors may be discovered which could affect the content, and all legal disclaimers that apply to the journal pertain.
Disclosures:
Dr Ridker is listed as a co inventor on patents held by the Brigham and Women's Hospital that relate to the use of inflammatory biomarkers in cardiovascular disease. The other authors report no conflicts.
References
- 1.Danesh J, Wheeler JG, Hirschfield GM, Eda S, Eiriksdottir G, Rumley A, et al. C-reactive protein and other circulating markers of inflammation in the prediction of coronary heart disease. N Engl J Med. 2004;350:1387–97. doi: 10.1056/NEJMoa032804. [DOI] [PubMed] [Google Scholar]
- 2.Ridker PM, Rifai N, Cook NR, Bradwin G, Buring JE. Non-HDL cholesterol, apolipoproteins A-I and B100, standard lipid measures, lipid ratios, and CRP as risk factors for cardiovascular disease in women. JAMA. 2005;294(3):326–33. doi: 10.1001/jama.294.3.326. [DOI] [PubMed] [Google Scholar]
- 3.Tzoulaki I, Murray GD, Lee AJ, Rumley A, Lowe GD, Fowkes FG. Relative value of inflammatory, hemostatic, and rheological factors for incident myocardial infarction and stroke: the Edinburgh Artery Study. Circulation. 2007;115(16):2119–27. doi: 10.1161/CIRCULATIONAHA.106.635029. [DOI] [PubMed] [Google Scholar]
- 4.Ridker PM. High sensitive C-reactive protein as a predictor of all-cause mortality: Implications for research and patient care. Clin Chem. 2008;54:234–7. doi: 10.1373/clinchem.2007.099465. [DOI] [PubMed] [Google Scholar]
- 5.Zethelius B, Berglund L, Sundström J, Ingelsson E, Basu S, Larsson A, et al. Use of multiple biomarkers to improve the prediction of death from cardiovascular causes. N Engl J Med. 2008;358:2107–16. doi: 10.1056/NEJMoa0707064. [DOI] [PubMed] [Google Scholar]
- 6.Tracy R, Lemaitre R, Psaty B, Ives G, Evans RW, Cushman M, et al. Relationship of C-reactive protein to risk of cardiovascular disease in the elderly. Arterioscler Thromb Vasc Biol. 1997;17:1121–7. doi: 10.1161/01.atv.17.6.1121. [DOI] [PubMed] [Google Scholar]
- 7.Cushman M, Lemaitre RN, Kuller LH, Psaty BM, Macy EM, Sharrett AR, et al. Fibrinolytic activation markers predict myocardial infarction in the elderly. The Cardiovascular Health Study. Arterioscler Thromb Vasc Biol. 1999;19:493–8. doi: 10.1161/01.atv.19.3.493. [DOI] [PubMed] [Google Scholar]
- 8.Pirro M, Bergeron J, Dagenais GR, Bernard P, Cantin B, Despres J, et al. Age and duration of follow-up as modulators of the risk for ischemic heart disease associated with high plasma C-reactive protein levels in men. Arch Intern Med. 2001;161:2474–80. doi: 10.1001/archinte.161.20.2474. [DOI] [PubMed] [Google Scholar]
- 9.Sakkinen P, Abbott RD, Curb JD, Rodriguez BL, Yano K, Tracy RP. C-reactive protein and myocardial infarction. J Clinical Epidemiol. 2002;55:445–51. doi: 10.1016/s0895-4356(01)00502-9. [DOI] [PubMed] [Google Scholar]
- 10.Jenny NS, Yanez ND, Psaty BM, Kuller LH, Hirsch CH, Tracy RP. Inflammation biomarkers and near-term death in older men. Am J Epidemiol. 2007;165:684–95. doi: 10.1093/aje/kwk057. [DOI] [PubMed] [Google Scholar]
- 11.Vidula H, Tian L, Liu K, et al. Biomarkers of inflammation and thrombosis as predictors of near-term mortality in patients with peripheral arterial disease: a cohort study. Ann Int Med. 2008;148:85–93. doi: 10.7326/0003-4819-148-2-200801150-00003. [DOI] [PMC free article] [PubMed] [Google Scholar]
- 12.Criqui MH, Langer RD, Fronek A, Feigelson HS, Klauber MR, McCann TJ, et al. Mortality over a period of 10 years in patients with peripheral arterial disease. N Engl J Med. 1992;326:381–6. doi: 10.1056/NEJM199202063260605. [DOI] [PubMed] [Google Scholar]
- 13.Bird CE, Criqui MH, Fronek A, Denenberg JO, Klauber MR, Langer RD. Quantitative and qualitative progression of peripheral arterial disease by non-invasive testing. Vascular Medicine. 1999;4:15–21. doi: 10.1177/1358836X9900400103. [DOI] [PubMed] [Google Scholar]
- 14.Shadman R, Allison MA, Criqui MH. Glomerular filtration rate and N-terminal pro-brain natriuretic peptide as predictors of cardiovascular mortality in vascular patients. J Am Coll Card. 2007;49:2172–81. doi: 10.1016/j.jacc.2007.02.047. [DOI] [PubMed] [Google Scholar]
- 15.Allison MA, Denenberg JO, Nelson JJ, Natarajan L, Criqui MH. The association between lipoprotein-associated phospholipase A2 and cardiovascular disease and total mortality in vascular medicine patients. J Vasc Surg. 2007;46:500–6. doi: 10.1016/j.jvs.2007.04.038. [DOI] [PMC free article] [PubMed] [Google Scholar]
- 16.Shadman R, Criqui MH, Bundens WP, Fronek A, Denenberg JO, Gamst AC, et al. Subclavian artery stenosis: prevalence, risk factors, and association with cardiovascular disease. J Am Coll Cardiol. 2004;44:618–23. doi: 10.1016/j.jacc.2004.04.044. [DOI] [PubMed] [Google Scholar]
- 17.Grambsch P, Therneau T. Proportional hazards tests and diagnostics based on weighted residuals. Biometrika. 1994;81:515–26. [Google Scholar]
- 18.Wang TJ, Gona P, Larson MG, Tofler GH, Levy D, Newton-Cheh C, et al. Multiple biomarkers for the prediction of first major cardiovascular events and death. N Engl J Med. 2006;355:2631–9. doi: 10.1056/NEJMoa055373. [DOI] [PubMed] [Google Scholar]
- 19.Pencina MJ, D'Agostino RB, Sr, D'Agostino RB, Jr, Vasan RS. Evaluating the added predictive ability of a new marker: from area under the ROC curve to reclassification and beyond. Stat Med. 2008;27:157–72. doi: 10.1002/sim.2929. discussion 207–12. [DOI] [PubMed] [Google Scholar]
- 20. SAS 9.1 for Windows, Copyright (c) 2002–2003 by SAS Institute Inc., Cary, NC, USA.
- 21.Ware JH. The limitations of risk factors as prognostic tools. N Engl J Med. 2006;355(25):2615–7. doi: 10.1056/NEJMp068249. [DOI] [PubMed] [Google Scholar]
- 22.Cook NR, Buring JE, Ridker PM. The effect of including C-reactive protein in cardiovascular risk prediction models for women. Ann Intern Med. 2006;145(1):21–9. doi: 10.7326/0003-4819-145-1-200607040-00128. [DOI] [PubMed] [Google Scholar]
- 23.Cook NR. Use and misuse of the receiver operating characteristic curve in risk prediction. Circulation. 2007;115:928–35. doi: 10.1161/CIRCULATIONAHA.106.672402. [DOI] [PubMed] [Google Scholar]
- 24.Ridker PM, Buring JE, Rifai N, Cook NR. Development and validation of improved algorithms for the assessment of global cardiovascular risk in women: the Reynolds Risk Score. JAMA. 2007;297(6):611–9. doi: 10.1001/jama.297.6.611. [DOI] [PubMed] [Google Scholar]
- 25.Pearte CA, Furberg CD, O'Meara ES, Psaty BM, Kuller L, Powe NR, et al. Characteristics and baseline clinical predictors of future fatal versus nonfatal coronary heart disease events in older adults: the Cardiovascular Health Study. Circulation. 2006;113:2177–85. doi: 10.1161/CIRCULATIONAHA.105.610352. [DOI] [PubMed] [Google Scholar]
- 26.Elliot P, Chambers JC, Zhang W, Clarke R, Hopewell JC, Peden JF, et al. Genetic Loci associated with C-reactive protein levels and risk of coronary heart disease. JAMA. 2009;302:37–48. doi: 10.1001/jama.2009.954. [DOI] [PMC free article] [PubMed] [Google Scholar]