

Abstract
Background
Pseudomnas putida is a natural producer of medium chain length polyhydroxyalkanoates (mcl-PHA), a polymeric precursor of bioplastics. A two-fold increase of mcl-PHA production via inactivation of the glucose dehydrogenase gene gcd, limiting the metabolic flux towards side products like gluconate was achieved before. Here, we investigated the overproduction of enzymes catalyzing limiting steps of mcl-PHA precursor formation.
Results
A genome-based in silico model for P. putida KT2440 metabolism was employed to identify potential genetic targets to be engineered for the improvement of mcl-PHA production using glucose as sole carbon source. Here, overproduction of pyruvate dehydrogenase subunit AcoA in the P. putida KT2440 wild type and the Δgcd mutant strains led to an increase of PHA production. In controlled bioreactor batch fermentations PHA production was increased by 33% in the acoA overexpressing wild type and 121% in the acoA overexpressing Δgcd strain in comparison to P. putida KT2440. Overexpression of pgl-encoding 6-phosphoglucolactonase did not influence PHA production. Transcriptome analyses of engineered PHA producing P. putida in comparison to its parental strains revealed the induction of genes encoding glucose 6-phosphate dehydrogenase and pyruvate dehydrogenase. In addition, NADPH seems to be quantitatively consumed for efficient PHA synthesis, since a direct relationship between low levels of NADPH and high concentrations of the biopolymer were observed. In contrast, intracellular levels of NADH were found increased in PHA producing organisms.
Conclusion
Production of mcl-PHAs was enhanced in P. putida when grown on glucose via overproduction of a pyruvate dehydrogenase subunit (AcoA) in combination with a deletion of the glucose dehydrogenase (gcd) gene as predicted by in silico elementary flux mode analysis.
Keywords: Medium chain length polyhydroxyalkanoate, Pseudomonas putida, Systems metabolic engineering, Pyruvate dehydrogenase, Glucose
Background
Metabolic engineering of microorganisms has significantly contributed to the biotechnological production of chemicals in a sustainable manner [1,2]. Insertion of heterologous pathways and modification of the host metabolism, via deletion or amplification of genes, has been a common procedure to enhance the synthesis of a desired compound [3,4]. Nevertheless, these modifications often evoke detrimental effects on the cell metabolism which lead to decreased growth and low performance of the constructed cell factory [2,3,5]. In silico reconstruction of the metabolism of bacterial production hosts in combination with metabolic flux modeling can help to design the optimal pathways towards a product of interest. Multiple efforts have been made to engineer microorganisms to obtain sustainable polymers which have the potential to replace petroleum-based plastics. In this regard, medium-chain-length polyhydroxyalkanoates (mcl-PHAs) are among the most promising biodegradable polymers synthesized by microorganisms which can be used in a wide range of applications [6]. Bacteria from the genus Pseudomonas are natural producers of mcl-PHAs since they have the entire machinery to synthesize these polyesters from different carbon sources (Figure 1) [7]. They accumulate these polymers as inclusion bodies in the cytoplasm promoted preferentially by a high carbon supply and the limitation of an inorganic nutrient such as nitrogen, oxygen, or phosphorous [8]. As other PHA-accumulating bacteria, Pseudomonas putida strains utilize PHAs as a reservoir of carbon and energy to cope with the changing environmental conditions of their natural habitats. For decades, studies for biotechnological mcl-PHA production focused on the use of fatty acid as carbon source [9-12]. This approach led to PHA accumulation in the cell, yielding more than 80% of its dry weight as PHA [13]. Additionally, engineering of the β-oxidation pathway in P. putida allowed for production of novel mcl-PHAs, which implies a broad range of applications in biomedicine and for biomaterials [10,14,15]. Much less attention has been given to the engineering of metabolic pathways involved in sugar or polyalcohol utilization in P. putida[16]. It was reported that inactivation of the isocitrate lyase gene resulted in a 1.7-fold increased production of mcl-PHA using gluconate as carbon source [17].
Figure 1.
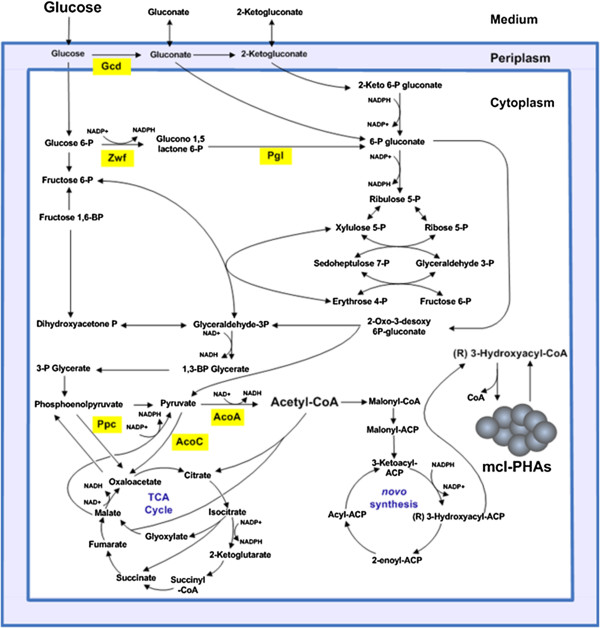
Central metabolism of P. putida KT2440. Enzymes of interest are indicated. Enzymatic steps with NAD+/NADP and NADP+/NADPH involvement are marked.
Different waste materials were tested as feedstock for PHA producing Pseudomonas species in order to reduce the overall production cost. Pseudomonas species accumulated mcl-PHAs when grown on sodium terephthalate produced from a PET pyrolysis, raw glycerol [18], polystyrene pyrolysis oil, and animal waste lipids [19]. Glucose is still one of the cheapest and most available feedstock for industrial polymer biosynthesis [20]. However, only small amounts of mcl-PHAs are currently synthesized utilizing glucose as carbon source [21,22]. Most metabolic approaches for the improvement of PHA production with glucose as carbon substrate were performed using Escherichia coli[23-25]. After cloning the PHA synthesis genes from Cupriavidus necator (formerly known as Ralstonia eutropha) into E. coli higher levels of NADPH versus NADP + were found essential to promote PHB synthesis. Consequently, bioengineering efforts on the rising of NADPH availability in turn to improve PHA synthesis on glucose were undertaken. Overproduction of glucose-6-phosphate dehydrogenase (G6PDH encoded by zwf) increased the intracellular NADPH levels and led to an increased accumulation of PHA by 41% [26]. A similar approach was carried out with C. necator, which resulted in an increased production of PHA in the presence of fructose [27]. It is known that Pseudomonas species prefer other carbon sources like organic acids and amino acids over glucose [28]. Consequently, our research focused on the development of P. putida strains which can accumulate high amounts of mcl-PHA on glucose as the sole carbon source. Recently, novel bioengineering approaches for an optimized production from glucose were undertaken [21]. Initially, a genome-based in silico model of the P. putida metabolism was established and used for the prediction of optimal fluxes towards PHA and its precursor molecules. Among a list of different genetic targets, elementary flux mode analysis suggested an inactivation of glucose dehydrogenase encoded by gcd to prevent undesired by-product formation and excretion. In agreement with the prediction from the in silico model the constructed P. putida Δgcd mutant strain showed an increased PHA production in batch [13] and Fed-Batch cultivations [29]. Here, we continued to experimentally verify the predictions of our in silico model for the optimization of mcl-PHA production in P. putida. We tested for the proposed positive impact of the overexpression of the genes for pyruvate dehydrogenase (acoA) and 6-phosphogluclactonase (pgl) on mcl-PHA production.
Results and discussion
Overexpression of the genes for the pyruvate dehydrogenase AcoA and 6-phosphoglucolactonase Pgl for improved PHA production
The acoA and pgl genes were separately cloned into the broad host range vector pSEVA424 and then transformed into the P. putida KT2440 and the Δgcd mutant strains. A list of all used strains, vectors and primers are summarized in Table 1. Wild type P. putida KT2440 and the corresponding Δgcd mutant strain carrying the vector without insert served as controls. Cells were grown in defined M9 mineral minimal medium supplemented with 20 (g/L) glucose and 62.5 μg/mL streptomycin as described in the Methods section. Protein production was induced at an initial OD600nm of 0.05. Cells were harvested after 60 hours by centrifugation prior to protein composition analyses and PHA-extraction and quantification. SDS-PAGE analysis was used to assess the overproduction of the AcoA and the Pgl proteins. Successful overproduction of AcoA (Mr = 35,000) and Pgl (Mr = 23,000) was observed, which is in good agreement to the deduced relative molecular mass of approximately 34,700 Da for AcoA and 25,500 Da for Pgl (Figure 2).
Table 1.
Bacterial strains, plasmids and primers used in this study
| Strains | Relevant features/genotype* | Source reference |
|---|---|---|
|
E. coli
|
|
|
| DH10b |
F-mcrA Δ(mrr-hsdRMS-mcrBC) Φ80dlacZΔM15 ΔlacX74endA1recA1deoRΔ(ara,leu)7697araD139 galUgalKnupGrpsL λ- |
Invitrogen |
| XL10-Gold |
endA1glnV44recA1thi-1gyrA96relA1lacHteΔ(mcrA)183 Δ(mcrCB-hsdSMR-mrr)173tetR F’[proABlacIqZΔM15 Tn10(TetR Amy CmR)] |
Stratagene |
| DH10b-acoA |
DH10b carrying the P. putida acoA gene cloned in pJET1.2 |
This study |
| DH10b-pgl |
DH10b carrying intermediate pgl gene cloned in pJET1.2 |
This study |
| XL10-Gold- acoA |
XL10-Gold harboring acoA overexpression vector pSEVAaco |
This study |
| XL10-Gold-pgl |
XL10-Gold harboring pgl overexpression vector pSEVApgl |
This study |
|
P. putida
|
|
|
| KT2440 |
Wild type |
DSMZ |
| KT2440-acoA |
KT2440 harboring acoA expression vector pSEVA424 |
This study |
| KT2440-pgl |
KT2440 harboring pgl expression vector pSEVA424 |
This study |
| KT2440Δgcd |
KT2440 carrying gcd mutation |
Poblete et al., 2013[21] |
| KT2440Δgcd- acoA |
KT2440 carrying the gcd knockout mutation harboring acoA overexpression vector pSEVAacoA |
This study |
| KT2440Δgcd-pgl |
KT2440 carrying the gcd knockout mutation harboring pgl overexpression vector pSEVApgl |
This study |
|
Plasmids |
|
|
| pJET1.2 |
Carrier vector, toxin expressed upon self-ligation, Apr |
Fermentas |
| pSEVA424 |
Expression vector for P. putida, IPTG-inducible, tac promoter, Smr |
De Lorenzo's Lab |
| pJET1.2-acoA |
Plasmid pJET1.2 carrying acoA gene for propagation, Apr |
This study |
| pJET1.2-pgl |
Plasmid pJET1.2 carrying pgl gene for propagation, Apr |
This study |
| pSEVA- acoA |
acoA overexpression vector, based on pSEVA424, Smr |
This study |
| pSEVA-pgl |
pgl overexpression vector, based on pSEVA424, Smr |
This study |
|
Primers |
|
|
|
acoAFw |
5´CCGGAATTCAGGAGG
AAAAACAT
ATGTCCAATCAACTCAGT3 |
This study |
|
acoARv |
5′TGCTCTAGAGCATCAGGGGTAGGCGACGTA3′ |
This study |
|
pglFw |
5´CCGGAATTCAGGAGG
AAAAACAT
ATGGGAGGGCGTGGTATG3 |
This study |
| pglRv | 5′TGCTCTAGAGCATCATGGGCACCAGTAGAT3′ | This study |
Apr = ampicillin resistance; Smr = streptomycin resistance.
¥Source the material was obtained from or reference. EcoRI and XbaI restriction sites are shown in italics. Shine Dalgarno (RBS) sequences are displayed in bold whereas the eight conserved nucleotides upstream the RBS are depicted in bold and italics.
Figure 2.
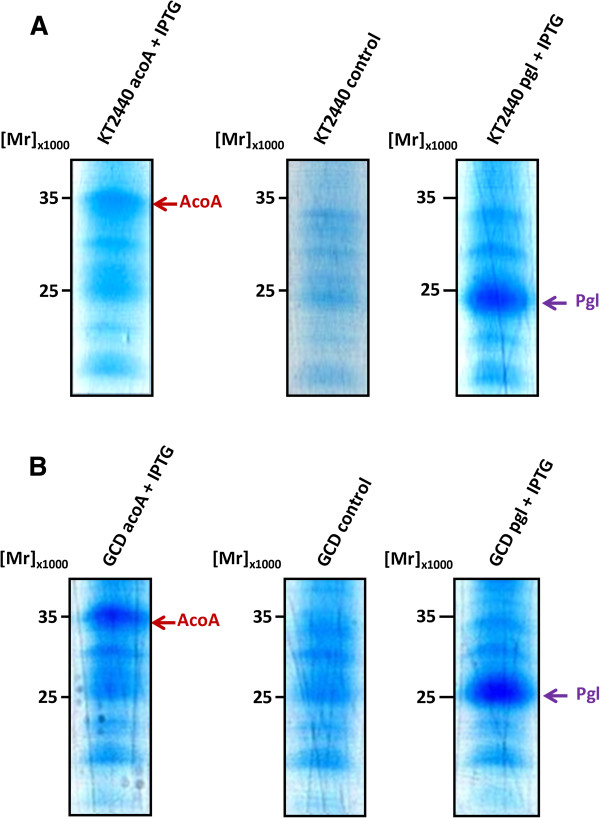
SDS-PAGE gels demonstrating the recombinant production of pyruvate dehydrogenase and 6-phosphogluconolactonase by the recombinant P. putida strains. (A) Shown the separations of whole cell protein extracts from KT2440 (lane 1), KT2440-acoA (lane 2), KT2440-pgl (lane 3), and (B) KT2440Δgcd (lane 4), KT2440Δgcd-acoA (lane 5) and KT2440Δgcd-pgl (lane 6).
Increased mcl-PHA production in P. putida by overexpression of the pyruvate dehydrogenase gene acoA
In order to evaluate the effect of acoA and pgl overexpression on PHA versus biomass production GC-MS analyses of the extracted PHA and biomass determination were performed (Figure 3). Triplicate aerobic cultures of P. putida strains KT2440 (wt), KT2440-acoA, KT2440-pgl, KT2440Δgcd, KT2440Δgcd-acoA, and KT2440Δgcd-pgl were tested. For this purpose, cells were grown in defined minimal medium for 60 hours until glucose as the sole carbon source was completely consumed (in all tested strains no glucose was detected via HPLC at 60 hours). As predicted by the in silico design the pyruvate dehydrogenase-producing KT2440-acoA and KT2440Δgcd-acoA mutant strains both showed an increased PHA content amassing 33.3 wt % and 42.1 wt % as mcl-PHA, respectively (Figure 3A). This was not the case for the phosphoglucolactonase-overproducing KT2440-pgl (25.7 wt %) and KT2440Δgcd-pgl (33.2 wt %) strains in which the PHA concentration remained at the basic level. In addition, no obvious major changes of the mcl-PHA momomer composition between the various producing P. putida strains were observed (Table 2). Next, the yield of biomass of engineered strains grown on glucose was determined. As initially desired, the biomass production of the various recombinant strains was found very similar to the one determined for the wild type P. putida KT2440 strain (Figure 3B).
Figure 3.

mcl-PHA (A) content and cell dry weight (B) of different metabolically engineered indicated P. putida strains.
Table 2.
Monomer composition of mcl-PHA produced by metabolically engineered P. putida strains in flask experiments
| Strain | C6 ∞ | C8 ∞ | C10 ∞ | C12 ∞ | C12:1 ∞ | C14 ∞ |
|---|---|---|---|---|---|---|
|
KT2440 |
n.d. |
11.8 ± 0.2 |
73.0 ± 0.1 |
4.7 ± 0.2 |
9.4 ± 0.7 |
0.8 ± 0.3 |
|
KT2440Δ
gcd
|
n.d. |
14.0 ± 0.4 |
71.1 ± 0.8 |
4.6 ± 0.9 |
8.5 ± 0.4 |
1.1 ± 0.2 |
|
KT2440-
acoA
|
n.d. |
13.0 ± 0.6 |
69.1 ± 1.2 |
3.4 ± 0.7 |
10.5 ± 0.2 |
3.9 ± 0.2 |
|
KT2440Δ
gcd-acoA
|
n.d. |
14.8 ± 0.7 |
70.2 ± 1.4 |
5.1 ± 0.3 |
8.8 ± 0.1 |
0.7 ± 0.3 |
|
KT2440-pgl |
n.d. |
12.2 ± 0.9 |
74.1 ± 1.5 |
3.8 ± 0.5 |
9.9 ± 0.8 |
n.d. |
| KT2440Δ gcd-pgl | n.d. | 14.6 ± 0.3 | 73.1 ± 0.8 | 3.7 ± 0.2 | 8.1 ± 0.5 | 0.5 ± 0.1 |
n.d.: not detected, less than 0.2%.
∞: The data were determined by GC/MS and are given as relative molar fraction (%) of C6: 3-hydroxyexanoate, C8: 3-hydroxyoctanoate, C10:3-hydroxydecanoate, C12: 3-hydroxydodecanoate, C12:1: 3-hydroxy-5-cis-dodecanoate, and C14: 3-hydroxytetradecanoate.
In summary, the most efficient PHA producer was KT2440Δgcd-acoA strain, where the PHA concentration was doubled compared to P. putida wild type strain (Figure 3A) and enhanced by 21% compared to the KT2440Δgcd mutant strain (Figure 3A). Thus, the predicted engineering strategy was successful in increasing the mcl-PHA synthesis of P. putida.
Batch fermentation in the bioreactors for controlled mcl-PHA production
To ensure well-controlled mcl-PHA production using our metabolically engineered P. putida strains, aerobic batch fermentations of the KT2440-acoA and KT2440Δgcd-acoA strains on glucose were performed in a bioreactor. Figure 4 shows the time-resolved measurements for mcl-PHA formation, biomass production and the corresponding concentrations of ammonium, gluconate, 2-ketogluconate, and glucose formation. As expected, the KT2440-acoA strain, gluconate and 2-ketogluconate were excreted into the medium during consumption of the available glucose (Figure 4A, Table 3). In contrast, during the fermentation of the flux optimized KT2440Δgcd-acoA strain (Figure 4B) excreted organic acids were below the detection limit (Table 3). A recent study compared mcl-PHA synthesis in P. putida KT2440 and KT2442 when grown on gluconate [30]. P. putida KT2440 accumulated 17% of its CDW as PHA, whereas KT2442 only synthesized 1.7 wt % as PHA, demonstrating the large differences between the two P. putida strains. P. putida KT2440 can re-consume gluconate and 2-ketogluconate once secreted to the medium. We recently demonstrated that this process is not efficient to improve mcl-PHA synthesis [29], resulting in a lower volumetric PHA productivity as compared to the one shown by the Δgcd P. putida mutant strain under the same growth conditions. Several investigations have shown that the volumetric productivity is the key parameter for the industrial production of PHAs and thus, any factor influencing this parameter affects the economics and cost competitiveness of PHAs synthesis via microbial fermentation [30-33]. Ammonium was completely consumed at 12 hours by the KT2440-acoA strain, while KT2440Δgcd-acoA took more than 15 hours to deplete the entire amount of nitrogen. In addition, a large proportion of carbon was directed towards gluconate in the KT2440-acoA strain. More than 5 g/L of gluconate was produced after 24 h, (Figure 4A). Furthermore, the lower biomass of 2 g/L obtained for this strain prior ammonium limitation was most likely due to the increased production of cellular compounds including nucleic acids and proteins due to less PHA formation. These findings might explain the reduced PHA and biomass yield on glucose in comparison to the KT2440Δgcd-acoA mutant strain. The genetic modification of the KT2440Δgcd-acoA led to the lowest μmax of all strains (0.25 h-1 versus 0.56 h-1 for KT2440). Nevertheless, the KT2440Δgcd-acoA strain biomass (CDW = 4.71 g/L after 50 hrs) and mcl-PHA 42.1 wt % contents were higher in comparison to the KT2440-acoA strain (CDW = 3.63 g/L after 50 hrs and mcl-PHA = 33.3 wt %). To our knowledge this is the highest mcl-PHA accumulation ever reported using a P. putida strain in the presence of glucose in batch cultures.
Figure 4.
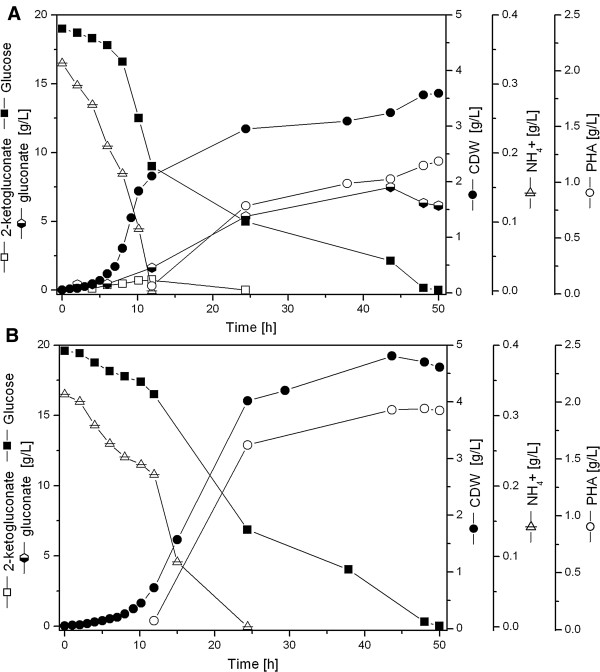
Growth and mcl-PHA production of the metabolically engineered strains KT2440-acoA (A) and KT2440Δ gcd- acoA (B) in batch cultures. Cells were grown in lab scale bioreactor in the presence of glucose 18.5 (g/L). Data are presented as mean values obtained from two independent experiments.
Table 3.
Physiological parameters of the wild type P. putida KT2440 and metabolically engineered strains in batch culture grown with of glucose
| Strain | μ max (h -1 ) | Y X/S § (g/g) | Y 2-ketoglut/S (g/g) | Y gluconate/S (g/g) | Y PHA/S (g/g) |
|---|---|---|---|---|---|
|
KT2440 |
0.56 |
0.22 |
<0.001 |
0.64 |
0.05 |
|
KT2440Δ
gcd
|
0.42 |
0.23 |
<0.001 |
<0.001 |
0.08 |
|
KT2440-
acoA
|
0.40 |
0.21 |
0.04 |
0.38 |
0.07 |
|
KT2440Δ
gcd-acoA
|
0.25 |
0.25 |
<0.001 |
<0.001 |
0.11 |
|
KT2440
-pgl
|
0.33 |
0.21 |
0.07 |
0.55 |
0.05 |
| KT2440Δ gcd-pgl | 0.21 | 0.24 | <0.001 | <0.001 | 0.08 |
§ Yx/s is calculated based on the total biomass concentration (true biomass + PHA content). Standard deviations of less than 10% were obtained in 3 independent experiments.
Transcriptome analysis of the engineered P. putida PHA production strains
Glucose is metabolized in P. putida that utilizes three pathways converging at the level of 6-phosphogluconate prior to the formation of 2-keto-3-deoxy-6-phosphogluconate (KDPG; [34]). The repressor HexR regulates the expression of major genes of the pathway including the zwf-1, pgl, eda operon and the gap1 gene encoding glyceraldehyde-3-phosphate dehydrogenase. Accumulation and binding of KDPG to HexR lead to derepression [35-37]. Furthermore, the genes of PHA synthesis are subjected to a complex control by catabolite regulation and various stress responses mediated by the complex RNA-dependent GacS and Crc regulating systems, besides others [38-40]. In order to understand the gene regulatory adaptation of the newly engineered strains to enhanced PHA production the gene expression compared to the parental strains was analyzed using next generation sequencing of transcripts (RNASeq). We are fully aware that major adaptation processes might take place at the level of enzyme regulation which cannot be made visible with the employed approach. Samples were taken after 60 hours of cultivation, when the PHA concentration in the cell reached its highest level. Strict cut-off parameters (log change > 2 and a p-value < 0.05) were applied. First, the gene expression of acoA overexpressing strains was compared to the wild type KT2440 strain and the KT2440Δgcd mutant strain (Table 2). Overall, 53 open reading frames (ORFs) were found differentially transcribed (12 up-regulated and 41 down-regulated) between the KT2440 wild type strain with or without overexpressed acoA. Moreover, 108 ORFs (59 up-regulated and 49 down-regulated) were found changed in their transcriptome between the KT2440Δgcd strain with or without overexpressed acoA. As expected, the strongest up-regulated gene in both variant strains overexpressing acoA was PP_0555 (acoA). Interestingly, also PP_0554 (acoB) was found upregulated, however to a lesser extent (Table 4). Most of the genes encoding for enzymes related to the central and PHA synthesis metabolic pathways showed only slight variations in their expression levels (Table 4). Interestingly, the increased flux toward acetyl-CoA and as a consequence citrate induced the expression of the isocitrate lyase gene, which encodes the first enzyme of the glyoxylate shunt. One metabolic consequence is a reduced NADH production in the TCA cycle. A second consequence might be the channeling of acetyl-CoA into the glyoxylate cycle. In agreement, it was previously shown that inactivation of the isocitrate lyase gene leads to increased PHA production [17]. Overall, the gene expression data do not provide conclusive explanations for the observed increase in PHA production. Most likely regulatory effects at the enzyme level might be responsible.
Table 4.
Expression profile of the genes belonging to PHA biosynthesis and central metabolic pathways in the metabolically engineered P. putida strains compared to their parental strains
|
Gene name |
Locus tag |
Description |
Fold change
§
|
|
|---|---|---|---|---|
| Δ gcd-acoA | KT2440-acoA | |||
|
PHA synthesis |
|
|
|
|
|
phaI |
PP5008 |
PHA granule-associated |
0.7 |
0.9 |
|
phaF |
PP5007 |
PHA granule-associated |
-0.3 |
0.2 |
|
phaC1 |
PP5003 |
PHA polymerase |
-0.2 |
0.7 |
|
phaC2 |
PP5005 |
PHA polymerase |
-0.6 |
-0.2 |
|
phaZ |
PP5004 |
PHA depolymerase |
0.3 |
0.5 |
|
phaD |
PP5006 |
Transcriptional regulator |
-0.4 |
0.3 |
|
phaG |
PP1408 |
Acyl-transferase |
1.5 |
-0.1 |
|
Transporters |
|
|
|
|
|
oprB-1 |
PP1019 |
Porin |
-0.7 |
-1.0 |
|
oprB-2 |
PP1445 |
Porin |
-0.5 |
-0.6 |
|
Glycolysis/gluconeogenesis |
|
|
|
|
|
glk |
PP1011 |
Glucokinase |
0.2 |
-0.2 |
|
pgi |
PP1808 |
Glucose-6-phosphate isomerase |
-0.5 |
0.0 |
|
fbp |
PP5040 |
Fructose-1,6-bisphosphatase |
0.6 |
0.4 |
|
fda |
PP4960 |
Fructose-1,6-bisphosphate aldolase |
0.9 |
0.1 |
|
tpiA |
PP4715 |
Triosephosphate isomerase |
0.8 |
0.6 |
|
gap1 |
PP1009 |
GAP dehydrogenase, type I |
-1.2 |
-0.4 |
|
gap2 |
PP2149 |
GAP dehydrogenase, type II |
0.2 |
0.3 |
|
pgk |
PP4963 |
Phosphoglycerate kinase |
0.2 |
0.1 |
|
pgm |
PP5056 |
Phosphoglyceromutase |
0.4 |
0.1 |
|
eno |
PP1612 |
Phosphopyruvate hydratase |
0.3 |
0.0 |
|
pyk |
PP1362 |
Pyruvate kinase |
-0.3 |
0.4 |
|
Pentose phosphate pathways |
|
|
|
|
|
zwf1 |
PP1022 |
G6P dehydrogenase |
0.9 |
0.2 |
|
zwf2 |
PP4042 |
|
0.1 |
-0.3 |
|
zwf3 |
PP5351 |
|
0.2 |
0.4 |
|
pgl |
PP1023 |
6-phosphogluconate dehydrogenase |
0.5 |
-0.9 |
|
gnd |
PP4043 |
6-phosphoglucolacto dehydrogenase |
-0.6 |
-0.1 |
|
gnuK |
PP3416 |
Carbohydrate kinase |
-1.1 |
-0.6 |
|
kguK |
PP3378 |
Dehydroglucokinase |
0.45 |
-0.4 |
|
kguD |
PP3376 |
2-Ketogluconate 6-phosphate reductase |
-0.7 |
-0.5 |
|
rpiA |
PP5150 |
Ribose-5-phosphate isomerase A |
0.3 |
0.0 |
|
rpe |
PP0415 |
Ribulose-phosphate 3-epimerase |
-0.5 |
-0.1 |
|
tktA |
PP4965 |
Transketolase |
0.3 |
0.7 |
|
tal |
PP2168 |
Transaldolase B |
0.4 |
0.3 |
|
Entner-Doudoroff pathway |
|
|
|
|
|
edd |
PP1010 |
6-Phosphogluconate dehydratase |
-0.3 |
-0.3 |
|
eda |
PP1024 |
KDPG aldolase |
0.0 |
-0.5 |
|
Pyruvate metabolism |
|
|
|
|
|
acoA |
PP0555 |
Pyruvate dehydrogenase |
12.4 |
5.3 |
|
acoB |
PP0554 |
Pyruvate dehydrogenase |
1.5 |
1.0 |
|
acoC |
PP0553 |
Pyruvate dehydrogenase |
0.7 |
0.7 |
| |
PP0545 |
Aldehyde dehydrogenase |
0.1 |
-1.0 |
|
acsA |
PP4487 |
Acetyl-CoA synthetase |
0.8 |
1.4 |
|
accC-2 |
PP5347 |
Pyruvate carboxylase |
0.5 |
0.2 |
|
ppsA |
PP2082 |
Phosphoenolpyruvate synthase |
0.5 |
0.4 |
|
ppc |
PP1505 |
Phosphoenolpyruvate carboxylase |
0.5 |
0.4 |
|
TCA cycle |
|
|
|
|
|
gltA |
PP4194 |
Citrate synthase |
0.7 |
0.7 |
|
acnA |
PP2112 |
Aconitate hydratase |
0.4 |
-0.4 |
|
acnB |
PP2339 |
Aconitate hydratase |
0.7 |
0.3 |
|
icd |
PP4011 |
Isocitrate dehydrogenase |
0.3 |
-0.5 |
|
sucA |
PP4189 |
2-Oxoglutarate dehydrogenase |
-0.7 |
-0.2 |
|
sucD |
PP4185 |
Succinyl-CoA synthetase sub alpha |
-0.1 |
-0.3 |
|
sucC |
PP4186 |
Succinyl-CoA synthetase sub beta |
0.2 |
0.3 |
|
sdhA |
PP4191 |
Succinate dehydrogenase |
0.3 |
0.4 |
|
fumC |
PP0944 |
Fumarate hydratase |
0.5 |
-1.1 |
|
mdh |
PP0654 |
Malate dehydrogenase |
-0.4 |
-1.3 |
|
Glyoxylate shunt |
|
|
|
|
|
aceA |
PP4116 |
Isocitrate lyase |
2.9 |
1.3 |
| glcB | PP0356 | Malate synthase | 0.8 | 0.8 |
§Bold numbers represent a differentiated gene expression pattern.
Next, the pgl overexpressing strains without increased PHA production were analyzed for potential compensatory gene regulatory activities. Of the 86 ORFs differentially expressed in KT2440-pgl mutant strain compared to the wild type strain, 77 corresponded to genes that were transcriptionally up-regulated, whereas 9 genes were found with decreased expression levels (Table 5). For KT2440Δgcd-pgl mutant strain compared to the KT2440Δgcd mutant, 15 genes were found down-regulated while 117 ORFs were found induced. As expected, the pgl overexpressing strains revealed an increase of pgl mRNA. Glucose 6-phosphate dehydrogenase (encoded by PP_1022, zwf) was found to be highly up-regulated (>12 fold) in both strains harboring the overexpression system (Table 5). Obviously, the initial goal to enhance the flux from glucose toward KDPG was achieved. The increased amounts of the metabolite might have enhanced zwf-1 expression via HexR derepression. Furthermore, expression differences were detected for the pyruvate metabolism, where the genes encoding pyruvate dehydrogenase (PP_0554), pyruvate carboxylase (PP_5347) and phosphoenoylpyruvate (PP_1505) showed differential expression levels (Table 5). At least for the wild type strain harboring the overexpressed pgl a problematic rearrangement of pyruvate metabolization occurred which might be responsible for the observed production phenotype. While the pyruvate dehydrogenase gene acoA was found reduced, the pyruvate carboxylase gene acoC-2 was found induced (Table 5). In addition, induction of the phosphoenolpyruvate carboxylase gene ppc was detected. The KT2440Δgcd mutant carrying overexpressed pgl did not reveal this response. For the pgl overexpression the observed gene regulatory response provides reasonable explanations for the observed PHA production phenotype.
Table 5.
Expression profile of the genes belonging to PHA biosynthesis and central metabolic pathways in the metabolically engineered strains compared to their parental strains
|
Gene name |
Locus tag |
Description |
Fold change
§
|
|
|---|---|---|---|---|
| Δ gcd-pgl | KT2440 -pgl | |||
|
PHA synthesis |
|
|
|
|
|
phaI |
PP5008 |
PHA granule-associated |
0.6 |
-0.3 |
|
phaF |
PP5007 |
PHA granule-associated |
0.3 |
-0.4 |
|
phaC1 |
PP5003 |
PHA polymerase |
-0.8 |
-0.1 |
|
phaC2 |
PP5005 |
PHA polymerase |
-0.7 |
-0.4 |
|
phaZ |
PP5004 |
PHA depolymerase |
-0.4 |
0.0 |
|
phaD |
PP5006 |
Transcriptional regulator |
0.2 |
0.1 |
|
phaG |
PP1408 |
Acyl-transferase |
2.1 |
0.2 |
|
Transporters |
|
|
|
|
|
oprB-1 |
PP1019 |
Porin |
0.4 |
-0.1 |
|
oprB-2 |
PP1445 |
Porin |
-0.4 |
-0.4 |
|
Glycolysis/gluconeogenesis |
|
|
|
|
|
glk |
PP1011 |
Glucokinase |
0.3 |
0.2 |
|
pgi |
PP1808 |
Glucose-6-phosphate isomerase |
-0.4 |
0.0 |
|
fbp |
PP5040 |
Fructose-1,6-bisphosphatase |
0.3 |
-0.1 |
|
fda |
PP4960 |
Fructose-1,6-bisphosphate aldolase |
0.6 |
-0.1 |
|
tpiA |
PP4715 |
Triosephosphate isomerase |
0.4 |
0.5 |
|
gap1 |
PP1009 |
GAP dehydrogenase, type I |
-0.4 |
-0.2 |
|
gap2 |
PP2149 |
GAP dehydrogenase, type II |
-0.3 |
-0.2 |
|
pgk |
PP4963 |
Phosphoglycerate kinase |
0.1 |
0.0 |
|
pgm |
PP5056 |
Phosphoglyceromutase |
0.5 |
-0.3 |
|
eno |
PP1612 |
Phosphopyruvate hydratase |
0.5 |
0.1 |
|
pyk |
PP1362 |
Pyruvate kinase |
-0.5 |
0.6 |
|
Pentose phosphate pathways |
|
|
|
|
|
zwf1 |
PP1022 |
G6P dehydrogenase |
5.2 |
3.6 |
|
zwf2 |
PP4042 |
|
0.2 |
-0.6 |
|
zwf3 |
PP5351 |
|
-0.1 |
-0.3 |
|
pgl |
PP1023 |
6-phosphogluconate dehydrogenase |
9.3 |
7.8 |
|
gnd |
PP4043 |
6-phosphoglucolacto dehydrogenase |
0.2 |
-0.3 |
|
gnuK |
PP3416 |
Carbohydrate kinase |
-0.1 |
0.3 |
|
kguK |
PP3378 |
Dehydroglucokinase |
0.6 |
0.5 |
|
kguD |
PP3376 |
2-Ketogluconate 6-phosphate reductase |
0.1 |
-0.1 |
|
rpiA |
PP5150 |
Ribose-5-phosphate isomerase A |
0.3 |
-0.4 |
|
rpe |
PP0415 |
Ribulose-phosphate 3-epimerase |
0.2 |
-0.1 |
|
tktA |
PP4965 |
Transketolase |
0.7 |
0.3 |
|
tal |
PP2168 |
Transaldolase B |
0.2 |
0.1 |
|
Entner-Doudoroff pathway |
|
|
|
|
|
edd |
PP1010 |
6-Phosphogluconate dehydratase |
0.2 |
0.1 |
|
eda |
PP1024 |
KDPG aldolase |
0.4 |
-0.2 |
|
Pyruvate metabolism |
|
|
|
|
|
acoA |
PP0555 |
Pyruvate dehydrogenase |
1.3 |
-2.7 |
|
acoB |
PP0554 |
Pyruvate dehydrogenase |
0.7 |
-0.8 |
|
acoC |
PP0553 |
Pyruvate dehydrogenase |
0.5 |
-1.2 |
| |
PP0545 |
Aldehyde dehydrogenase |
0.5 |
-0.9 |
|
acsA |
PP4487 |
Acetyl-CoA synthetase |
-0.3 |
-0.6 |
|
accC-2 |
PP5347 |
Pyruvate carboxylase |
0.8 |
2.3 |
|
ppsA |
PP2082 |
Phosphoenolpyruvate synthase |
0.2 |
-0.1 |
|
ppc |
PP1505 |
Phosphoenolpyruvate carboxylase |
0.0 |
1.4 |
|
TCA cycle |
|
|
|
|
|
gltA |
PP4194 |
Citrate synthase |
-0.2 |
0.7 |
|
acnA |
PP2112 |
Aconitate hydratase |
0.8 |
-0.5 |
|
acnB |
PP2339 |
Aconitate hydratase |
-0.2 |
0.3 |
|
icd |
PP4011 |
Isocitrate dehydrogenase |
-0.3 |
-0.3 |
|
sucA |
PP4189 |
2-Oxoglutarate dehydrogenase |
-0.6 |
0.2 |
|
sucD |
PP4185 |
Succinyl-CoA synthetase sub alpha |
-0.2 |
0.5 |
|
sucC |
PP4186 |
Succinyl-CoA synthetase sub beta |
-0.1 |
0.1 |
|
sdhA |
PP4191 |
Succinate dehydrogenase |
-0.7 |
0.3 |
|
fumC |
PP0944 |
Fumarate hydratase |
1.1 |
-0.4 |
|
mdh |
PP0654 |
Malate dehydrogenase |
0.8 |
-0.8 |
|
Glyoxylate shunt |
|
|
|
|
|
aceA |
PP4116 |
Isocitrate lyase |
1.2 |
-1.1 |
| glcB | PP0356 | Malate synthase | -0.4 | -0.1 |
p-value < 0.05.
§Bold numbers represent a differentiated gene expression pattern.
The role of NADPH and NADH in P. putida PHA production
The production of mcl-PHAs in P. putida KT2440 requires NADPH + H+. P. putida catabolizes glucose via the Entner-Doudoroff pathway and hence the NADPH + H+ producing glucose-6-phosphate dehydrogenase (Zwf) is highly active. However, the attempts to further increase the metabolic flux through this step by overproducing the rate-limiting, succeeding enzyme (Pgl) failed to increase PHA production (Figure 1). However, the flux of carbon towards PHA was most likely hampered at the pyruvate metabolization step in the pgl overexpression strain. Interestingly, the transcriptome analyses revealed an increased zwf gene expression. In order to determine the contribution of the NADPH + H+ level in P. putida to PHA production, NADPH + H+ versus NADP+ levels were determined for the various bioengineered strains (Table 6). The ratios of NADPH to NADP+ were measured using UV/Vis spectrometry and quantified according to their colorimetric changes at λ = 450 nm. At the maximum mcl-PHA accumulation in the cell (60 h culture), we found the NADPH/NADP+ ratios of all the PHA-overproducing strains were lower compared to the corresponding wild type P. putida KT2440 (Table 6). Clearly, the employed metabolic engineering strategy increased the polyester production in both strains (Table 3, Figure 3). As a consequence of this increased flux of carbon into PHA synthesis, more NADPH is needed to turn 3-ketoacyl-ACP into (R)-3-hydroxyacyl-ACP (Figure 1). Therefore, the levels of NADPH/NADP+ were lower for the engineered P. putida strains (Table 6), in which pyruvate dehydrogenase was overproduced. A totally different picture was observed for the strains in which the pgl gene was overexpressed. Here, an increase of the NADPH/NADP+ levels was detected (Table 6). As already deduced from the transcriptome data, the initial flux through the Entner-Doudoroff pathway might have been induced, leading to a KDPG accumulation and an increased zwf-1 expression. Consequently, sufficient NADPH was produced. However, the increased flux of carbon towards PHA was lost at least in one case at the pgl overexpression strains. Overall, gene and most likely enzyme activity regulatory phenomena prohibited further flux towards PHA production and resulted in increased NADPH + H+ levels.
Table 6.
Levels of the NAD + , NADH, NADP + , and NADPH cofactors and their ratios of various P. putida strains under PHA producing conditions
|
Strain |
|
Cofactor level (mmol/g rCDW)* |
Cofactor ratio |
|||
|---|---|---|---|---|---|---|
| NAD + | NADH | NADP + | NADPH | NADH/NAD + | NADPH/NADP + | |
| KT2440 |
7.62 ± 0.86 |
0.67 ± 0.08 |
3.22 ± 0.38 |
2.67 ± 0.07 |
0.09 |
0.83 |
| KT2440Δgcd |
6.01 ± 0.67 |
1.75 ± 0.36 |
4.49 ± 0.12 |
1.31 ± 0.32 |
0.30 |
0.29 |
| KT2440-acoA |
6.25 ± 0.42 |
2.02 ± 0.15 |
6.48 ± 0.48 |
0.87 ± 0.27 |
0.32 |
0.13 |
| KT2440Δgcd-acoA |
6.88 ± 0.33 |
2.94 ± 0.15 |
3.98 ± 0.46 |
0.96 ± 0.36 |
0.43 |
0.24 |
| KT2440-pgl |
5.59 ± 0.14 |
1.82 ± 0.10 |
2.58 ± 0.40 |
3.07 ± 0.41 |
0.33 |
1.19 |
| KT2440Δgcd-pgl | 10.81 ± 0.50 | 2.18 ± 0.38 | 2.30 ± 0.15 | 3.71 ± 1.23 | 0.20 | 1.62 |
*rCDW: residual cell dry weight.
By overproducing the AcoA subunit of the pyruvate dehydrogenase complex, there was a significant change on NADH/NAD+ values in comparison to those found in their parental strains (Table 6). P. putida strains with high PHA production revealed high NADH/NAD+ ratio values. It was shown before that intracellular NADH concentrations are crucial for cell growth [41,42]. Similar observations of the importance of the NADH/NAD+ ratio for PHA synthesis from fatty acids in P. putida were published before [43-45].
Conclusion
We successfully continued our in silico metabolic modeling based approach for the improvement of PHA formation in P. putida. The predicted overexpression of the pyruvate dehydrogenase subunit gene acoA in combination with the deletion of the glucose dehydrogenase gene gcd resulted in an increase of PHA production by 120%. Potential explanation for the observed PHA production phenotypes were derived from gene expression and cofactor quantification analyses. Beyond this work on microbial biopolymer production, in silico based metabolic engineering has proven truly valuable for succinate [46], 1,4 butandiol [47], bio-ethanol [48], and amino acids [49,50], suggesting this strategy as highly promising to breed superior producers industrial biotechnology.
Methods
Bacterial strains
Pseudomonas putida KT2440 (DSMZ, Braunschweig, Germany) as wild type strain and the gene knock-out mutants P. putida Δgcd[21] were used in this study (Table 1). E. coli strain DH10b (Invitrogen, Darmstadt, Germany) was employed for the amplification of pJET1.2 derivatives (Promega, Darmstadt, Germany). E. coli XL10-Gold (Stratagene, Waldbronn, Germany) was used for replication of the pSEVA plasmids (pSEVA424, pSEVA-pgl and pSEVA-acoA). The pSEVA plasmids constitute a series of low-copy plasmids for the isopropyl 1-thio-β-D-galactopyranoside (IPTG) inducible overexpression of target genes [51]. Transformation of the P. putida strains was accomplished via electroporation applying a voltage of 2.5 V, 200 Ω and 25 μF, while E.coli DH10b was transformed as previously described [52]. P. putida KT2440 and its Δgcd mutant were transformed with the plasmids pSEVA-acoA and pSEVA-pgl encoding the pyruvate dehydrogenase subunit A (AcoA) and 6-phosphogluconolactonase (Pgl), respectively.
Genetic techniques and construction of bacterial strains
The 978 bp acoA and 729 bp pgl genes were PCR amplified using primer pairs acoAFw/acoARv and pglFw/pglRv, respectively. Used primers sequences are listed in Table 1. The forward primers (acoA/Fw, pgl/Fw) of both genes encoded an EcoRI restriction site, a consensus Ribosomal Binding Site (RBS) sequence (AGGAGG), eight conserved nucleotides downstream (AAAAACAT) and 18 nucleotides from the gene of interest [51]. Both reverse primers (acoA/Rv, pgl/Rv) encoded an XbaI restriction site and the last 18 nucleotides of target gene sequences (Table 1). Amplified genes were cloned into pJET1.2 resulting in pJET1.2-acoA and pJET1.2-pgl, respectively. The cloned genes were excised from their host vectors via EcoRI and XbaI restriction and subsequently cloned into the EcoRI-XbaI sites of pSEVA424 resulting in pSEVA-pgl and pSEVA-acoA, respectively.
Shake flask cultivation
P. putida strains were kept as frozen stock in 25% glycerol at -80°C. Prior to inoculation they were streaked on Luria Bertani agar plates and incubated for one day at 30°C. Single colonies were then picked from the plate and inoculated in 50 mL shake flasks containing 10 ml LB and incubated overnight under aerobic conditions at 30°C and shaking at 180 rpm. To start the PHA-producing process 1 L baffled shake flasks containing 200 mL of defined culture medium were inoculated to an initial OD595 of 0.05 and placed in a rotary shaker (180 rpm) under aerobic conditions at 30°C. Each culture was carried out by triplicate. P. putida strains were grown in a defined M9 mineral medium consisting of per liter 12.8 g Na2HPO4.7H2O, 3 g KH2O4, 1 g NH4Cl, and 0.5 g NaCl. This basic solution was autoclaved and subsequently supplemented with 0.12 g of MgSO4.H2O and a trace element solution made of: 6.0 mg/L FeSO4.7H2O, 2.7 mg/L CaCO3, 2.0 mg/L ZnSO4.H2O, 1.16 mg/L MnSO4.H2O, 0.37 mg/L CoSO4.7H2O, 0.33 mg/L CuSO4.5H2O, 0.08 mg/L H3BO3, and 20 g/L glucose (all filter-sterilized). Antibiotics were 62.5 μg/mL streptomycin (Sm) for E. coli XL10-Gold, 100 μg/mL streptomycin for P. putida strains and 100 μg/mL ampicillin (Ap) for E. coli DH10b.
Bioreactor fermentations
P. putida strains were grown in M9 medium supplemented with 18.5 g/L glucose, and antibiotic as required. Bioreactor batch fermentations were carried out in a 2 L top-bench BIOSTAT B1 bioreactor (Sartorius B Systems GmbH, Melsungen, Germany) with a working volume of 1.5 L, at 30°C. The aeration rate was set to 500 mL L-1 min-1 using a mass flow controller (PR4000, MKS Instruments, Wilmington, MA, USA). The dissolved oxygen level was kept above 20% air saturation by control of the agitation speed up to a maximum of 900 rpm. The pH was maintained at 7.0 by automatic pH controlled addition of 500 mM H2SO4 or 1 M of KOH.
Cell growth was monitored via OD measurements at 600 nm (Ultraspec 2000, Hitachi, Japan). The cell dry weight was determined gravimetrically after harvesting bacteria from 10 mL culture broth for 10 min at 4°C and 10,000 rpm (Eppendorf 5810 R, Hamburg, Germany), washing with distilled water, and drying of the obtained pellet at 100°C. The ammonium concentration in cell-free extracts was measured by a photometric test (LCK 303 kit, Hach Lange, Danaher, USA). The glucose concentration in the cultivation supernatant was analyzed after appropriate dilution by HPLC chromatography (HPLC Agilent 1260, Agilent, Krefeld, Germany) through an 8 mm Rezex ROA-organic acid H column (Phenomenex, USA) at a flow rate of 0.5 mL · min-1 at 65°C using 0.013 N H2SO4 as the mobile phase, followed by detection using a RID detector (Agilent series1260). Gluconate and 2-keto-gluconate were quantified by HPLC chromatography using an Aminex HPX 87 H column (Biorad, Hercules, CA, USA) on a Hitachi HPLC system (Hitachi Elite LaChrom, Krefeld, Germany) and 12.5 mM H2SO4 as the mobile phase at a flow rate of 0.5 mL min-1 at 45°C. Compounds were quantified by UV detection at 220 nm.
PHA characterization and quantification
Composition analyses of the polymer produced and cellular PHA content concentration determination were performed by gas chromatography (GC) and mass spectrometry (MS) of the methanolyzed polyester. For PHA production corresponding P. putida strains were streaked on LB agar plates and incubated for one day at 30°C. Single colonies were then picked from the plate, inoculated in a 50 mL shake flask containing 10 mL of the above described medium and incubated overnight under aerobic conditions at 30°C and 180 rpm (Innova, Enfield, USA). To begin the PHA-accumulating process, 1 L baffled shake flasks containing 200 mL of culture medium were inoculated at an initial OD595nm of 0.05 and incubated under aerobic conditions at 30°C. Subsequently, 10 mL of the culture were centrifuged for 10 min at 4°C and 9,000 x g, followed by a washing step with distilled water and lyophilization. Methanolysis was carried out by suspending 5 – 10 mg of lyophilized cell pellet in 2 mL of chloroform and 2 mL of methanol containing 15% sulfuric acid and 0.5 mg · mL-1 3-methylbenzoic acid as internal standard. Incubation followed at 100°C for 4 h. After cooling, 1 mL of demineralized water was added. The organic phase containing the resulting methyl esters of the monomers of the polymers of interest were analyzed by GC-MS on a Varian GC-MS system 450GC/240MS ion trap mass spectrometer operated by the software MS Workstation 6.9.3 (Varian Inc., Agilent Technologies, Böblingen, Germany). For this purpose, 1 mL of the organic phase was injected into the gas chromatograph at a split ratio of 1:10. Separation of the analytes of interest (i.e. the methyl esters of 3-hydroxyexanoate, 3-hydroxyoctanoate, 3-hydroxydecanoate, 3-hydroxydodecanoate, 3-hydroxy-5-cis-dodecanoate, 3-hydroxytetradecanoate) was achieved by chromatography through a FactorFour VF-5 ms capillary column (30 m X 0.25 mm i.d. X 0.25 mm film thickness). Helium was used as carrier gas at a flow rate of 0.9 mL · min-1. The injector and transfer line temperature were 275°C and 300°C, respectively. The temperature program was: initial temperature 40°C for 2 min, then from 40°C up to 150°C at a rate of 5°C min-1 and finally up to 280°C at a rate of 10°C min-1. Positive ions were obtained using electron ionization at 70 eV. The mass spectra were generated by scanning ions of m/z 50 to m/z 650. The PHA content (%wt) was defined as the percentage of polyhydroxyalkanoate in the cell dry weight (CDW).
NADH and NADPH quantification
The intracellular NAD+, NADH, NADP+ and NADPH concentrations were measured employing an NADP/NADPH Colorimetric Quantitation Kit (Biovision, Abcam, UK). Crude cell lysates were obtained by undertaking various freeze-thaw lysis cycles. Cofactors concentrations were photometrically quantified by measuring colorimetric changes at 450 nm.
Transcriptome analysis via RNAseq
Isolation of total RNA from corresponding 10 mL P. putida culture was performed using the RNeasy kit (Qiagen, Venlo, Netherland), according to the instructions provided by the manufacturer. Library preparation was done as described in [51]. Briefly, ribosomal RNA removal was performed with the MICROExpress Bacterial RNA enrichment kit using the Pseudomonas module (Ambion, Life Technologies, Darmstadt, Germany) according to the manufacturer’s instructions. The RNA was fragmented to a median fragment size of 200 nt by sonication using Covaris Adaptive Focused Acoustics device (Covaris, LGC Genomics, Herts, UKStrand-specific cDNA libraries were generated by previous RNA-Adapter ligation and subsequent reverse transcription. Hereby the ligated 5′-RNA-Adapter contained one of 24 different 6 nt barcode sequences [51], which allowed multiplexing of several libraries in a single Illumina lane for sequencing. Up to 20 libraries were pooled and treated with duplex-specific nuclease (DSN) for additional rRNA removal. Sequencing was performed on an Illumina HiSeq generating single-end reads with a length of 50 base pairs. Computational analysis of the raw sequence data obtained in Illumina FASTQ-format was performed as described previously by [53], with some modifications Mapping was performed using stampy, a short-read aligner that allows for gapped alignments [54] for quantification of gene expression. The reads per gene (rpg) values of all genes were calculated from the SAM output files. Testing for differential expression against KT2440 (four biological replicates) was performed with DESeq [55], an R software package that uses a statistical model based on the negative binomial distribution.
Protein quantification
After 60 hours, 10 mL cultures were withdrawn and cells were harvested by centrifugation. Proteins from up to 50 μg cell pellet were separated via SDS-PAGE [56]. Resulting SDS gels were stained using Coomassie Brillant Blue and protein amounts quantified densiometrically on a GS-800 scanner device.
Competing interests
The authors declare that they have no competing interests.
Authors’ contributions
IPC designed the study and composed the manuscript. JB and IPC have made substantial contributions to the acquisition and analysis of data. AB and SH have made contribution of acquisition of the transcriptome data. MS and CW have been involved in the analysis of the data. MJ, JB, IPC, and DJ have been involved in writing the manuscript critically for important intellectual content. All authors read and approved the final version of the manuscript.
Contributor Information
José Manuel Borrero-de Acuña, Email: jbo10@helmholtz-hzi.de.
Agata Bielecka, Email: abi05@helmholtz-hzi.de.
Susanne Häussler, Email: Susanne.haeussler@helmholtz-hzi.de.
Max Schobert, Email: m.schobert@tu-bs.de.
Martina Jahn, Email: m.jahn@tu-bs.de.
Christoph Wittmann, Email: christoph.wittmann@uni-saarland.de.
Dieter Jahn, Email: d.jahn@tu-bs.de.
Ignacio Poblete-Castro, Email: ignacio.pobletecastro@helmholtz-hzi.de.
Acknowledgements
We would like to thank V.de Lorenzo and K. Timmis for the constant intellectual advice. We acknowledge Esteban Martínez for providing the plasmids used in this study. We also thank Monika Schniederjans for the excellent support during the transcriptome analysis. We gratefully thank SFB-TR51 of the Deutsche Forschungsgemeinschaft for funding the project. Ignacio Poblete-Castro acknowledge financial support by the program “Convenio de Desempeño Apoyo a la Innovación en Educación Superior” (PMIUAB 1301). Christoph Wittmann acknowledges financial support by the German Federal Ministry of Education (BMBF) via the project “Bio-Nylon” (No. 03 V05757).
References
- Mukhopadhyay A, Redding AM, Rutherford BJ, Keasling JD. Importance of systems biology in engineering microbes for biofuel production. Curr Opin Biotechnol. 2008;19(3):228–234. doi: 10.1016/j.copbio.2008.05.003. [DOI] [PubMed] [Google Scholar]
- Lee JW, Na D, Park JM, Lee J, Choi S, Lee SY. Systems metabolic engineering of microorganisms for natural and non-natural chemicals. Nat Chem Biol. 2012;8(6):536–546. doi: 10.1038/nchembio.970. [DOI] [PubMed] [Google Scholar]
- Otero JM, Nielsen J. Industrial systems biology. Biotechnol Bioeng. 2009;105(3):439–460. doi: 10.1002/bit.22592. [DOI] [PubMed] [Google Scholar]
- Stephanopoulos G. Metabolic Fluxes and Metabolic Engineering. Metab Eng. 1999;1(1):1–11. doi: 10.1006/mben.1998.0101. [DOI] [PubMed] [Google Scholar]
- Hln C, Mendes F, Vasconcelos I, François JM. A metabolic and genomic study of engineered Saccharomyces cerevisiae strains for high glycerol production. Metab Eng. 2007;9(4):364–378. doi: 10.1016/j.ymben.2007.03.002. [DOI] [PubMed] [Google Scholar]
- Gao X, Chen J-C, Wu Q, Chen G-Q. Polyhydroxyalkanoates as a source of chemicals, polymers, and biofuels. Curr Opin Biotechnol. 2011;22(6):768–774. doi: 10.1016/j.copbio.2011.06.005. [DOI] [PubMed] [Google Scholar]
- Poblete-Castro I, Becker J, Dohnt K, Santos VM, Wittmann C. Industrial biotechnology of Pseudomonas putida and related species. Appl Microbiol Biotechnol. 2012;93(6):2279–2290. doi: 10.1007/s00253-012-3928-0. [DOI] [PubMed] [Google Scholar]
- Madison LL, Huisman GW. Metabolic Engineering of Poly(3-Hydroxyalkanoates): From DNA to Plastic. Microbiol Mol Biol Rev. 1999;63(1):21–53. doi: 10.1128/mmbr.63.1.21-53.1999. [DOI] [PMC free article] [PubMed] [Google Scholar]
- Chung A, Liu Q, Ouyang S-P, Wu Q, Chen G-Q. Microbial production of 3-hydroxydodecanoic acid by pha operon and fadBA knockout mutant of Pseudomonas putida KT2442 harboring tesB gene. Appl Microbiol Biotechnol. 2009;83(3):513–519. doi: 10.1007/s00253-009-1919-6. [DOI] [PubMed] [Google Scholar]
- Escapa IF, Morales V, Martino VP, Pollet E, Averous L, Garcia JL, Prieto MA. Disruption of β-oxidation pathway in Pseudomonas putida KT2442 to produce new functionalized PHAs with thioester groups. Appl Microbiol Biotechnol. 2011;89(5):1583–1598. doi: 10.1007/s00253-011-3099-4. [DOI] [PubMed] [Google Scholar]
- Sun Z, Ramsay J, Guay M, Ramsay B. Carbon-limited fed-batch production of medium-chain-length polyhydroxyalkanoates from nonanoic acid by Pseudomonas putida KT2440. Appl Microbiol Biotechnol. 2007;74(1):69–77. doi: 10.1007/s00253-006-0655-4. [DOI] [PubMed] [Google Scholar]
- Hartmann R, Hany R, Pletscher E, Ritter A, Witholt B, Zinn M. Tailor-made olefinic medium-chain-length poly[(R)-3-hydroxyalkanoates] by Pseudomonas putida GPo1: Batch versus chemostat production. Biotechnol Bioeng. 2006;93(4):737–746. doi: 10.1002/bit.20756. [DOI] [PubMed] [Google Scholar]
- Poblete-Castro I, Escapa I, Jager C, Puchalka J, Chi Lam C, Schomburg D, Prieto M, Martins dos Santos V. The metabolic response of P. putida KT2442 producing high levels of polyhydroxyalkanoate under single- and multiple-nutrient-limited growth: Highlights from a multi-level omics approach. Microb Cell Fact. 2012;11(1):34. doi: 10.1186/1475-2859-11-34. [DOI] [PMC free article] [PubMed] [Google Scholar]
- Tripathi L, Wu L-P, Dechuan M, Chen J, Wu Q, Chen G-Q. Pseudomonas putida KT2442 as a platform for the biosynthesis of polyhydroxyalkanoates with adjustable monomer contents and compositions. Bioresour Technol. 2013;142:225–231. doi: 10.1016/j.biortech.2013.05.027. [DOI] [PubMed] [Google Scholar]
- Ouyang S-P, Luo RC, Chen S-S, Liu Q, Chung A, Wu Q, Chen G-Q. Production of Polyhydroxyalkanoates with High 3-Hydroxydodecanoate Monomer Content by fadB and fadA Knockout Mutant of Pseudomonas putida KT2442. Biomacromolecules. 2007;8(8):2504–2511. doi: 10.1021/bm0702307. [DOI] [PubMed] [Google Scholar]
- Escapa IF, del Cerro C, García JL, Prieto MA. The role of GlpR repressor in Pseudomonas putida KT2440 growth and PHA production from glycerol. Environ Microbiol. 2012;15(1):93–110. doi: 10.1111/j.1462-2920.2012.02790.x. [DOI] [PubMed] [Google Scholar]
- Klinke S, Dauner M, Scott G, Kessler B, Witholt B. Inactivation of Isocitrate Lyase Leads to Increased Production of Medium-Chain-Length Poly(3-Hydroxyalkanoates) in Pseudomonas putida. Appl Environ Microbiol. 2000;66(3):909–913. doi: 10.1128/aem.66.3.909-913.2000. [DOI] [PMC free article] [PubMed] [Google Scholar]
- Kenny S, Runic JN, Kaminsky W, Woods T, Babu R, OConnor KE. Development of a bioprocess to convert PET derived terephthalic acid and biodiesel derived glycerol to medium chain length polyhydroxyalkanoate. Appl Microbiol Biotechnol. 2012;95(3):623–633. doi: 10.1007/s00253-012-4058-4. [DOI] [PubMed] [Google Scholar]
- Muhr A, Rechberger EM, Salerno A, Reiterer A, Malli K, Strohmeier K, Schober S, Mittelbach M, Koller M. Novel Description of mcl-PHA Biosynthesis by Pseudomonas chlororaphis from Animal-Derived Waste. J Biotechnol. 2013;165(1):45–51. doi: 10.1016/j.jbiotec.2013.02.003. [DOI] [PubMed] [Google Scholar]
- Agnew DE, Pfleger BF. Synthetic biology strategies for synthesizing polyhydroxyalkanoates from unrelated carbon sources. Chem Eng Sci. 2012;103:58–67. doi: 10.1016/j.ces.2012.12.023. [DOI] [PMC free article] [PubMed] [Google Scholar]
- Poblete-Castro I, Binger D, Rodrigues A, Becker J. Martins dos Santos VAP, Wittmann C: In-silico-driven metabolic engineering of Pseudomonas putida for enhanced production of poly-hydroxyalkanoates. Metab Eng. 2013;15:113–123. doi: 10.1016/j.ymben.2012.10.004. [DOI] [PubMed] [Google Scholar]
- Huijberts GN, Eggink G, de Waard P, Huisman GW, Witholt B. Pseudomonas putida KT2442 cultivated on glucose accumulates poly(3-hydroxyalkanoates) consisting of saturated and unsaturated monomers. Appl Environ Microbiol. 1992;58(2):536–544. doi: 10.1128/aem.58.2.536-544.1992. [DOI] [PMC free article] [PubMed] [Google Scholar]
- Li Z-J, Cai L, Wu Q, Chen G-Q. Overexpression of NAD kinase in recombinant Escherichia coli harboring the phbCAB operon improves poly(3-hydroxybutyrate) production. Appl Microbiol Biotechnol. 2009;83(5):939–947. doi: 10.1007/s00253-009-1943-6. [DOI] [PubMed] [Google Scholar]
- Yim KS, Lee SY, Chang HN. Synthesis of poly-(3-hydroxybutyrate-co-3-hydroxyvalerate) by recombinant Escherichia coli. Biotechnol Bioeng. 1996;49(5):495–503. doi: 10.1002/(SICI)1097-0290(19960305)49:5<495::AID-BIT2>3.0.CO;2-E. [DOI] [PubMed] [Google Scholar]
- Lee SY, Lee KM, Chan HN, Steinbüchel A. Comparison of recombinant Escherichia coli strains for synthesis and accumulation of poly-(3-hydroxybutyric acid) and morphological changes. Biotechnol Bioeng. 1994;44(11):1337–1347. doi: 10.1002/bit.260441110. [DOI] [PubMed] [Google Scholar]
- Lim S-J, Jung Y-M, Shin H-D, Lee Y-H. Amplification of the NADPH-related genes zwf and gnd for the oddball biosynthesis of PHB in an E. coli transformant harboring a cloned phbCAB operon. J Biosci Bioeng. 2002;93(6):543–549. doi: 10.1016/s1389-1723(02)80235-3. [DOI] [PubMed] [Google Scholar]
- Choi J-C, Shin H-D, Lee Y-H. Modulation of 3-hydroxyvalerate molar fraction in poly(3-hydroxybutyrate-3-hydroxyvalerate) using Ralstonia eutropha transformant co-amplifying phbC and NADPH generation-related zwf genes. Enzyme Microb Technol. 2003;32(1):178–185. [Google Scholar]
- Rojo F. Carbon catabolite repression in Pseudomonas : optimizing metabolic versatility and interactions with the environment. FEMS Microbiol Rev. 2010;34(5):658–684. doi: 10.1111/j.1574-6976.2010.00218.x. [DOI] [PubMed] [Google Scholar]
- Poblete-Castro I, Rodriguez A, Lam CMC, Kessler W. Improved Production of Medium-Chain-Length Polyhydroxyalkanoates in Glucose-Based Fed-Batch Cultivations of Metabolically Engineered Pseudomonas putida Strains. J Microbiol Biotechnol. 2014;24(1):59–69. doi: 10.4014/jmb.1308.08052. [DOI] [PubMed] [Google Scholar]
- Follonier S, Panke S, Zinn M. A reduction in growth rate of Pseudomonas putida KT2442 counteracts productivity advances in medium-chain-length polyhydroxyalkanoate production from gluconate. Microb Cell Fact. 2011;10(1):25. doi: 10.1186/1475-2859-10-25. [DOI] [PMC free article] [PubMed] [Google Scholar]
- Lee G, Na J. Future of microbial polyesters. Microb Cell Fact. 2013;12(1):54. doi: 10.1186/1475-2859-12-54. [DOI] [PMC free article] [PubMed] [Google Scholar]
- Choi J, Lee SY. Factors affecting the economics of polyhydroxyalkanoate production by bacterial fermentation. Appl Microbiol Biotechnol. 1999;51(1):13–21. [Google Scholar]
- Oehmen A, Pinto FV, Silva V, Albuquerque MGE, Reis MAM. The impact of pH control on the volumetric productivity of mixed culture PHA production from fermented molasses. Eng Life Sci. 2013;14(2):143–152. [Google Scholar]
- del Castillo T, Ramos JL, Rodriguez-Herva JJ, Fuhrer T, Sauer U, Duque E. Convergent Peripheral Pathways Catalyze Initial Glucose Catabolism in Pseudomonas putida: Genomic and Flux Analysis. J Bacteriol. 2007;189(14):5142–5152. doi: 10.1128/JB.00203-07. [DOI] [PMC free article] [PubMed] [Google Scholar]
- Daddaoua A, Krell T, Ramos J-L. Regulation of Glucose Metabolism in Pseudomonas: The Phosphorylative Branch and Entner-Doudoroff Enzymes are regulated by a Repressor Containing a Sugar Isomerase Domain. J Biol Chem. 2009;284(32):21360–21368. doi: 10.1074/jbc.M109.014555. [DOI] [PMC free article] [PubMed] [Google Scholar]
- del Castillo T, Duque E, Ramos JL. A Set of Activators and Repressors Control Peripheral Glucose Pathways in Pseudomonas putida To Yield a Common Central Intermediate. J Bacteriol. 2008;190(7):2331–2339. doi: 10.1128/JB.01726-07. [DOI] [PMC free article] [PubMed] [Google Scholar]
- Kim J, Jeon CO, Park W. Dual regulation of zwf-1 by both 2-keto-3-deoxy-6-phosphogluconate and oxidative stress in Pseudomonas putida. Microbiology. 2008;154(12):3905–3916. doi: 10.1099/mic.0.2008/020362-0. [DOI] [PubMed] [Google Scholar]
- García-Mauriño SM, Pérez-Martínez I, Amador CI, Canosa I, Santero E. Transcriptional activation of the CrcZ and CrcY regulatory RNAs by the CbrB response regulator in Pseudomonas putida. Mol Microbiol. 2013;89(1):189–205. doi: 10.1111/mmi.12270. [DOI] [PubMed] [Google Scholar]
- La Rosa R, de la Peña F, Prieto MA, Rojo F. The Crc protein inhibits the production of polyhydroxyalkanoates in Pseudomonas putida under balanced carbon/nitrogen growth conditions. Environ Microbiol. 2014;16(1):278–290. doi: 10.1111/1462-2920.12303. [DOI] [PubMed] [Google Scholar]
- Ryan WJ, O’Leary ND, O’Mahony M, Dobson ADW. GacS-Dependent Regulation of Polyhydroxyalkanoate Synthesis in Pseudomonas putida CA-3. Appl Environ Microbiol. 2013;79(6):1795–1802. doi: 10.1128/AEM.02962-12. [DOI] [PMC free article] [PubMed] [Google Scholar]
- Berrios-Rivera SJ, Sanchez AM, Bennett GN, San KY. Effect of different levels of NADH availability on metabolite distribution in Escherichia coli fermentation in minimal and complex media. Appl Microbiol Biotechnol. 2004;65(4):426–432. doi: 10.1007/s00253-004-1609-3. [DOI] [PubMed] [Google Scholar]
- Sanchez AM, Bennett GN, San K-Y. Effect of different levels of NADH availability on metabolic fluxes of Escherichia coli chemostat cultures in defined medium. J Biotechnol. 2005;117(4):395–405. doi: 10.1016/j.jbiotec.2005.02.006. [DOI] [PubMed] [Google Scholar]
- Ren Q, de Roo G, Ruth K, Witholt B, Zinn M, Thöny-Meyer L. Simultaneous Accumulation and Degradation of Polyhydroxyalkanoates: Futile Cycle or Clever Regulation? Biomacromolecules. 2009;10(4):916–922. doi: 10.1021/bm801431c. [DOI] [PubMed] [Google Scholar]
- Lee IY, Kim MK, Park YH, Lee SY. Regulatory effects of cellular nicotinamide nucleotides and enzyme activities on poly(3-hydroxybutyrate) synthesis in recombinant Escherichia coli. Biotechnol Bioeng. 1996;52(6):707–712. doi: 10.1002/(SICI)1097-0290(19961220)52:6<707::AID-BIT8>3.0.CO;2-S. [DOI] [PubMed] [Google Scholar]
- Escapa IF, García JL, Bühler B, Blank LM, Prieto MA. The polyhydroxyalkanoate metabolism controls carbon and energy spillage in Pseudomonas putida. Environ Microbiol. 2012;14(4):1049–1063. doi: 10.1111/j.1462-2920.2011.02684.x. [DOI] [PubMed] [Google Scholar]
- Lee SJ, Song H, Lee SY. Genome-Based Metabolic Engineering of Mannheimia succiniciproducens for Succinic Acid Production. Appl Environ Microbiol. 2006;72(3):1939–1948. doi: 10.1128/AEM.72.3.1939-1948.2006. [DOI] [PMC free article] [PubMed] [Google Scholar]
- Yim H, Haselbeck R, Niu W, Pujol-Baxley C, Burgard A, Boldt J, Khandurina J, Trawick JD, Osterhout RE, Stephen R, Estadilla J, Teisan S, Schrever HB, Andrae S, Yang TH, Lee SY, Burk MJ, Van Dien S. Metabolic engineering of Escherichia coli for direct production of 1,4-butanediol. Nat Chem Biol. 2011;7(7):445–452. doi: 10.1038/nchembio.580. [DOI] [PubMed] [Google Scholar]
- Bro C, Regenberg B, Forster J, Nielsen J. In silico aided metabolic engineering of Saccharomyces cerevisiae for improved bioethanol production. Metab Eng. 2006;8(2):102–111. doi: 10.1016/j.ymben.2005.09.007. [DOI] [PubMed] [Google Scholar]
- Becker J, Zelder O, Hafner S, Schroder H, Wittmann C. From zero to hero - Design-based systems metabolic engineering of Corynebacterium glutamicum for l-lysine production. Metab Eng. 2011;13(2):159–168. doi: 10.1016/j.ymben.2011.01.003. [DOI] [PubMed] [Google Scholar]
- Park JH, Lee KH, Kim TY, Lee SY. Metabolic engineering of Escherichia coli for the production of l-valine based on transcriptome analysis and in silico gene knockout simulation. Proc Natl Acad Sci. 2007;104(19):7797–7802. doi: 10.1073/pnas.0702609104. [DOI] [PMC free article] [PubMed] [Google Scholar]
- Silva-Rocha R, Martinez-Garcia E, Calles B, Chavarria M, Arce-Rodríguez A, De las Heras A, Páez-Espino AD, Durante-Rodríguez G, Kim J, Nikel PI, Platero R, De Lorenzo V. The Standard European Vector Architecture (SEVA): a coherent platform for the analysis and deployment of complex prokaryotic phenotypes. Nucleic Acids Res. 2012;41(D1):D666–D675. doi: 10.1093/nar/gks1119. [DOI] [PMC free article] [PubMed] [Google Scholar]
- Huff JP, Grant BJ, Penning CA, Sullivan KF. Optimization of routine transformation of Escherichia coli with plasmid DNA. BioTechniques. 1990;9(5):570–572. 574, 576–577. [PubMed] [Google Scholar]
- Dötsch A, Eckweiler D, Schniederjans M, Zimmermann A, Jensen V, Scharfe M, Geffers R, Häussler S. The Pseudomonas aeruginosa Transcriptome in Planktonic Cultures and Static Biofilms Using RNA Sequencing. PLoS One. 2012;7(2):e31092. doi: 10.1371/journal.pone.0031092. [DOI] [PMC free article] [PubMed] [Google Scholar]
- Lunter G, Goodson M. Stampy: a statistical algorithm for sensitive and fast mapping of Illumina sequence reads. Genome Res. 2011;21(6):936–939. doi: 10.1101/gr.111120.110. [DOI] [PMC free article] [PubMed] [Google Scholar]
- Anders S, Huber W. Differential expression analysis for sequence count data. Genome Biol. 2010;11(10):R106. doi: 10.1186/gb-2010-11-10-r106. [DOI] [PMC free article] [PubMed] [Google Scholar]
- Righetti PG. Recent developments in electrophoretic methods. J Chromatogr A. 1990;516(1):3–22. doi: 10.1016/s0021-9673(01)90200-6. [DOI] [PubMed] [Google Scholar]