Abstract
The point-scanned dual-axis confocal (PS-DAC) microscope has been shown to exhibit a superior capability to reject out-of-focus and multiply scattered light in comparison to its conventional single-axis counterpart. However, the slow frame rate (typically < 5 Hz) resulting from point-by-point data collection makes these systems vulnerable to motion artifacts. While video-rate point-scanned confocal microscopy is possible, a line-scanned dual-axis confocal (LS-DAC) microscope provides a simpler means of achieving high-speed imaging through line-by-line data collection, but sacrifices contrast due to a loss of confocality along one dimension. Here we evaluate the performance tradeoffs between a LS-DAC and PS-DAC microscope with identical spatial resolutions. Characterization experiments of the LS-DAC and PS-DAC microscopes with tissue phantoms, in reflectance mode, are shown to match results from Monte-Carlo scattering simulations of the systems. Fluorescence images of mouse brain vasculature, obtained using resolution-matched LS-DAC and PS-DAC microscopes, demonstrate the comparable performance of LS-DAC and PS-DAC microscopy at shallow depths.
In recent decades, confocal microscopy has become widely used in the basic sciences as well as for medical diagnostics[1–4]. By utilizing point illumination and pinhole detection, confocal microscopes effectively reject out-of-focus light from specimens and provide users with high-resolution and high-contrast images. Due to their ability to perform optical-sectioning with relatively simple optics and low-power fiber-coupled laser sources, confocal microscopes have been miniaturized for use in many biomedical applications[1, 2, 5–13].
In this study, we are focusing on a version of confocal microscopy developed within the past decade, the dual-axis confocal (DAC) microscope[9, 14, 15]. The DAC architecture differs from a conventional confocal architecture (hereby referred to as a single-axis confocal, or SAC) in that the illumination and collection paths do not overlap except at the focus. From diffraction-theory-based calculations as well as Monte-Carlo scattering simulations performed previously[14, 16–18], the DAC microscope has been shown to possess superior optical-sectioning capabilities in comparison to SAC microscopes, resulting in increased contrast and imaging depth.
Confocal images are conventionally obtained by scanning a focal point in two-dimensions within a specimen and constructing an image in a point-by-point manner. One drawback of point-scanned (PS) confocal imaging is the slow frame rate (typically < 5 Hz), making these systems highly susceptible to motion artifacts and suboptimal for in vivo or handheld use as miniature clinical devices[19, 20]. A strategy to improve the frame rate is to scan a focal line in one dimension within the specimen to generate a confocal image in a line-by-line fashion[21, 22]. While video-rate point-scanned confocal microscopy is possible[23, 24], the line-scanned approach eliminates the need for a two-dimensional scanning mirror, which significantly simplifies the system design especially for miniature systems. In addition to improving the imaging speed, a line-scanned (LS) system can potentially increase the signal-to-noise ratio (SNR) compared to a point-scanned (PS) system by increasing pixel dwell times by two to three orders of magnitude for a given frame rate and field of view; however, photobleaching may ultimately limit the achievable SNR. There are also tradeoffs in imaging performance due to the loss of confocality along the focal line, resulting in a diminished optical sectioning capability[3, 4, 17, 25, 26], and consequently a limited imaging depth.
In this study, we developed a PS-DAC microscope that could easily be converted into a resolution-matched LS-DAC microscope in order to perform side-by-side comparisons of the imaging performance of these confocal architectures both in homogeneous tissue phantoms as well as in fresh tissues.
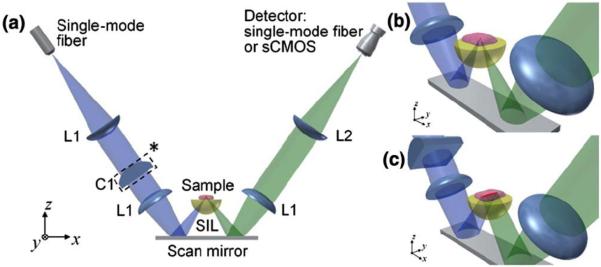
Figure 1 shows the design schematic of the DAC microscope. A fiber-coupled 658-nm diode laser (QPhotonics LLC, QTFS-660-LD) serves as an illumination point source that is collimated and focused into tissue without magnification using a pair of identical achromatic lenses, L1 (f = 20 mm). For the PS-DAC configuration, the illumination light is focused into a point at the imaging plane in the tissue. For the LS-DAC configuration, a plano-convex cylindrical lens (C1, f = 50 mm, Optosigma) is inserted in the collimated region of the illumination path, introducing astigmatism into the illumination beam that results in a ~800-μm long focal line (1/e2 line length) along the y-axis of the imaging plane. For image reconstruction, only the center of the focal line is used, corresponding to the full width at half maximum (FWHM) line length (~500 μm). A hemispheric fused-silica solid immersion lens (SIL) is used for index-matching the illumination and collection beams into tissue as well as providing a magnification factor of ~1.4 (index of fused silica), as detailed previously[16, 27].
Figure 1.

(a) Design schematic of the DAC microscope. (b) Close-up view of the PS-DAC microscope near the sample. (c) Close-up view of the LS-DAC microscope configuration. Note that the cylindrical lens C1* is not present in the PS-DAC configuration.
For PS-DAC imaging, the collected light is focused into a singlemode collection fiber with optics that are identical to the illumination path. The singlemode collection fiber (Thorlabs SM600, MFD ~4.5 μm) serves as the detection pinhole, and transmits light into a PMT detector (Hamamatsu Corp, H7422-50). For imaging in fluorescence mode, a long-pass filter (Semrock Inc, LP02-664RU-25) is placed in the collimated region of the collection path. A galvanometric mirror (Cambridge Technologies, 6210HSM40) is used to scan the focal volume in the y direction (fast axis) while the sample-holder stage is translated slowly in the x direction. Detector signals are digitized (National Instruments PCI-6115) and confocal images of vertical tissue sections are stitched together using a custom LabVIEW program. Three-dimension rendering is performed using Amira.
For LS-DAC imaging, the focal line is imaged onto a sCMOS array (Hamamatsu ORCA flash 4.0 v2) with 5X magnification using a series of lenses, L1 (f = 20 mm) and L2 (f = 100 mm, Optosigma). An en face image is obtained by scanning the sample-holder stage (the scanning mirror is not used), recording raw images with Hamamatsu software (HCImageLive 4.1.5.12), and stitching together a confocal image in a line-wise fashion using a custom MATLAB program. En face images from identical depths are used for side-by-side comparisons of the PS-DAC and LS-DAC configurations.
FRED software (Photon Engineering, Tucson, AZ) was used for Monte-Carlo simulations, as described previously[17]. The software utilizes a Henyey-Greenstein approximation of Mie scattering theory and does not take into consideration diffraction, absorption, polarization, or beam steering events introduced by the heterogeneities inherent to real tissue. However, these simulations have been shown to provide an excellent first-order approximation of confocal microscope performance in homogeneous scattering media[17, 18].
The performance of the PS-DAC and LS-DAC configurations were assessed based on two key parameters: spatial resolution and contrast (signal-to-background ratio, or SBR). The axial and transverse responses of these systems were characterized in reflectance mode in 5% Intralipid (μs ~ 11 mm−1), a homogeneous scattering phantom. All analyses were performed over a range of optical lengths (OL), a dimensionless parameter defined as 2μsd/cos θ where d is the physical imaging depth within the sample, μs is the scattering coefficient of the sample, and θ is the half angle of intersection (30 deg) between the illumination and collection beams. The OL is the average number of scattering mean-free-paths (1/μs) traversed by ballistic photons during a round trip path to the focal volume and back out of the tissue.
In order to measure the axial response for both the LS-DAC and PS-DAC microscopes, a mirror was placed at the focus of the system and was translated away from the focus. The normalized power output at the detector was recorded as a function of axial defocus. A sCMOS camera was used as a detector for reflectance-based measurements of axial and transverse response for both the PS-DAC and LS-DAC microscopes. For the PS-DAC, the detector “pinhole” was selected by binning the center 3×3 pixels at the focus. This corresponds to an actual pinhole size of ~20×20 μm, which is slightly larger than the 1/e2 spot size of the imaged spot at the detector. For the LS-DAC configuration, the imaging slit was defined by a 3 by 600 pixel region-of-interest on the camera. However, in order to match the conditions of our Monte-Carlo simulations, only a 3×3 bin of pixels at the center of the focal line, corresponding to one resolvable point along the line, was used to construct an axial response plot. Contrast was characterized by the signal-to-background ratio (SBR), which is defined as the ratio between the peak signal when the reflective surface is in focus, and the background signal obtained when the reflective surface is removed from the Intralipid phantom.
In order to measure the transverse response for the PS-DAC configuration, a knife-edge target was placed on the focal plane and translated laterally through the focus. For the LS-DAC configuration, a knife-edge target was placed at the focus of the system such that the glass-to-mirror transition was parallel to the focal line (along the y-axis in Fig. 1). The normalized power output at the detector was plotted as a function of the position of the knife edge with respect to the glass-to-mirror transition point (y = 0).
For imaging experiments of fluorescent mouse brain vasculature, Alexa Fluor 647-conjugated dextran (AF647-dextran 10kDa, Invitrogen) was injected retro-orbitally into anesthetized mice (100 mg/kg bodyweight). The mice were immediately sacrificed and the whole brains were then excised for imaging of the superficial vasculature (up to 200-μm deep). For tissue imaging, a PMT was required for the PS-DAC microscope due to the limited speed of the sCMOS array used for LS-DAC imaging.
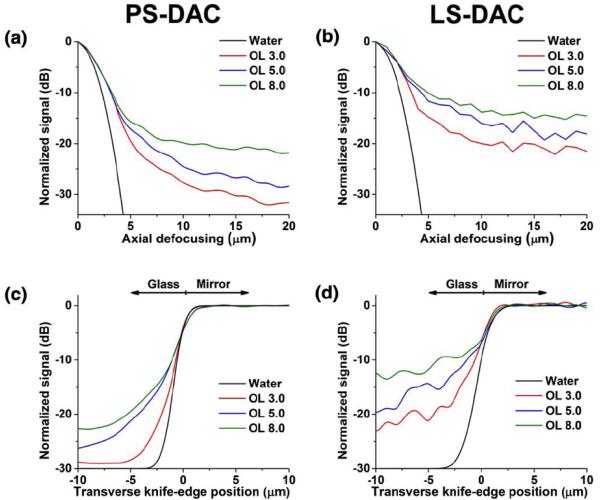
Results from Monte-Carlo simulations comparing the PS-DAC and LS-DAC configurations are presented in Fig 2. Plots of the axial response (Figs. 2a & 2b) as well as plots of the transverse response (Figs. 2c & 2d) over a range of depths (OL) show that the contrast is lower for the LS-DAC configuration when compared with the PS-DAC.
Figure 2.
Results from Monte-Carlo simulations of a homogeneous scattering medium over a range of optical lengths (OL). (a) The axial response of the PS-DAC microscope. (b) Axial response of the LS-DAC microscope. (c) Transverse response of the PS-DAC microscope. (d) Transverse response of the LS-DAC microscope. Note: the calculated diffraction-limited response in water is plotted as reference.
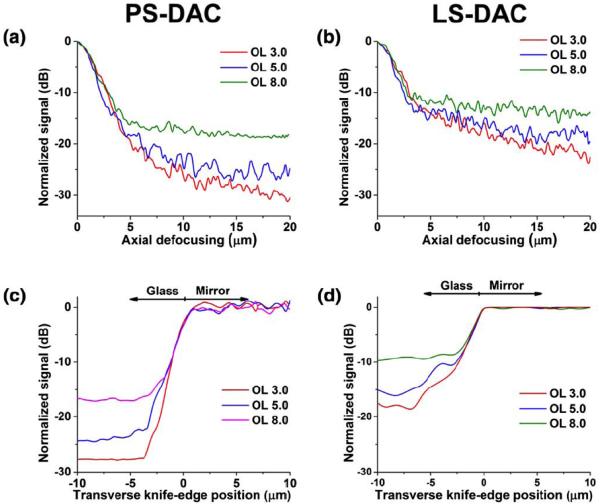
Experiments with a homogeneous scattering medium (Fig. 3) indicate that the axial and transverse resolutions are similar for both the line-scanned and point-scanned configurations. At shallow depths (Fig. 3), the line-scanned and point-scanned DAC microscopes show comparable spatial resolution (2.2-μm axial, 1.3-μm lateral) and image contrast. The axial resolution is defined as the FWHM, or the -3dB width, of the axial response. The transverse resolution is defined as the transition width from the 10% to the 90% power points of the transverse response curve. These resolution measurements are consistent with calculations based on diffraction theory, as presented previously[9, 16, 25, 26]. In both cases, the background is higher (contrast is lower) for the line-scanned configuration due to the loss of confocality along one dimension. The experimental performance of both configurations matches the results from the corresponding Monte-Carlo simulations.
Figure 3.
Experimental characterization of axial and transverse responses over a range of optical lengths (OL) in Intralipid. (a) Axial response of the PS-DAC microscope. (b) Axial response of the LS-DAC microscope. (c) Transverse response of the PS-DAC microscope. (d) Transverse response of the LS-DAC microscope.
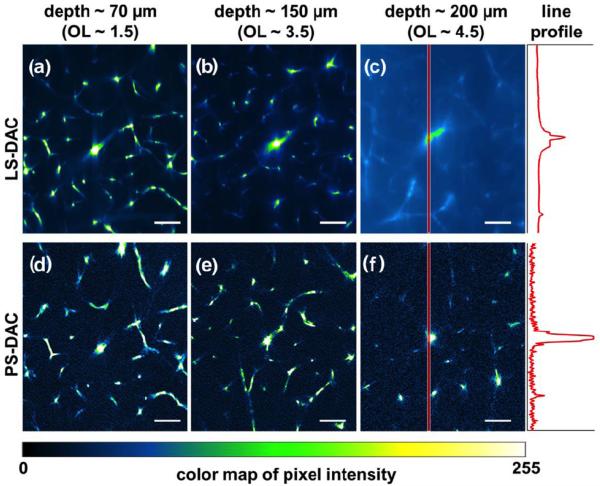
A comparison of LS-DAC and PS-DAC microscope imaging performance in fresh tissue (mouse brain vasculature) is shown in Fig. 4. The OL corresponding to each imaging depth is estimated based on a previously reported value of the scattering coefficient for brain tissue, μs ~ 10 mm−1 [28]. When imaging at larger depths (>150 μm), the background in the line-scanned system starts to overwhelm the signal, degrading the contrast of the image (Figs. 4b & 4e). In addition, after a depth of 200 μm (Figs. 4c & 4f), a slight degradation in lateral resolution is also seen in the LS-DAC images while this is not seen in the PS-DAC images.
Figure 4.
Comparison of LS-DAC (a–c) and PS-DAC (d–f) performance via fluorescence imaging of identical mouse brain vasculature at depths of up to 200μm. The intensities of the pixels along the red band in (c) and (f) are plotted on the right. Scale bar = 70 μm.
In this study, we present a side-by-side performance comparison of LS-DAC and PS-DAC microscopes over a range of depths. We show that for imaging at shallow depths (<150 μm), LS-DAC microscopy offers comparable imaging performance to PS-DAC microscopy. This suggests that LS-DAC microscopy may be advantageous for in vivo microscopy applications where motion artifacts often compromise the performance of slow-frame-rate microscopes such as the PS-DAC.
Through Monte-Carlo simulations as well as experimental results with a homogeneous scattering medium, we showed that spatial resolution is preserved while image contrast is degraded when the point-scanned DAC microscope is converted into a line-scanned DAC microscope, thus limiting the imaging capability of the LS-DAC to shallower depths.
When imaging real tissues with inherent heterogeneity, such as due to organelles and small glandular structures, the resolution is seen to degrade at a shallower depth for the LS-DAC than for the PS-DAC. While diffraction-based calculations and Monte-Carlo simulations do not take into consideration tissue heterogeneity, some resolution degradation and imaging artifacts are often seen in practice due to the heterogeneities in real tissues[29].
Under photon-starved imaging conditions as is often the case with fluorescence microscopy, image contrast may be limited by shot noise and detector noise rather than the background noise from out-of-focus and multiply scattered light. Although the PS-DAC exhibits superior signal-to-background ratio (SBR) compared to the LS-DAC, the short pixel dwell time of a PS-DAC system often results in a lower signal-to-noise ratio (SNR) that can deteriorate the image contrast. Therefore, under low-signal conditions (e.g., weak fluorescence), with a high-sensitivity camera, the performance of a LS-DAC microscope is potentially superior to a PS-DAC microscope at shallow depths. For example, the line profiles plotted at the right of Figs. 4c and 4f indicate superior SBR for the PS-DAC microscope but reduced noise for the LS-DAC microscope. Future studies will further investigate the trade-offs in SNR between the LS-DAC and PS-DAC microscopes when imaging both bright and dim samples at various frame rates, and when utilizing sCMOS (LS-DAC) vs. PMT detectors (PS-DAC). These studies will also examine reflectance-based LS-DAC microscopy, in which SNR is expected to be high compared to fluorescence microscopy, but speckle artifacts must be mitigated[30].
In summary, the line-scanned DAC configuration is designed to ultimately be incorporated into a miniature form factor for clinical diagnosis and/or surgical guidance. The performance of a LS-DAC microscope is comparable to that of a PS-DAC microscope at shallow depths but the degradation in SBR limits the ability of a LS-DAC microscope to image deeply within tissues. However, given its simplicity of design and its ability to achieve high frame rates, the LS-DAC can potentially enable real-time in vivo imaging with reduced susceptibility to motion artifacts.
Acknowledgments
The authors acknowledge funding support from the NIH / NIBIB R00 EB008557 (Liu), the NIH / NIDCR R01 DE023497 (Liu), the Department of Biomedical Engineering, and the Office of the Vice President for Research at Stony Brook University.
Reference
- 1.Jabbour JM, Saldua MA, Bixler JN, Maitland KC. Confocal endomicroscopy: instrumentation and medical applications. Annals of biomedical engineering. 2012;40:378–397. doi: 10.1007/s10439-011-0426-y. [DOI] [PMC free article] [PubMed] [Google Scholar]
- 2.Liu JT, Loewke NO, Mandella MJ, Levenson RM, Crawford JM, Contag CH. Point-of-care pathology with miniature microscopes. Analytical cellular pathology. 2011;34:81–98. doi: 10.3233/ACP-2011-011. [DOI] [PMC free article] [PubMed] [Google Scholar]
- 3.Wilson T. Confocal Microscopy. Academic Press; 1990. [Google Scholar]
- 4.Pawley JB. Handbook of biological confocal microscopy. Rev. ed. Plenum Press; New York: 1990. p. xiii.p. 232. [Google Scholar]
- 5.Pitris C, Bouma B, Shiskov M, Tearney G. A GRISM-based probe for spectrally encoded confocal microscopy. Optics express. 2003;11:120–124. doi: 10.1364/oe.11.000120. [DOI] [PubMed] [Google Scholar]
- 6.MacAulay C, Lane P, Richards-Kortum R. In vivo pathology: microendoscopy as a new endoscopic imaging modality. Gastrointestinal endoscopy clinics of North America. 2004;14:595–620. xi. doi: 10.1016/j.giec.2004.03.014. [DOI] [PubMed] [Google Scholar]
- 7.Kiesslich R, Burg J, Vieth M, Gnaendiger J, Enders M, Delaney P, Polglase A, McLaren W, Janell D, Thomas S, Nafe B, Galle PR, Neurath MF. Confocal laser endoscopy for diagnosing intraepithelial neoplasias and colorectal cancer in vivo. Gastroenterology. 2004;127:706–713. doi: 10.1053/j.gastro.2004.06.050. [DOI] [PubMed] [Google Scholar]
- 8.Jean F, Bourg-Heckly G, Viellerobe B. Fibered confocal spectroscopy and multicolor imaging system for in vivo fluorescence analysis. Optics express. 2007;15:4008–4017. doi: 10.1364/oe.15.004008. [DOI] [PubMed] [Google Scholar]
- 9.Liu JT, Mandella MJ, Loewke NO, Haeberle H, Ra H, Piyawattanametha W, Solgaard O, Kino GS, Contag CH. Micromirror-scanned dual-axis confocal microscope utilizing a gradient-index relay lens for image guidance during brain surgery. Journal of biomedical optics. 2010;15:026029. doi: 10.1117/1.3386055. [DOI] [PMC free article] [PubMed] [Google Scholar]
- 10.Makhlouf H, Gmitro AF, Tanbakuchi AA, Udovich JA, Rouse AR. Multispectral confocal microendoscope for in vivo and in situ imaging. Journal of biomedical optics. 2008;13:044016. doi: 10.1117/1.2950313. [DOI] [PMC free article] [PubMed] [Google Scholar]
- 11.Dickensheets DL, Kino GS. Micromachined scanning confocal optical microscope. Optics letters. 1996;21:764–766. doi: 10.1364/ol.21.000764. [DOI] [PubMed] [Google Scholar]
- 12.Tearney GJ, Webb RH, Bouma BE. Spectrally encoded confocal microscopy. Optics letters. 1998;23:1152–1154. doi: 10.1364/ol.23.001152. [DOI] [PubMed] [Google Scholar]
- 13.Sabharwal YS, Rouse AR, Donaldson L, Hopkins MF, Gmitro AF. Slit-scanning confocal microendoscope for high-resolution in vivo imaging. Applied optics. 1999;38:7133–7144. doi: 10.1364/ao.38.007133. [DOI] [PubMed] [Google Scholar]
- 14.Liu JT, Mandella MJ, Crawford JM, Contag CH, Wang TD, Kino GS. Efficient rejection of scattered light enables deep optical sectioning in turbid media with low-numerical-aperture optics in a dual-axis confocal architecture. Journal of biomedical optics. 2008;13:034020. doi: 10.1117/1.2939428. [DOI] [PubMed] [Google Scholar]
- 15.Wang TD, Contag CH, Mandella MJ, Chan NY, Kino GS. Confocal fluorescence microscope with dual-axis architecture and biaxial postobjective scanning. Journal of biomedical optics. 2004;9:735–742. doi: 10.1117/1.1760760. [DOI] [PMC free article] [PubMed] [Google Scholar]
- 16.Liu JT, Mandella MJ, Friedland S, Soetikno R, Crawford JM, Contag CH, Kino GS, Wang TD. Dual-axes confocal reflectance microscope for distinguishing colonic neoplasia. Journal of biomedical optics. 2006;11:054019. doi: 10.1117/1.2363363. [DOI] [PMC free article] [PubMed] [Google Scholar]
- 17.Chen Y, Wang D, Liu JT. Assessing the tissue-imaging performance of confocal microscope architectures via Monte Carlo simulations. Optics letters. 2012;37:4495–4497. doi: 10.1364/OL.37.004495. [DOI] [PMC free article] [PubMed] [Google Scholar]
- 18.Chen Y, Liu JT. Optimizing the performance of dual-axis confocal microscopes via Monte-Carlo scattering simulations and diffraction theory. Journal of biomedical optics. 2013;18:066006. doi: 10.1117/1.JBO.18.6.066006. [DOI] [PMC free article] [PubMed] [Google Scholar]
- 19.Piyawattanametha W, Ra H, Qiu Z, Friedland S, Liu JT, Loewke K, Kino GS, Solgaard O, Wang TD, Mandella MJ, Contag CH. In vivo near-infrared dual-axis confocal microendoscopy in the human lower gastrointestinal tract. Journal of biomedical optics. 2012;17:021102. doi: 10.1117/1.JBO.17.2.021102. [DOI] [PMC free article] [PubMed] [Google Scholar]
- 20.Ra H, Piyawattanametha W, Gonzalez-Gonzalez E, Mandella MJ, Kino GS, Solgaard O, Leake D, Kaspar RL, Oro A, Contag CH. In vivo imaging of human and mouse skin with a handheld dual-axis confocal fluorescence microscope. The Journal of investigative dermatology. 2011;131:1061–1066. doi: 10.1038/jid.2010.401. [DOI] [PMC free article] [PubMed] [Google Scholar]
- 21.Dwyer PJ, DiMarzio CA, Rajadhyaksha M. Confocal theta line-scanning microscope for imaging human tissues. Applied optics. 2007;46:1843–1851. doi: 10.1364/ao.46.001843. [DOI] [PubMed] [Google Scholar]
- 22.Larson B, Abeytunge S, Rajadhyaksha M. Performance of full-pupil line-scanning reflectance confocal microscopy in human skin and oral mucosa in vivo. Biomedical optics express. 2011;2:2055–2067. doi: 10.1364/BOE.2.002055. [DOI] [PMC free article] [PubMed] [Google Scholar]
- 23.Rajadhyaksha M, Anderson RR, Webb RH. Video-rate confocal scanning laser microscope for imaging human tissues in vivo. Applied optics. 1999;38:2105–2115. doi: 10.1364/ao.38.002105. [DOI] [PubMed] [Google Scholar]
- 24.Liu JT, Mandella MJ, Ra H, Wong LK, Solgaard O, Kino GS, Piyawattanametha W, Contag CH, Wang TD. Miniature near-infrared dual-axes confocal microscope utilizing a two-dimensional microelectromechanical systems scanner. Optics letters. 2007;32:256–258. doi: 10.1364/ol.32.000256. [DOI] [PMC free article] [PubMed] [Google Scholar]
- 25.Sheppard CJR, Mao XQ. Confocal Microscopes with Slit Apertures. J Mod Optic. 1988;35:1169–1185. [Google Scholar]
- 26.Wilson T, Hewlett SJ. Imaging in scanning microscopes with slit-shaped detectors. Journal of microscopy. 1990;160:115–139. doi: 10.1111/j.1365-2818.1990.tb03053.x. [DOI] [PubMed] [Google Scholar]
- 27.Mansfield SM, Studenmund WR, Kino GS, Osato K. High-numerical-aperture lens system for an optical storage head. Optics letters. 1993;18:305. doi: 10.1364/ol.18.000305. [DOI] [PubMed] [Google Scholar]
- 28.Chance B, van der Zee P, Essenpreis M, Delpy DT, Alfano RR. Optical properties of brain tissue. 1993;1888:454–465. [Google Scholar]
- 29.Wang D, Chen Y, Liu JT. A liquid optical phantom with tissue-like heterogeneities for confocal microscopy. Biomedical optics express. 2012;3:3153–3160. doi: 10.1364/BOE.3.003153. [DOI] [PMC free article] [PubMed] [Google Scholar]
- 30.Glazowski C, Rajadhyaksha M. Optimal detection pinhole for lowering speckle noise while maintaining adequate optical sectioning in confocal reflectance microscopes. Journal of biomedical optics. 2012;17:085001. doi: 10.1117/1.JBO.17.8.085001. [DOI] [PMC free article] [PubMed] [Google Scholar]


