Abstract
Background
The value of assessing CD5 expression in the differential diagnosis of small B-cell neoplasms is well established. Usually CD5 is assessed qualitatively.
Materials and Methods
We assessed CD5 expression levels by quantitative flow cytometry immunophenotyping to determine possible differences among various small B-cell neoplasms. We performed 4-color flow cytometry analysis on peripheral blood (PB) and bone marrow (BM) aspirate specimens and quantified CD5 expression in various mature small B-cell lymphomas and leukemias. We also assessed CD5 levels in PB samples of normal donors (controls).
Results
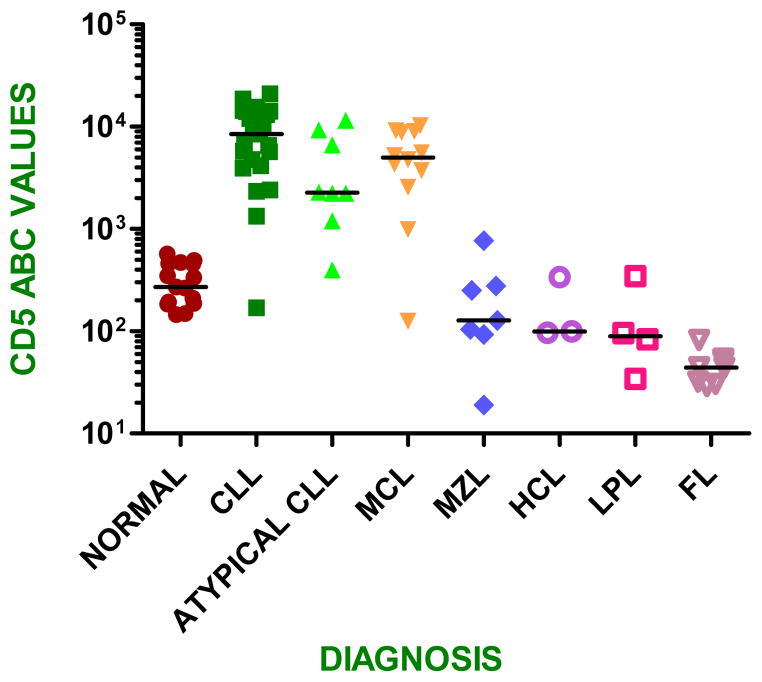
Cases of chronic lymphocytic leukemia (CLL) and mantle cell lymphoma had higher levels of CD5 compared with control (benign) B-cells (p < 0.001). Cases of marginal zone lymphoma (MZL) and hairy cell leukemia (HCL) had CD5 levels similar to control B-cells (p > 0.05), while cases of follicular lymphoma (FL) and lymphoplasmacytic lymphoma (LPL) had significantly lower CD5 levels than control B-cells (p <0.05). In B-cell neoplasms, a high level of CD5 expression correlated with a homogeneous pattern of positive events whereas lower CD5 levels correlated with a heterogeneous pattern of positive events.
Conclusions
Using flow cytometric immunophenotypic analysis to quantify CD5 levels can aid in diagnosis. CD5 expression levels are substantially higher in CLL and mantle cell lymphoma and expression is observed in a homogeneous pattern as compared with other B-cell neoplasms that are either negative for CD5 or express this antigen at lower levels with a heterogeneous pattern of expression. However, there is some overlap in CD5 expression levels between a subset of atypical CLL and MZL cases.
Keywords: Quantitative flow cytometry; CD5, B-cell lymphoma/leukemia
Introduction
Patients with small B-cell neoplasms can present with predominantly blood or tissue involvement, indolent or aggressive disease, and these neoplasms show variable morphologic and immunophenotypic features. The most common small B-cell tumors include chronic lymphocytic leukemia/small lymphocytic lymphoma (CLL/SLL), mantle cell lymphoma, follicular lymphoma, and marginal zone lymphomas (MZL) of extranodal, nodal or splenic types. Accurate diagnosis of these tumors is essential to evaluate prognostic factors and to plan the types and timing of therapies. Flow cytometry immunophenotypic analysis is one of the cornerstones used in the diagnosis of small B-cell neoplasms. Flow cytometry immunophenotyping allows the simultaneous evaluation of numerous markers on a distinct cell population, and has the additional advantage that this technology is widely available in clinical laboratories.1
As a part of the immunophenotypic workup of small B-cell neoplasms, assessment of CD5 expression is essential and is performed routinely by flow cytometry immunophenotyping.2, 3 CD5 is a 67-kDa glycoprotein scavenger receptor cysteine rich super family member that is expressed by T-cells, and plays a role in cellular activation.4 CD5 downregulates activated B-lymphocytes and protects against autoimmunity by inducing production of cytokines, such as IL-10.5 CD5 is also expressed by B-cells, and levels of CD5 on normal B-cells are high during fetal life, low in children and younger adults, and high again in the elderly.4–6 CD5+ normal B-cells are small lymphocytes with scant cytoplasm, round nuclei, and clumped chromatin. Immunophenotypically, normal CD5+ B-cells express CD23, IgM, and IgD.4 CD5+ B cells represent 15–25% of the B-cells of secondary lymphoid organs in adults.4
Expression of CD5 is almost universal in CLL/SLL and mantle cell lymphoma and therefore detection of CD5 is useful in the diagnosis of these neoplasms. However, CD5 can occasionally be expressed by other small B-cell neoplasms, such as MZL of various types, and less often lymphoplasmacytic lymphoma/Waldenstrom macroglobulinemia (LPL/WM), follicular lymphoma, and other less frequent small B-cell neoplasms.7–11 Since distinguishing the various types of small B-cell leukemias and lymphomas has clinical and therapeutic consequences, CD5 expression also can complicate classification of these tumors in some instances.
It is well known that the intensity of antigen expression, as well as its presence or absence, can be helpful in differential diagnosis. For example, surface immunoglobulin and CD20 expression are typically dim in CLL/SLL, but are brighter in other small B-cell neoplasms and especially bright in MZL and hairy cell leukemia. Typically, these markers are assessed in a qualitative fashion, as is the case for CD5 in routine practice. However, qualitative assessment of individual markers by visual observation of flow cytometry data can be highly variable due to factors such as instrumentation, fluorochromes and gating strategies. One approach to overcome this variability is to quantify antigen expression more rigorously by assessing the number of molecules expressed per cell and this approach has been used, for example, to quantify CD20 expression levels in small B-cell neoplasms.12, 13
We hypothesize that small B-cell neoplasms also express varying levels of CD5 and that quantification of CD5 expression levels may be helpful in differential diagnosis. Therefore, we quantified CD5 expression levels in various types of small B-cell leukemia and lymphoma as well as in peripheral blood B-cells of normal controls. Our results suggest that CD5 expression levels differ in different types of small B-cell neoplasms and that these levels can be used in differential diagnosis.
Materials and Methods
Study group
The study group included 58 bone marrow (BM) aspirate and 7 peripheral blood specimens obtained from patients with untreated typical CLL (n= 23), so-called atypical CLL (n= 8), mantle cell lymphoma (n= 12), MZL (n= 7), follicular lymphoma (n=8), LPL/WM (n=4), and hairy cell leukemia (n =3). All cases were analyzed in the Clinical Flow Cytometry Laboratory of the Department of Hematopathology at the University of Texas M. D. Anderson Cancer Center. The diagnosis of each tumor type was based on the criteria of the World Health Organization (WHO) Classification.14 Therefore, final diagnosis of these tumors incorporated laboratory data, morphologic findings, immunohistochemical results, extended flow cytometry immunophenotype, and the results of conventional karyotyping and fluorescence in situ hybridization.
In addition to the tumor group, we also assessed a control group composed of peripheral blood samples from 15 healthy donors with a normal complete blood cell count. We refer to this group as control or normal B-cells.
Matutes Scoring System
The updated Matutes scoring system was used to define cases of CLL as typical or atypical.13, 15 This system has 5 criteria, each equal to 1 point, based on the immunophenotype. These criteria are: dim intensity of surface immunoglobulin light chain; dim intensity of CD79b or CD22; presence of CD5; presence of CD23; and absence of FMC7. For a marker to be considered positive, expression must be on at least 30% or more of monotypic lymphocytes as compared with isotype control. A score of 4 to 5 supports typical CLL and a score ≤ 3 supports atypical CLL/SLL.
Flow Cytometry Immunophenotype
Samples were collected in EDTA anticoagulant tubes, stored at room temperature and processed within 24 hours of collection. Whole blood staining was performed using 4-color flow cytometry with a panel of 3 tubes. Each panel included a combination of directly conjugated monoclonal antibodies with fluorescein isothiocyanate (FITC)/phycoerythrin (PE)/peridinin- chlorophyll protein (PerCP- Cy5.5)/allophycocyanin (APC). The combinations of antibodies were as follows: Tube 1: CD19/CD5 labeled 1:1/CD45/CD20; tube 2: kappa/CD5 1:1/CD45/CD19 and tube 3: lambda/CD5 1:1/CD45/CD19. All antibodies were from BD Biosciences (San Diego, California).
For quantitative assessment of CD5 expression levels, the CD5 clone L17F12 antibody was custom-conjugated with PE fluorochrome in a 1:1 ratio (BD Biosciences). QuantiBRITE™ PE beads, a lyophilized bead pellet conjugated with 4 levels of PE, were used for the conversion of position on fluorescence 2 (FL2) axis into number of PE molecules bound per cell (BD Biosciences, San Diego, CA). The levels used for conversion were at 474, 5359, 23843 and 62336 molecules.
Cell suspensions admixed with fluorochrome-labeled antibodies contained one million cells in 1 mL Falcon tubes. Tubes were incubated for 10 minutes at 4 °C and red blood cell lysis was performed using BD Pharm Lyse buffer. Washes of tubes were done with 1x PBS and 0.1 % sodium azide, and the pellet was resuspended in 1% paraformaldehyde. For kappa and lambda tubes, red blood cell lysis was done first to remove serum immunoglobulin, followed by staining with the antibodies. Other steps involved in the protocol remained the same.
A BD FACSCalibur cytometer was used for data acquisition. Calibration of the flow cytometer was achieved by using BD Calibrite beads with BD FACSComp software and its daily optimization and compensation were performed with normal peripheral blood stained with CD3, CD4, CD8, and CD19 with BD CellQuest Pro. The FL2 axis was converted into number of antibodies per cell by using QuantiBrite beads. The instrument and compensation settings used to acquire QuantiBrite beads were used to acquire the patient samples. Live gating was set on lymphocytes by using forward scatter height (FSC-H) and side scatter height (SSC-H) and 20,000 events were acquired. Data analyses were performed using QuantiCalc (Verity Software House, Topsham, ME). Gated CD45/CD19 positive monotypic cells were used for the estimation of anti-CD5 antibodies bound per cell (ABC) and compared with CD45/CD19+ cells on control samples. Tubes with anti-immunoglobulin kappa and lambda light chains were used to confirm the presence of a monotypic B-cell population.
The gating strategy for CD45+/CD19+ monotypic B cells used to determine CD5 ABC is shown in Figure 1A. The generated values of CD5 ABC were used to calculate mean standard deviation and ranges for each subtype of B-cell neoplasm. To determine whether patterns of expression were significantly different between controls and lymphoproliferative neoplasms, we used an unpaired t test with the options of 2-tailed and 99% confidence interval.
Figure 1.
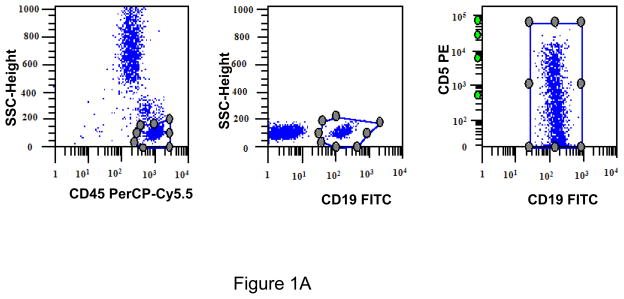
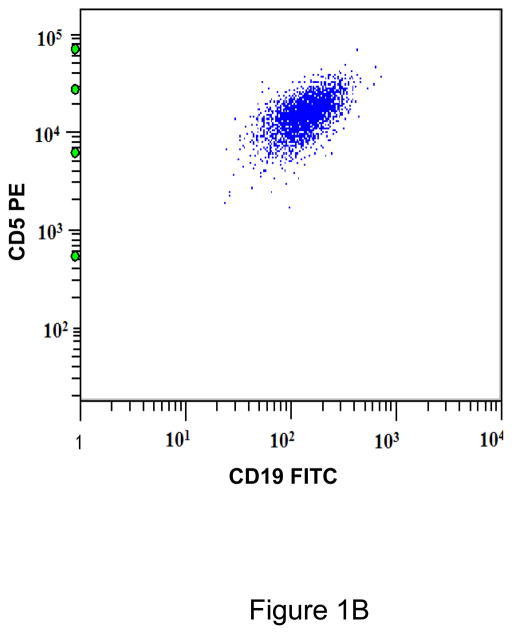
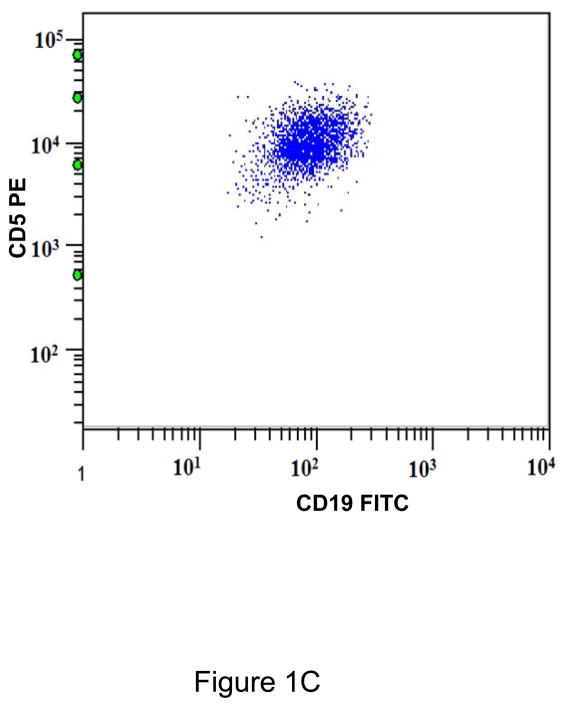
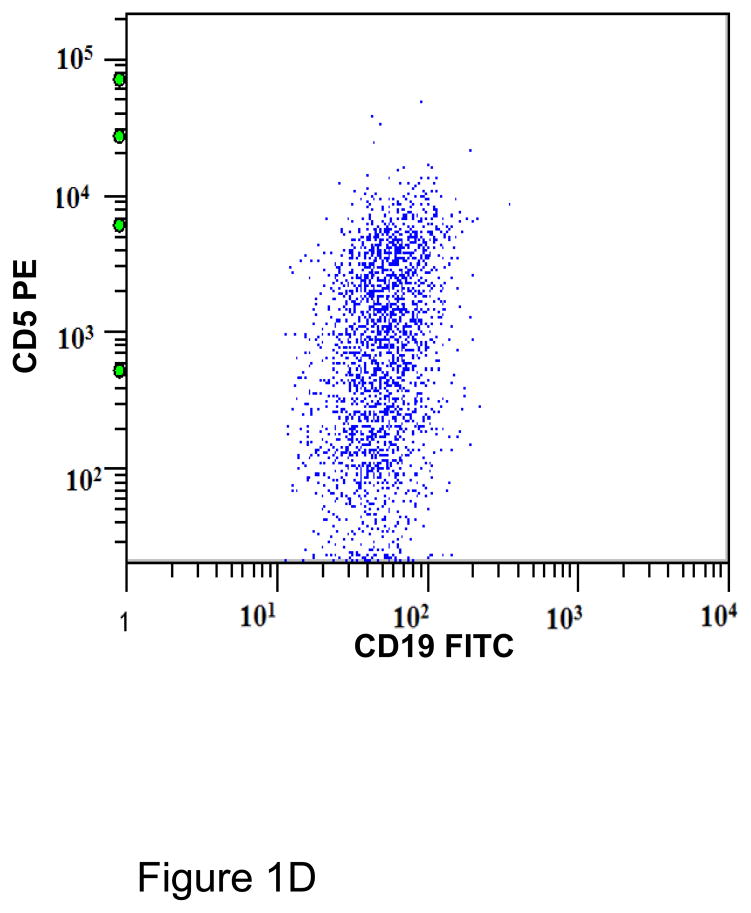
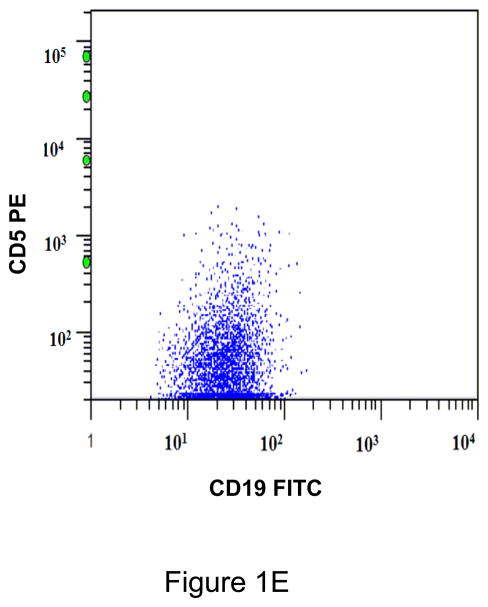
A. Gating strategy to determine antibodies bound per cell (ABC) values of CD5 in CD45+/CD19+ B cells. This specimen is peripheral blood of a normal donor and the CD19+ cells show a variable level of CD5 expression ranging from negative to positive. This is designated as a heterogeneous pattern of CD5 expression. B. This dot plot of a peripheral blood specimen of a patient with chronic lymphocytic leukemia (CLL) displays CD19+ cells with a high expression level of CD5, with a compact distribution, designated as a homogeneous positive pattern. C. This dot plot of a case of mantle cell lymphoma displays a homogeneous positive pattern of CD5 expression. D. This case of marginal zone lymphoma (MZL) displays a heterogeneous pattern of CD5 expression. E. This case of follicular lymphoma displays dim reactivity with CD19, and a dim/negative pattern of CD5 expression.
[The y-axis logarithmic numbers of figures 1A–1E refer to antibodies bound per cell].
A negative control threshold for CD5 expression was established using six normal peripheral blood samples, gating on NK cells (CD5-negative CD19-negative lymphocytes). The calculated median CD5 ABC values ranged from 31 to75, so B-cell populations with values >75 were scored as positive.
Patterns of CD5 expression in B cells were classified as homogeneous if a cluster of cells spanned up to 1.25 log on the CD5 ABC scale; if the cluster showed a greater spread the pattern was classified as heterogeneous.
Cytogenetic studies
Conventional cytogenetic analysis was performed on G-banded metaphase cells prepared from BM aspirate specimens of CLL using standard procedures. Twenty metaphases were assessed and the results were described using the International System for Human Cytogenetic Nomenclature.16 A 5-locus fluorescence in-situ hybridization (FISH) panel (Vysis/Abbott, Des Plaines, IL) was also utilized to aid in detecting common cytogenetic abnormalities associated with CLL. Interphase cells were analyzed from BM cultures using a panel of probes designed to detect deletion 13q14.3, deletion 13q34, trisomy 12, deletion of TP53 at 17p13, and deletion of ATM at 11q22.3.
Statistical analysis
Statistical analysis was done by GraphPad Prism Software, Inc. (La Jolla, California) and unpaired two tailed t-test was used for statistical comparisons between groups. A p value of less than 0.05 was considered to be statistically significant.
Results
Matutes Scoring System
We used the updated Matutes scoring system15 for the CLL subset, and 23 cases were classified as typical CLL and 8 cases as atypical CLL.
Patterns of CD5 expression in B cells
We observed 3 patterns of CD5 expression of B cells with regard to a threshold of 75 ABC to determine the pattern of CD5 expression for each case. In one pattern, events were seen on dot plots as a distinct, tight cluster of events above 75 ABC. For this study we designated this occurrence as a homogeneous expression pattern (or homogeneous positive). In the second pattern, events showed variable CD5 expression, partially above and partially below the threshold of 75 ABC and we designated this occurrence as a heterogeneous expression pattern (or heterogeneous positive). A third pattern was when a tight cluster of events was entirely below 75 ABC and designated as homogeneous negative. Representative patterns are shown in Figure 1.
All CD19+ B cells of normal controls showed a heterogeneous pattern of CD5 expression (Figure 1A). Most cases of CLL (21/23; 91%)(Figure 1B), atypical CLL (7/8; 88%), and mantle cell lymphoma (11/12; 92%)(Figure 1C) showed a homogeneous positive pattern. One case of atypical CLL showed a heterogeneous pattern. Among cases of MZL, 3 of 7 (42%) showed heterogeneous pattern (Figure 1D), 2 (29%) showed a homogeneous negative pattern, and 2 (29%) showed a homogeneous positive pattern. In contrast, 7/8 (88%) cases of follicular lymphoma showed a homogeneous negative pattern (Figure 1E), and 1/8 (12%) showed a homogeneous positive pattern. One of 4 (25%) LPL/WM and 1 of 3 (33%) HCL cases showed a heterogeneous positive pattern, whereas the remaining cases showed a homogeneous negative pattern. (Table 1)
Table 1.
Quantitative median CD5 ABC levels and patterns of CD5 expression in B cells of normal controls and small B-cell neoplasms
| Diagnosis (# cases) | Pattern of Expression | ||||||
|---|---|---|---|---|---|---|---|
| Homogeneous negative | Heterogeneous | Homogeneous positive | Mean | Standard deviation | Range | P-value | |
| Normal (n, 15) | 15 | 315 | 142 | 145 – 568 | |||
| CLL/SLL (n, 23) | 2 | 21 | 8877 | 5708 | 169 – 21017 | <0.0001 | |
| Atypical CLL/SLL (n, 8) | 1 | 7 | 4475 | 4141 | 396 – 11536 | 0.0007 | |
| MCL (n, 12) | 1 | 11 | 5371 | 3331 | 126 – 10254 | <0.0001 | |
| MZL (n, 7) | 2 | 3 | 2 | 234 | 253 | 19 – 770 | 0.3447 |
| HCL (n, 3) | 2 | 1 | 178 | 139 | 96 – 338 | 0.1443 | |
| LPL (n, 4) | 3 | 1 | 140 | 139 | 34 – 344 | 0.0410 | |
| FL (n, 8) | 7 | 1 | 46 | 17 | 29 – 82 | <0.0001 | |
CLL/SLL: Chronic lymphocytic leukemia/small lymphocytic lymphoma
MCL: Mantle cell lymphoma
MZL: Marginal zone lymphoma
HCL: Hairy cell leukemia
LPL: Lymphoplasmacytic lymphoma
FL: Follicular lymphoma
P-values reflect comparison with B-cell of normal controls.
CD5 ABC values in B cells of normal controls and small B-cell neoplasms
CD5 expression levels in typical and atypical CLL cases were significantly higher than were expression levels in normal control B cells (p<.05). (Figure 2; Table 1). Similarly, CD5 expression levels in mantle cell lymphoma cases were significantly higher compared with B-cells of normal controls (p<0.05), but not different from CLL. In contrast, CD5 expression levels in other small B-cell neoplasms were lower. The cases of MZL had CD5 expression levels similar to normal control B-cells (p=0.34)(Figure 2) and these levels were significantly lower than CD5 expression levels in CLL, both typical and atypical (p<.05). All three hairy cell leukemia cases had CD5 expression levels similar to control B cells (p=0.14). CD5 expression levels in follicular lymphoma and LPL/WM were significantly lower than levels of normal control B cells (p<0.05).
Figure 2.
Comparison of quantitative expression of CD5 between B cells of normal controls and small B-cell neoplasms
Conventional cytogenetic analysis was carried out in 20 of 23 cases of typical CLL [17 were diploid, 1 was hypodiploid, 1 was hyperdiploid and 1 showed del(11q)]. Seven of 8 cases of atypical CLL had conventional cytogenetic analysis (3 were diploid, 1 showed trisomy 12, 1 showed −Y, 1 showed +Y and 1 was hyperdiploid). FISH analysis was carried out in 22 of 23 cases of typical CLL (9 showed normal pattern, 6 showed del13q14.3/D13S319, 5 showed trisomy 12, 3 showed del11q22.3/ATM, 1 showed del17q13.1/TP53, 1 showed del13q34/LAMP1; 3 cases had 2 abnormalities each). There was no difference in CD5 expression levels between cases with and without trisomy 12 among cases of CLL (p=0.3495).
DISCUSSION
Flow cytometry immunophenotypic analysis is essential for the diagnosis of small B-cell lymphomas and leukemias. In addition to establishing clonality by assessment of immunoglobulin light chains, expression of various antigens is characteristic of certain types of B-cell lymphoma. CD5 is particularly helpful to assess since this antigen is typically expressed in CLL/SLL and mantle cell lymphoma, and not in other types of small B-cell neoplasms. However, rarely CD5 is expressed in other small cell neoplasms and this can cause problems in differential diagnosis. We hypothesize that small B-cell neoplasms express varying levels of CD5 and that quantification of CD5 expression levels may be helpful for differential diagnosis. Our results show that quantitative analysis of CD5 expression levels is indeed helpful. CD5 expression levels are typically high in CLL/SLL and mantle cell lymphoma and the pattern of expression is distinctive. In contrast, CD5 expression levels are significantly lower in other types of small B-cell neoplasms as well as in control B-cells from normal donors and the pattern of expression is usually heterogeneous.
There were some examples of overlap in mean CD5 ABC between CLL/SLL and MZL. In particular, the lower range of expression of CLL/SLL cases, particularly atypical CLL, overlapped with the upper range of MZL cases. There were only 2 cases of MZL with moderately high CD5 expression levels and a homogeneous positive pattern that could cause problems in differential diagnosis. Therefore, CD5 expression levels would be theoretically helpful in 56 of 58 (97%) cases assessed in this study. In addition, the levels of CD5 expression in follicular lymphoma and LPL/WM were significantly lower than expression in control B cells. These low levels of CD5 expression could be helpful as an adjunct to distinguishing follicular lymphoma or LPL/WM from background normal B cells in the assessment of minimal residual disease (MRD) after therapy.
Others have used a quantitative approach to assess various markers in B-cell leukemias and lymphomas. Perhaps the most common antigen quantified has been CD20 in patients with CLL/SLL, however, CD5 quantification also was used by D’Arena et al 17 in a series of small B-cell neoplasms. D’Arena et al 17 demonstrated that the highest levels of CD5 were seen in CLL/SLL, mantle cell lymphoma and MZL, however, the frequency of cases with high CD5 levels was variable: 100% in CLL/SLL, 80% in mantle cell lymphoma and <20% in MZL cases. Our experience differs somewhat in that almost all cases of mantle cell lymphoma expressed CD5 and < 10% of MZL cases expressed CD5.(9) Although the explanation for these differences between our results and the earlier study is not readily apparent, it is noteworthy that the levels of calibration were different for the antibody binding capacity (ABC). D’Arena and colleagues used sets of beads carrying 1,400, 14,000, 36,600, and 182,000 molecules, compared with the beads in this study with 474, 5,359, 23,843 and 62,336 molecules. Other factors that may explain the differences between studies include the staining protocol, antibody clone, and fixation methods.18
Compared with earlier studies, we analyzed a wider spectrum of small B-cell neoplasms for CD5 expression levels including CLL with typical and atypical features, mantle cell lymphoma, MZL, follicular lymphoma, LPL/WM, and hairy cell leukemia. We also showed distinctive patterns of CD5 expression in various lymphoproliferative disorders. CLL/SLL cases demonstrate high expression levels of CD5 in a homogeneous pattern in virtually all cases in our study. This is also true for cases of mantle cell lymphoma. In contrast, MZLs have significantly lower CD5 expression levels and more often have a heterogeneous pattern of CD5 expression. Other small B-cell neoplasms assessed in this study rarely expressed CD5 and at very low levels. There were differences between our results and the study by D’Arena et al.17 In the earlier study the authors showed that CD5 levels were much higher in CLL and mantle cell lymphoma cases, although only about ~20% of cases. D’Arena et al17 also reported that levels of CD5 expression in follicular lymphoma are higher than in normal controls, the opposite of what we have observed. The cause of these discrepancies between our study and D’Arena et al 17 are not readily apparent, but gating strategies may have played a role.
Since the studies of D’Arena et al 17 published in 2000, few studies have focused on quantitative analysis by flow cytometry immunophenotyping. However, antigen intensity is commonly estimated qualitatively in routine practice (i.e. bright, moderate, or dim). Although valuable, qualitative assessment has limitations. Historically, routine assessment often uses percentages and compares expression with the distribution of an isotype. Typically, a 20% cutoff over the isotype boundary is used to designate a marker as positive or negative and this is clearly arbitrary. Therefore, small changes in the isotype gating may lead to artifactual results with false positive or false negatives. Another inherent problem with qualitative assessment of antigen expression is that fluorochromes used to label antibodies carry different intensities; for example FITC is inherently dim whereas PE is inherently bright, and dim fluorochromes more often show a suboptimally low signal-to-noise ratio. Relatively dim expression could be missed with dimmer fluorochromes, creating a possible false negative.
It seems to us that many of the shortcomings of qualitative antigen assessment can be overcome by the use of quantitative flow cytometry, which assigns an absolute value to the different fluorescence levels and with standardization may achieve similar values between different instruments, and different laboratories. Therefore, we think it is likely that quantitative assessment of antigen expression is going to achieve a place in the workup of small B-cell neoplasms as well as other diseases. There are recent examples to support this idea. In patients with CLL/SLL, quantitative analysis of CD38 and CD20 has been used to predict prognosis.12, 19 Similarly, quantification of CD64 expression by neutrophils has been used to assess inflammatory processes, and CD38 quantification by CD8+ T cells is used as a prognostic marker in acquired immunodeficiency syndrome. However, we also acknowledge that there are multiple technical considerations in the adoption of a quantitative flow cytometry assay, that include methodology to quantitate, use of fixative or PBS, variation in the quantibrite lot numbers, clones and their valency (Fab vs immunoglobulin), saturation of antibody, and 1:1 conjugation. It seems likely that some of these issues will be overcome as quantitative assessement achives wider use.
References
- 1.DiGiuseppe JA, Borowitz MJ. Clinical utility of flow cytometry in the chronic lymphoid leukemias. Semin Oncol. 1998;25:6–10. [PubMed] [Google Scholar]
- 2.Catovsky D, Muller-Hermelink HK, Ralfkiaer E. T-cell Prolymphocytic Leukaemia. In: Swerdlow SHCE, Harris NL, Jaffe ES, Pileri SA, Stein H, Thiele J, Vardiman JW, editors. WHO Classification of Tumours of Haematopoietic and Lymphoid Tissues. 4. Lyon: International Agency for Research on Cancer; 2008. pp. 270–271. [Google Scholar]
- 3.Bueso-Ramos C. Metastatic Kaposi Sarcoma. In: Medeiros LJ, editor. Diagnostic Pathology: Lymph Nodes and Spleen with Extranodal Lymphomas. 1. Altona, Manitoba: Amirsys, Inc; 2011. pp. 12–24–12–29. [Google Scholar]
- 4.Dono M, Cerruti G, Zupo S. The CD5+ B-cell. Int J Biochem Cell Biol. 2004;36:2105–11. doi: 10.1016/j.biocel.2004.05.017. [DOI] [PubMed] [Google Scholar]
- 5.Dalloul A. CD5: a safeguard against autoimmunity and a shield for cancer cells. Autoimmun Rev. 2009;8:349–53. doi: 10.1016/j.autrev.2008.11.007. [DOI] [PubMed] [Google Scholar]
- 6.Carsetti R, Rosado MM, Wardmann H. Peripheral development of B cells in mouse and man. Immunol Rev. 2004;197:179–91. doi: 10.1111/j.0105-2896.2004.0109.x. [DOI] [PubMed] [Google Scholar]
- 7.Ballesteros E, Osborne BM, Matsushima AY. CD5+ low-grade marginal zone B-cell lymphomas with localized presentation. Am J Surg Pathol. 1998;22:201–7. doi: 10.1097/00000478-199802000-00008. [DOI] [PubMed] [Google Scholar]
- 8.Baseggio L, Traverse-Glehen A, Petinataud F, et al. CD5 expression identifies a subset of splenic marginal zone lymphomas with higher lymphocytosis: a clinico-pathological, cytogenetic and molecular study of 24 cases. Haematologica. 2010;95:604–12. doi: 10.3324/haematol.2009.011049. [DOI] [PMC free article] [PubMed] [Google Scholar]
- 9.Jaso J, Chen L, Li S, et al. CD5-positive mucosa-associated lymphoid tissue (MALT) lymphoma: a clinicopathologic study of 14 cases. Hum Pathol. 2012;43:1436–43. doi: 10.1016/j.humpath.2011.11.004. [DOI] [PubMed] [Google Scholar]
- 10.Konoplev S, Medeiros LJ, Bueso-Ramos CE, Jorgensen JL, Lin P. Immunophenotypic profile of lymphoplasmacytic lymphoma/Waldenstrom macroglobulinemia. Am J Clin Pathol. 2005;124:414–20. doi: 10.1309/3G1X-DX0D-VHBN-VKB4. [DOI] [PubMed] [Google Scholar]
- 11.Dong HY, Gorczyca W, Liu Z, et al. B-cell lymphomas with coexpression of CD5 and CD10. Am J Clin Pathol. 2003;119:218–30. doi: 10.1309/u98advkuc26r2rja. [DOI] [PubMed] [Google Scholar]
- 12.Tam CS, Otero-Palacios J, Abruzzo LV, et al. Chronic lymphocytic leukaemia CD20 expression is dependent on the genetic subtype: a study of quantitative flow cytometry and fluorescent in-situ hybridization in 510 patients. Br J Haematol. 2008;141:36–40. doi: 10.1111/j.1365-2141.2008.07012.x. [DOI] [PubMed] [Google Scholar]
- 13.Matutes E, Owusu-Ankomah K, Morilla R, et al. The immunological profile of B-cell disorders and proposal of a scoring system for the diagnosis of CLL. Leukemia. 1994;8:1640–5. [PubMed] [Google Scholar]
- 14.Swerdlow SHCE, Harris NL, Jaffe ES, Pileri SA, Stein H, Thiele J, Vardiman JW, editors. WHO Classification of Tumours of Haematopoietic and Lymphoid Tissues. 4. Lyon: IARC; 2008. [Google Scholar]
- 15.Moreau EJ, Matutes E, A’Hern RP, et al. Improvement of the chronic lymphocytic leukemia scoring system with the monoclonal antibody SN8 (CD79b) Am J Clin Pathol. 1997;108:378–82. doi: 10.1093/ajcp/108.4.378. [DOI] [PubMed] [Google Scholar]
- 16.Shaffer LG, LJC, Slovak ML An International System for Human Cytogenetic Nomenclature. 2009 Recommendations of the International Standing Committee on Human Cytogenetic Nomenclature. Basel/CH: S Karger AG; 2009. [Google Scholar]
- 17.D’Arena G, Musto P, Cascavilla N, Dell’Olio M, Di Renzo N, Carotenuto M. Quantitative flow cytometry for the differential diagnosis of leukemic B-cell chronic lymphoproliferative disorders. Am J Hematol. 2000;64:275–81. doi: 10.1002/1096-8652(200008)64:4<275::aid-ajh7>3.0.co;2-y. [DOI] [PubMed] [Google Scholar]
- 18.Davis KA, Abrams B, Iyer SB, Hoffman RA, Bishop JE. Determination of CD4 antigen density on cells: role of antibody valency, avidity, clones, and conjugation. Cytometry. 1998;33:197–205. doi: 10.1002/(sici)1097-0320(19981001)33:2<197::aid-cyto14>3.0.co;2-p. [DOI] [PubMed] [Google Scholar]
- 19.Hsi ED, Kopecky KJ, Appelbaum FR, et al. Prognostic significance of CD38 and CD20 expression as assessed by quantitative flow cytometry in chronic lymphocytic leukaemia. Br J Haematol. 2003;120:1017–25. doi: 10.1046/j.1365-2141.2003.04213.x. [DOI] [PubMed] [Google Scholar]


