

Abstract
A mononuclear zinc complex has been found to exhibit unexpected selectivity for biologically important diphosphate anions (PPi and ADP). The diphosphate binding could turn-on the ESIPT, whose study reveals mechanistic insight to aid the future design of new sensors.
Phosphate-containing anionic species1 are ubiquitous in biological systems and play important mediatory roles in signal transduction pathways, as well as in carrying genetic information.2 Design of fluorescent chemosensors for biologically relevant anions remains to be a challenging topic.3–6 This is due to the lack of general design principle that can reliably translate an anion-binding event to a large fluorescent signal response.3 Most of the developed phosphate anion sensors are based on the binuclear Zn(II) complexes such as 1-Zn, where two zinc centers are properly positioned to provide improved selectivity for anions such as pyrophosphate (PPi)7–14 and adenosine 5′-triphosphate (ATP).3,10,15,16 The fluorescence response of these sensors, however, exhibit little spectral shift in the fluorescence signal, which lowers the sensitivity and hampers their practical applications. Continuing interests exist in searching for new sensor mechanisms that can generate a large spectral response upon selective recognition of PPi anion. While the binuclear Zn(II) complexes are widely regarded as a popular mechanism for selective detection of polyphosphates PPi and ATP, very few mononuclear Zn(II) complexes have shown useful fluorescence response for polyphosphates such as adenosine 5′-diphosphate (ADP),17,18 PPi19,20,21,22 and ATP.18,23 In addition, none of the existing sensors is able to induce a large spectral shift upon binding to polyphosphates, which limits their practical application. The most recent example of mononuclear-based PPi sensor is based on fluorescence turn-on.22
Recently we reported the pyrophosphate sensor 2-Zn complex, whose blue emission (~420 nm) is shifted by about 100 nm to ~518 nm upon addition of PPi in HEPEs buffer.24 The unusually large bathochromic shift from 2-Zn is attributed to the PPi binding-induced turn-on of the excited state intramolecular proton transfer (ESIPT). While the binuclear complex 2-Zn has two Zn(II) sites, the site II linking to the phenoxide is responsible for the switch-on and off of ESIPT. A fundamental question is whether the 1,3-binuclear Zn(II) complex is essential for the ESIPT turn-on mechanism. In an effort to elucidate the intriguing PPi binding-induced ESIPT turn-on mechanism, we decided to further examine the structure and PPi binding of 3-Zn which only has one Zn(II) site.
Synthesis and structure of 3 and its zinc complex
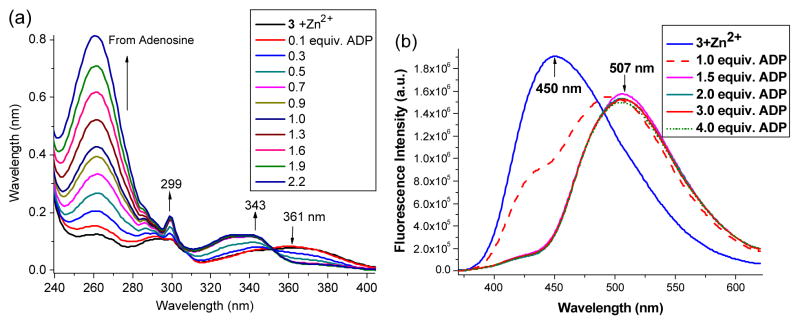
Ligand 3 was synthesized as a white solid (m.p. 118–120°C) by using a modified procedure.24 In order to gain a better understanding on the ESIPT ON and OFF, titration of 3 was studied by addition of Zn(NO3)2. The absorption peak of 3 in EtOH (λmax=343 nm) was red-shifted to λmax=361 nm, as a consequence of deprotonation Ph–OH → Ph–O− (Figure 1a). A clear isobestic point was observed at about 352 nm, in agreement with the proposed formation of 3-Zn (Scheme 1). The assumption was supported by high resolution mass spectroscopy (HRMS) which detected the molecular ion at 535.075, corresponding to [3+Zn2++Cl−]+ (the calcd mass for C27H24ClN4O2Zn: 435.0879) (ESI Figure S10). The mass spectroscopy also detected the dimer (3-Zn)2, whose optical absorption could be very similar to 3-Zn. When using PF6− (KPF6) as the counter anion, a single crystals of 3-Zn was obtained from its acetonitrile solution by slow evaporation. The crystal structure of 3-Zn revealed the zinc binding pattern, where Zn2+ cation is connected to the phenoxide oxygen (Figure 2). The Zn2+ center also contained weak ligands (halide and water), which might be easily replaced.
Fig. 1.

UV-vis (a) and fluorescence spectra (b) of 3 (10 μM) in EtOH upon addition of different equivalent of Zn(NO3)2. Fluorescence spectra were acquired while the sample being excited at the isobestic point ~352 nm.
Scheme 1.

An ESIPT sensor containing two Zn(II) sites (2-Zn) and one Zn(II) site (3-Zn). PPi binding to 3-Zn leads to the recover of phenol, thereby turning-on the ESIPT.
Fig. 2.

X-Ray structure of 3-Zn in the front view (a) and side view (b) of benzoxazole fragment, where the Cl, N, O, and C atoms are in green, blue, red and grey colors, respectively.
1H NMR titration of 3 by addition of Zn2+ revealed further details on the zinc complexation (Figure 3). Clear binding of Zn2+ to both pyridine rings was observed, as the chemical shift of the pyridyl protons Ha in 3 was shifted from 8.41 ppm to ~8.66 ppm. The phenyl protons Hd also exhibited significant downfield shift, in agreement with the zinc binding to the phenol group. When 1.0 equiv. of Zn2+ was added, the signal ratio of Ha:Hd was approaching 2:1, indicating that the reaction was complete (to form the complex 3-Zn). The result showed that the species formed in solution was consistent with the structure found in the crystalline state (Figure 2). It was also noted that the 1H NMR detected two –CH3 signals: 2.3 (major) and 2.4 ppm (minor). The peak at 2.4 ppm was increasing when the Zn2+ cation was less than 0.5 equiv, then decreasing when the Zn2+ cation was larger than 0.5 equiv. It was likely that the chemical equilibrium “3 + Zn2+” not only gave 3-Zn as a major species (1H signal at 2.3 ppm), but could also gave (3)2-Zn such as 5 as the intermediate species, which was also detected in ESI-MS (Figure S10–S14). The sharp Hd and Hd′ signals at 7.62 and 7.32 ppm were detected only after 0.5 equiv of Zn2+ was added, suggesting that significant 5 could be involved in the initial stage. When the Zn2+ concentration was increased (i.e. > 0.5 equiv), the equilibrium in the solution was driven toward the formation of 3-Zn.
Fig. 3.

1H NMR of 3 (10 μM) in CD3OD upon addition of different equivalent of Zn(NO3)2.
Addition of Zn2+ cation to 3 increased fluorescence intensity at 445 nm (Figure 1b). During the formation of 3-Zn complex, the Zn2+ cation was connected to both dipicolylamine (DPA) and phenol segments. It should be noted that DPA is a stronger zinc-chelating group.25 When Zn2+ cation was added to 3 in CH2Cl2, the cation was found to only bound to the DPA group (ESI Figure S5), while the fluorescence intensity at ~504 nm was increased by a factor of ~2 (ESI Figure S4). The origin of the observed fluorescence turn-on, therefore, was partially associated with Zn2+-binding to DPA.
Addition of Zn2+ cation also caused the emission color of 3 (λem~530 nm, green color) to shift to blue (λem~445 nm), as a consequence of forming 3-Zn, which disabled the ESIPT as the phenol was connected to the Zn2+ cation (Figure 1). The fluorescent response of complex 3-Zn was examined by addition of 5 equiv. of different anions (Figure 4). Addition of diphosphate anion ADP or hydrogen pyrophosphate H2PPi to 3-Zn in EtOH caused a notable spectral shift (from 447 to 504 nm), indicating the release of the phenolic group to turn on the ESIPT (Figure 4). The acidic species H2P2O72− was assumed to be in equilibrium with HP2O73−, i.e. H2P2O72− ↔ HP2O73− + H+, where the dissociated proton could facilitate the cleavage of phenoxide-Zn bond: PhO–Zn(II) + H+ → PhOH. Interestingly, the sensor was silent to monophosphate AMP and triphosphate ATP. The sensor was also silent to physiologically important anions such as acetate and citrate (ESI, Figure S3). The fluorescence turn-on at about 504–510 nm, however, was not observed when the “3-Zn” was examined in HEPES buffer under the same concentration.
Fig. 4.

Fluorescence response of 3-Zn complex (10 μM) with different phosphate anions (5 equivalents) in ethanol (top, excited at the isobestic point ~352 nm). Fluorescence images of 3, 3+Zn2+, “3+Zn2+ + PPi,” and “3+Zn2+ + ADP” in ethanol (bottom). And the structures of phosphate anions.
Binding of PPi to 3-Zn complex
From the ethanol solution containing 3-Zn and H2PPi, the mass spectrometry detected the cationic species [3-Zn + H2PPi2− + H+ + Na+]+ (calcd for C27H26N4NaO9P2Zn: 699.0364) (Figure 5a). 1H NMR titration of H2PPi further revealed that addition of H2PPi caused Ha signal to shift downfield to ~8.75 ppm (Figure 6), indicating that the H2PPi was bound to the Zn2+ center. Since no pyridyl signal was detected at ~8.4 ppm (for Ha in the ligand 3), one can assume that the pyridine rings remained to be connected to the Zn2+ cation. On the basis of these experimental evidences, we proposed that the addition of H2PPi to 3-Zn initially formed adduct 6 via binding with one end of pyrophosphate. This step was relatively fast due to stronger electrostatic attraction between the cation and phosphate. In the second step, the other end of H2PPi would attack the Zn2+ cation, leading to 7, in which the phenoxide–Zn bond was weakened (Scheme 2). The intramolecular proton transfer in 7 could assist the formation of the phenol fragment in 8, which is necessary for ESIPT turn-on. The proposed formation of 8 was consistent with the proton NMR (Figure 6), where the signal Hb of 3-Zn was shifted upfield to ~7.84 ppm upon addition of PPi (as the binding environment at Zn2+ cation changed). The observed peak broadening in the 1H NMR was in agreement with the proposed equilibrium between 7 and 8. The 1H signals Hd and Hd′ were notably shifted from 7.63 and 7.32 ppm to 7.58 and 7.27 ppm, respectively, in consistence with the detachment of Zn2+ from the phenolic oxygen. In the proposed mechanism, a diphosphate fragment was necessary to provide a strong phosphate-Zn interaction to weaken the phenoxide-Zn bond as shown in 7, which could be the reason why the sensor 3-Zn was not responding to monophosphate AMP.
Fig. 5.

ESI-MS spectra of [3-Zn + H2PPi2− H+ + Na+]+ (a) and [3-Zn + ADP +Na]+” (b); The samples were prepared by addition of diphosphates to 3-Zn solution in ethanol.
Fig. 6.

1H NMR titration of “3+Zn2+” with hydrogen pyrophosphate H2PPi in CD3OD
Scheme 2.

The proposed binding between 3-Zn and pyrophosphate PPi.
Upon addition of one equivalent PPi to “3+Zn2+”, UV-vis absorption revealed some residual absorption at ~365 nm (Figure 7a), indicating that the formation of phenoxide was not complete. Addition of excess PPi was necessary to completely drive the equilibrium to the final product. The observation was in agreement with the proposed process in Scheme 2, where the excess PPi would shift the equilibrium to 8. Similar trend was also observed in the fluorescence response (Figure 7b), where the blue emission at ~445 nm was decreased by only about 50% with one equivalent PPi. Subsequent addition of more PPi decreased the emission at ~445 nm but did not increase the peak intensity at 512 nm. The emission band at 440 nm might be associated with 7, which could have stronger fluorescence than 3-Zn. The assumption of strong fluorescent 7 was understandable, as addition of an oxygen-containing species could significantly increase the fluorescence intensity of a HBO-zinc complex.26
Fig. 7.

Absorption (a) and fluorescence response (b) “3+Zn2+” (10 μM) in EtOH upon titration with PPi. The fluorescence spectra were acquired while the sample being excited at ~352 nm.
Binding of ADP to 3-Zn complex
As seen in Figure 4, the sensor 3-Zn exhibited the intriguing response to diphosphate ADP, while being silent to triphosphate ATP and monophosphates (AMP, K3PO4 and H3PO4; ESI Figure S3 and S4) under the same conditions. Upon addition of ADP, UV-vis absorption of 3-Zn at 361 nm gradually decreased, which was accompanied with the new absorption peaks at 343 and 299 nm (Figure 8). The observed spectral response indicated the cleavage of ArO–Zn bond, thereby releasing the phenol group as shown in 11. The mass spectrum detected the ADP adduct [11 + Na+]+ (from the solution of “3-Zn + ADP”), whose isotope pattern matched the calculated one (Calcd for C37H37N9NaO12P2Zn: 948.1226) (Figure 5b). The formation of the protonated species 11 was consistent with the observed ESIPT turn-on (Figure 4). Under the same experimental conditions, the corresponding ATP adduct was not detected from the mass spectrometry study of “3-Zn + ATP” sample (See ESI Figure S17).
Fig. 8.
UV-vis (a) titration and fluorescence response (b) of 3-Zn (10 μM) with ADP in ethanol.
In the proposed mechanism for the fluorescence turn-on, the less hindered phosphate of ADP would attack the Zn2+ center of 3-Zn to give 9, attributing to the electrostatic attraction. Intramolecular addition of the adjacent phosphate to Zn2+, in addition to the π-π interaction between HBO and adenosine units, could lead to 10, where the phenoxide “oxygen” could be detached from the Zn2+ cation. Protonation of the phenoxide would then lead to 11 to give ESIPT turn-on.
1H NMR of the ADP adduct 11 revealed that the pyridyl proton Ha was shifted downfield to 8.82 ppm, when the Zn–phenoxide bond in 3-Zn was replaced by the Zn–phosphate bond (with more ionic character) in 11. The characteristic signals Hc and Hb from adenosine were notably shifted upfield, possibly due to the π-π stacking interaction between HBO and the aminopurine unit of adenosine. The proton Hd′ on the phenol unit of 3-Zn at 7.32 ppm was shifted to 7.25 ppm (for ADP adduct) and 7.15 ppm (for ATP adduct), respectively, indicating the possible different π-π interaction patterns for ADP and ATP adducts. The molecular modeling revealed that the aromatic fragment from the adenosine, i.e. aminopurin unit, adopted different π-π interaction geometries in the ADP and ATP adducts (Figure 10). In the adduct 10, the aminopurin unit was parallel to HBO for stronger π-π interaction with the center of the HBO (Figure 10a). In contrast, the “aminopurin unit” in the corresponding ATP adduct 12 was perpendicular to HBO to interact with the phenol end of the HBO (Figure 10b). The estimated interplaner distances between the aminopurin and HBO were 4.3 Ǻ and 4.6 Ǻ for the ADP and ATP adducts, respectively, which are within the parallel π-π interaction distance (<5Ǻ).27 In the ATP adduct (Figure 10b), the proton Hd′ was located right above the aminopurin unit, which could give a stronger shielding effect (to shift the 1H NMR signal to upper field).
Fig. 10.

The molecular modeling of (a) “3-Zn + ADP” and (b) “3-Zn + ATP” adducts, showing the π-π interaction between HBO and aminopurine unit (of adenosine). The conformations were obtained by using Gaussian 09 (DFT with G-61 set) and plotted by using HyperChem software, where the P, N, O, and C-atoms are in yellow, blue, red and cyan colors, respectively.
In summary, the zinc complex 3-Zn responds selectively to diphosphate anions (PPi and ADP) to turn-on the ESIPT emission. On the basis of mass spectroscopy and spectroscopic evidences, the diphosphates bind to 3-Zn in 1:1 ratio, forming the corresponding adducts with defined chemical structures. Molecular modeling study, coupled with the 1H NMR evidences, points to that the complex 3-Zn binds ADP stronger than ATP, as the ADP adduct exhibits a more favorable parallel π-π interaction geometry than the ATP adduct. The overall study shows that the binding of the diphosphates anion can open the phenoxide–Zn bond, thereby turning on the ESIPT. The generated phenol group, however, appears to remain in the vicinity of the zinc cation (as shown in 11), which gives the ESIPT fluorescence at ~509 nm (slightly less than the λem=530 nm for 3).
The study demonstrates a new sensor for diphosphate anions by integrating the mononuclear Zn(II) complex with ESIPT. In comparison with the known sensors, which are mainly dependent on the fluorescence intensity changes, the new sensor is able to give a large spectral shift (by 57–67 nm) upon binding to PPi or ADP, which is useful for the naked eye detection. In addition, the induced fluorescence exhibits a large Stokes’ shift (~169 nm). These attractive features, in addition to the excellent selectivity, would be useful for practical detection of PPi or ADP.
Supplementary Material
Fig. 9.

1H NMR of zinc complex “3 +Zn2+” in CD3OD (a) upon addition of ADP (b) or ATP (c). In the spectra (b) and (c), the NMR solutions were saturated by the ADP or ATP (due to their poor solubility), respectively. The signals for Hd and Hd′ protons on the phenol segment are indicated by arrows. The 1H NMR of ADP and ATP are acquired to aid the spectral assignment (d).
Scheme 3.

The proposed binding structure between 3-Zn and ADP.
Acknowledgments
This work was supported by National Institute of Health (Grant No: 1R15EB014546-01A1). We also thank the Coleman endowment from the University of Akron for partial support.
Notes and references
- 1.Heinonen JK. Biological Role of Inorganic Pyrophosphate. Kluwer Academic Publishers; Boston: 2001. [Google Scholar]
- 2.Drewry JA, Fletcher S, Hassan H, Gunning PT. Org Biomol Chem. 2009;7:5074. doi: 10.1039/b917692f. [DOI] [PubMed] [Google Scholar]
- 3.Ojida A, Takashima I, Kohira T, Nonaka H, Hamachi I. J Am Chem Soc. 2008;130:12095. doi: 10.1021/ja803262w. [DOI] [PubMed] [Google Scholar]
- 4.O’Neil EJ, Smith BD. Coord Chem Rev. 2006;250:3068. [Google Scholar]
- 5.Martínez-Máñez R, Sancenon F. Chem Rev. 2003;103:4419. doi: 10.1021/cr010421e. [DOI] [PubMed] [Google Scholar]
- 6.Beer PD, Gale PA. Angew Chem Int Ed. 2001;40:486. [PubMed] [Google Scholar]
- 7.Ojida A, Mito-oka Y, Inoue Ma, Hamachi I. J Am Chem Soc. 2002;124:6256. doi: 10.1021/ja025761b. [DOI] [PubMed] [Google Scholar]
- 8.Lee DH, Im JH, Son SU, Chung YK, Hong JI. J Am Chem Soc. 2003;125:7752. doi: 10.1021/ja034689u. [DOI] [PubMed] [Google Scholar]
- 9.Ojida A, Mito-oka Y, Sada K, Hamachi I. J Am Chem Soc. 2004;126:2454. doi: 10.1021/ja038277x. [DOI] [PubMed] [Google Scholar]
- 10.Ojida A, Nonaka H, Miyahara Y, Tamaru S, Sada K, Hamachi I. Angew Chem, Int Ed. 2006;45:5518. doi: 10.1002/anie.200601315. [DOI] [PubMed] [Google Scholar]
- 11.McDonough MJ, Reynolds AJ, Lee WYG, Jolliffe KA. Chem Commun. 2006;2006:2971. doi: 10.1039/b606917g. [DOI] [PubMed] [Google Scholar]
- 12.Lee HN, Xu Z, Kim SK, Swamy KMK, Kim Y, Kim SJ, Yoon J. J Am Chem Soc. 2007;129:3828. doi: 10.1021/ja0700294. [DOI] [PubMed] [Google Scholar]
- 13.Rhee HW, Lee CR, Cho SH, Song MR, Cashel M, Choy HE, Seok YJ, Hong JI. J Am Chem Soc. 2008;130:784. doi: 10.1021/ja0759139. [DOI] [PubMed] [Google Scholar]
- 14.Shin IS, Bae SW, Kim H, Hong JI. Anal Chem. 2010;82:8259. doi: 10.1021/ac1017293. [DOI] [PubMed] [Google Scholar]
- 15.Ngo HT, Liu X, Jollife KA. Chem Soc Rev. 2012;41:4928. doi: 10.1039/c2cs35087d. [DOI] [PubMed] [Google Scholar]
- 16.Kurishita Y, Kohira T, Ojida A, Hamachi I. J Am Chem Soc. 2010;132:13290. doi: 10.1021/ja103615z. [DOI] [PubMed] [Google Scholar]
- 17.Shi L, Hu P, Ren Y, Feng G, Shi L, Hu P, Ren Y, Feng G. Chem Commun. 2013;49:11704. doi: 10.1039/c3cc47437b. [DOI] [PubMed] [Google Scholar]
- 18.Rao AS, Kim D, Nam H. Chem Commun. 2012;48:3206. doi: 10.1039/c2cc17629g. [DOI] [PubMed] [Google Scholar]
- 19.Shao N, Wang H, Gao X, Yang R, Chan W. Anal Chem. 2010;82:4628. doi: 10.1021/ac1008089. [DOI] [PubMed] [Google Scholar]
- 20.Das P, Bhattacharya S, Mishra S, Das A. Chem Commun. 2011;47:8118. doi: 10.1039/c1cc12682b. [DOI] [PubMed] [Google Scholar]
- 21.Roy B, Rao AS, Ahn KH. Org Biomol Chem. 2011;9:7774. doi: 10.1039/c1ob05999h. [DOI] [PubMed] [Google Scholar]
- 22.Bhowmik S, Ghosh BN, Marjomäki V, Rissanen K. J Am Chem Soc. 2014 doi: 10.1021/ja4128949. [DOI] [PubMed] [Google Scholar]
- 23.Moro AJ, Cywinski PJ, Korsten S, Mohr GJ. Chem Commun. 2010;46:1085. doi: 10.1039/b919661g. [DOI] [PubMed] [Google Scholar]
- 24.Chen W, Xing Y, Pang Y. Org Lett. 2011;13:1262. doi: 10.1021/ol200054w. [DOI] [PubMed] [Google Scholar]
- 25.Kikuchi K, Komatsu K, Nagano T. Curr Opin Chem Biol. 2004;8:182. doi: 10.1016/j.cbpa.2004.02.007. [DOI] [PubMed] [Google Scholar]
- 26.Wang J, Chu Q, Liu X, Wesdemiotis C, Pang Y. J Phys Chem B. 2013;117:4127. doi: 10.1021/jp401612u. [DOI] [PMC free article] [PubMed] [Google Scholar]
- 27.Headen TF, Howard CA, Skipper NT, Wilkinson MA, Bowron DT, Soper AK. J Am Chem Soc. 2010;132:5735. doi: 10.1021/ja909084e. [DOI] [PubMed] [Google Scholar]
Associated Data
This section collects any data citations, data availability statements, or supplementary materials included in this article.