Abstract
Objective
Obesity-associated hyperestrogenism and hyperinsulinemia contribute significantly to the pathogenesis of endometrial cancer. We recently demonstrated that metformin, a drug long used for treatment of type 2 diabetes, attenuates both insulin- and estrogen-mediated proliferative signaling in the obese rat endometrium. In this study, we sought to identify tissue biomarkers that may prove clinically useful to predict tissue response for both prevention and therapeutic studies. We identified CGRRF1 (Cell growth regulator with ring finger domain 1) as a novel metformin-responsive gene and characterized its possible role in endometrial cancer prevention.
Methods
CGRRF1 mRNA expression was evaluated by RT-qPCR in the endometrium of obese and lean rats, and also in normal and malignant human endometrium. CGRRF1 levels were genetically manipulated in endometrial cancer cells, and its effects on proliferation and apoptosis were evaluated by MTT and western blot.
Results
CGRRF1 is significantly induced by metformin treatment in the obese rat endometrium. In vitro studies demonstrate that overexpression of CGRRF1 inhibits endometrial cancer cell proliferation. Analysis of human endometrial tumors reveal that CGRRF1 expression is significantly lower in hyperplasia, Grade 1, Grade 2, Grade 3, MMMT, and UPSC endometrial tumors compared to normal human endometrium (p<0.05), suggesting that loss of CGRRF1 is associated with the presence of disease.
Conclusion
CGRRF1 represents a novel, reproducible tissue marker of metformin response in the obese endometrium. Furthermore, our preliminary data suggests that up-regulation of CGRRF1 expression may prove clinically useful in the prevention or treatment of endometrial cancer.
Keywords: Obesity, metformin, estrogen, insulin resistance
Introduction
The worldwide obesity epidemic has produced profound effects on public health. Greater than two-thirds of American adults are currently reported to be overweight or obese [1, 2]. In addition to increasing the incidence of heart disease, stroke, and type 2 diabetes (T2D), epidemiologic studies have linked the risk of several types of cancer to both obesity and insulin resistance [3, 4]. Type 2 diabetics taking metformin (an oral anti-hyperglycemic drug) were reported to have a reduced risk of cancer [5], sparking a flurry of research investigating metformin as an antineoplastic agent in a variety of obesity-associated tumor types [6-8].
Of all cancers, endometrial cancer is most closely linked to obesity, with obese women demonstrating an up to four-fold increased risk of disease [9, 10]. A positive association of endometrial cancer with T2D is consistently reported in several studies [11]. The role of obesity in the pathogenesis of endometrial cancer is complex [10]. The hyper-estrogenic state of obese women has long been known to contribute directly to endometrial proliferation [12],[13] and endometrial cancer risk. Studies in our laboratory and by others, have shown insulin and insulin-like growth factor (IGF) signaling are stimulated by estrogen in normal human endometrium, and these signaling pathways become dysregulated in the progression from normal endometrium to endometrial cancer [14]. In the context of obesity, insulin resistance and hyperinsulinemia are clearly intertwined with estrogen receptor signaling, and facilitate the progression of endometrial cancer. Taken together, the current data suggest that drugs that modulate circulating insulin levels may also attenuate estrogen-induced endometrial proliferation, and may represent useful chemopreventive agents.
To test this hypothesis and to further elucidate the effects of these drugs on estrogen-induced endometrial proliferation at the molecular level, we initially performed transcriptional profiling of endometrial tissue isolated from obese and lean rats treated with the insulin-sensitizing drug, rosiglitazone, a thiazolidinedione (TZD). Unfortunately, cardiotoxic effects of TZDs have recently been well described [15, 16] and have led to the withdrawal of rosiglitazone from use in Europe, and its restricted use in the U.S. We therefore continued our pre-clinical studies using metformin, a less-toxic insulin-sensitizing biguanide, whose anti-proliferative effects have been described in other tumor types.
Studies in our laboratory demonstrated that metformin attenuates the proliferative response of endometrial tissue to estrogen in an obese rat model [17]. Clinical studies are currently underway to test metformin as a chemopreventive agent for endometrial cancer in obese women, and as a therapeutic agent in combination with conventional therapeutic agents for the treatment of endometrial cancer. While circulating insulin levels reflect systemic responses to metformin, additional tissue-specific biomarkers of metformin are required that can be used to assess metformin response in the endometrium, specifically in small endometrial biopsies.
In this study, we characterize cell growth regulator with ring finger domain 1 (CGRRF1), as a potential tissue biomarker responsive to insulin-sensitizing drugs. The role of CGRRF1 in the endometrium has not been previously described, and its function is not well known. It is believed to suppress cellular proliferation, and may participate in protein ubiquitination. It has been shown to be activated by small molecule inhibitors of breast cancer stem cells [18] and is transcriptionally induced by the tumor suppressor genes, p53 [19] and RBL2/p130 [20]. In this study, we evaluated CGRRF1 expression in normal and hyperplastic human endometrium, as well as in endometrial tumor tissue, and discuss a potential role for CGRRF1 as a clinical biomarker which can be used to monitor endometrial sensitivity and response to metformin treatment.
Materials and Methods
Tissue Samples
Following IRB approval, frozen tissues from normal endometrium (n=81), hyperplasia (n=6) and 139 endometrial cancers [n= 20 Grade 1, 72 Grade 2, 31 Grade 3 endometrioid adenocarcinoma, 7 uterine papillary serous carcinomas (UPSC), and 9 malignant mixed mullerian tumors (MMMT)] were obtained at the time of hysterectomy. Diagnoses were confirmed following light microscopic examination of H&E-stained slides by a gynecologic pathologist.
Animals
Female Zucker fa/fa obese rats and their lean littermates (Harlan Laboratories, Indianapolis, IN) were maintained according to Institutional Animal Care and Use Committee guidelines. Obese Zucker rats are genetically predisposed to obesity and insulin resistance due to a mutation in the leptin receptor (fa/fa) [21, 22]. Rats were ovariectomized at 5 weeks of age and held for 5 days to clear endogenous ovarian hormones. Both lean and obese rats were randomized to 3 treatment groups (4-6 rats per group): vehicle (water), estradiol, or estradiol plus metformin (Sigma, St. Louis, MO). Metformin (in water, 300 mg/kg body weight/day) or vehicle (to the first two groups) was administrated by daily oral gavage for three weeks. Control and estradiol pellets (10ug/kg weight/day, over 2 weeks) were implanted in the last two weeks of metformin treatment. Animals were sacrificed at the end of the treatment period. The uterus was rapidly removed, endometrium scraped in Tri-reagent (Molecular Research Center, Cincinnati, OH), flash frozen in liquid nitrogen, and stored at -80°C.
Real-time quantitative reverse transcription-polymerase chain reaction (RT-qPCR)
Total RNA was extracted from frozen endometrial tissue and cultured endometrial cells using Tri-reagent, and treated with DNase I, as described previously [23]. RT-qPCR assay design and reaction conditions were the same for testing human CGRRF1 expression in both patient samples and part of the cultured human endometrial cells [17]. The assay was designed from Genbank sequence NM_006568: Forward primer, 873+AAAGTGAAGTTGAGCCATCGGG; Reverse primer, 958-GCATGGTAAGAGTACCCAGTTC; Probe, 931-CCCATTCTGGCAAACAACACAGTCC 5’ 6-FAM – 3’BHQ. Briefly, total RNA (100 ng) was reverse transcribed in quadruplicate (including one no reverse transcriptase control) using Superscript II reagents (Invitrogen, Carlsbad, CA, USA). Each PCR plate contained a 5-log standard curve using dilutions of assay-specific oligonucleotide spanning the entire PCR amplicon, and also contained 2 no-template controls. Assay was performed using the ABI Prism 7900 Sequence Detection System (Applied Biosystems, Foster City, CA, USA). Post-run data was analyzed using the Sequence Detection System software version 4 (Applied Biosystems) based on the standard curve. Sample values were corrected for RNA input by normalization to 18S ribosomal RNA (18S rRNA) and are expressed as the percent of 18S rRNA. Real-time RT-qPCR reactions were set up using liquid handling robotics in the Quantitative Genomics Core Laboratory at University of Texas Medical School at Houston.
For testing of CGRRF1 gene expression in rat endometrial tissue and some endometrial cancer cell lines, CGRRF1(Rn_00588090-m1, Hs00198091_m1), 18SrRNA (Hs99999901_s1) TaqMan® Gene Expression Assays (Applied Biosystems) and iScript™ one-step RT-PCR kit (BIO-RAD, Hercules, CA) were used, the assays were performed on BIO-RAD CFX96™ Real-Time system C1000™ Thermal cycler. CGRRF1 mRNA level was normalized by 18S rRNA level, and was expressed as fold change compared to control sample.
Cell Culture
Cancer cell lines ECC-1(American Type Culture Collection, Manassas, VA), Ishikawa (European Collection of Cell Culture), HCT116 p53-/- and p53+/+ (a gift from Dr. Bert Vogelstein, the Ludwig Center at Johns Hopkins), were maintained in RPMI with 10% fetal bovine serum. Metformin and vehicle (PBS), or Doxorubicin and control (water), were added to the cells, and incubated for 48 hours. For CGRRF1 siRNA and p53 siRNA treatment experiments, control siRNA, CGRRF1 siRNA, or p53 siRNA were delivered to ECC-1 cells with RNMAX (Invitrogen), and cells were incubated for 24 (for CGRRF1 siRNA) or 48 hours (for p53 siRNA). Transient overexpression of CGRRF1 was done by transfecting Ishikawa cells with pCMV6-Ac or pCMV6-Ac/CGRRF1 (OriGene Technologies, Rockville, MD) using Lipofectamine 2000 (Invitrogen) for 10 hours, and cells were collected for RNA extraction or protein lysate 48 hour after removing Lipofectamine 2000. Individual clones were selected in the presence of G418 to establish vector control or CGRRF1 overexpression stable cell lines.
MTT Assay
Cell proliferation/cytotoxicity was examined by MTT (3-(5-dimethylthiazol-2-yl)-2, 5-diphenyltetrazolium bromide) assay. Cells were plated in 96-well plates at 3000 cells/100μl/well, and grown for 24 hours, and then treated with metformin (5, 10, and 20mM) for 48 hours. MTT (5 mg/ml) was added at 20μl/well, and the plates were incubated for an additional 3.5 hours. The MTT reaction was terminated by replacing the culture medium with 150ul MTT solvent solution (4mM HCL, 0.1% NP40 in 2-propanol), results were read by measuring absorption at 590 nm.
Immunoblots
M-PER mammalian protein extraction reagent (Thermo Scientific, Rockford, IL) was used to extract protein from cells, followed by centrifugation at 14,000 × g at 4°C for 20 minutes. The supernatants were collected, and protein concentration was determined using BCA protein assay kit (Thermo Scientific). Equal amounts of protein were resolved by SDS–PAGE and transferred onto polyvinylidene difluoride membranes. After blocking with 5% nonfat milk, the membranes were probed with primary antibody against phospho-S6 ribosomal protein (Ser235/236), p53 (Santa Cruz Biotechnology, Santa Cruz, CA), CGRRF1 and β-actin (Sigma, St Louis, MO), followed by HRP-conjugated secondary antibody.
Flow cytometric analysis
Cells were seeded on 6-well plates for 24 hours, and then treated with metformin (10 mM) for 48 hours. Cells were trypsinized, washed with PBS, and fixed in 70% ethanol for 24 hours at 4°C. Propidium iodide staining was performed at room temperature for 30 minutes. Cell cycle analysis was performed using Flow Cytometer (Beckman Coulter, Indianapolis, IN).
Statistical Analysis
Statistical calculations were performed using SPSS 19.0 and SAS 9 software. Kruskal-Wallis test was used to examine the difference between groups for the patient endometrial tissue study. For other studies with multiple treatment groups, statistical significance between groups was evaluated using one-way ANOVA analysis of variance; differences between groups were determined by the Tukey test. Independent t-test was used to evaluate difference between groups for studies with two treatment groups. Results were presented as mean ± SD with p<0.05 considered to be statistically significant.
Results
CGRRF1 expression is modulated in vivo by insulin sensitizing drugs in obese rats
The effect of metformin on endometrial gene expression was evaluated in an obese rat model by RT-qPCR. Obese Zucker rats are genetically predisposed to obesity and insulin resistance due to a mutation in the leptin receptor (fa/fa) [21, 22]. Lean Zucker rats (fa/fa) serve as controls in these experiments, and demonstrate normal insulin sensitivity. Endogenous estrogen levels can vary in female mice, affecting endometrial gene expression. Animals were therefore oopherectomized to create a homogenous population of animals, in which we could regulate both the timing and dose of estrogen exposure. CGRRF1 expression is significantly decreased in estrogenized obese Zucker rat endometrium versus untreated (Figure 1A; 0.09 vs 0.79 p<0.05), however its expression is significantly re-induced in response treatment with metformin (0.09 vs 0.54; p<0.05). While estrogen treatment significantly inhibited CGRRF1 expression in insulin-sensitive lean animals as compared to untreated lean controls (0.39 vs. 1.2, p<0.05), metformin did not significantly alter CGRRF1 levels in these animals. These findings suggest that changes in CGRRF1 expression levels directly reflect the restoration of insulin sensitivity in tissues, and reduced circulating insulin levels resulting from metformin treatment.
Figure 1. Metformin induces CGRRF1 gene expression in vitro and in vivo.
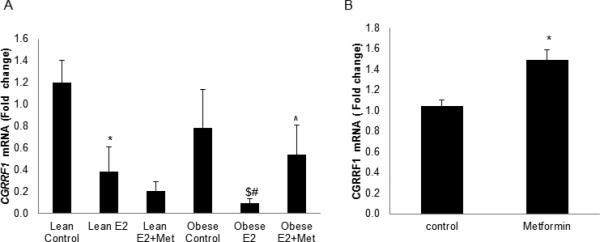
(A) CGRRF1 expression in Zucker rat (n=4-6) endometrium was evaluated by RT-PCR assay. * p<0.05 Lean E2 vs. Lean Control; # p<0.001 Obese E2 vs. Obese Control; $ p<0.05 Obese E2 vs. Lean E2; ^ p<0.05 Obese E2+Metformin vs. Obese E2. (B) Direct effects of metformin on CGRRF1 expression in ECC-1 cells were measured by RT-qPCR. * p<0.05 control vs. metformin.
Metformin directly induces CGRRF1 expression in vitro
To test for direct effects of metformin on CGRRF1 gene expression, ECC-1 endometrial cancer cells were treated with 10 mM metformin for 48 hours. CGRRF1 was significantly induced in metformin-treated cells (1.05±0.06 vs. 1.49±0.10, metformin vs. control, p=0.002) (Figure 1B), suggesting that metformin directly regulates CGRRF1 expression.
CGRRF1 inhibits cellular proliferation and increases metformin sensitivity in vitro
To evaluate the role of CGRRF1 on cellular proliferation in response to metformin, CGRRF1 expression was manipulated in Ishikawa cells, which express relatively low endogenous levels of CGRRF1, and in ECC-1 cells, which express high levels of CGRRF1.
Ishikawa cells were transfected with a CGRRF1 expression construct (pCMV6/CGRRF1) and the proliferative rate of these cells was compared to Ishikawa cells transfected with empty vector (pCMV6), both in the presence and absence of 10 mM metformin. Overexpression of CGRRF1 in Ishikawa cells produced an overall 14.5% decrease in proliferative rate, as compared to control transfected cells (p<0.001). Metformin decreased the proliferation of control-transfected cells by 33.9%. Interestingly, Ishikawa cells that overexpress CGRRF1 demonstrated an even higher sensitivity to metformin and proliferation decreased by 69.0% of that observed in untreated cells (p <0.001; Figure 2A). Conversely, when CGRRF1 expression was transiently silenced in ECC-1 cells following transfection with CGRRF1 siRNA, cellular proliferation was enhanced (Figure 2B) as determined by MTT.
Figure 2. CGRRF1 increases the sensitivity of Ishikawa cells to metformin therapy and modulated endometrial cell proliferation.
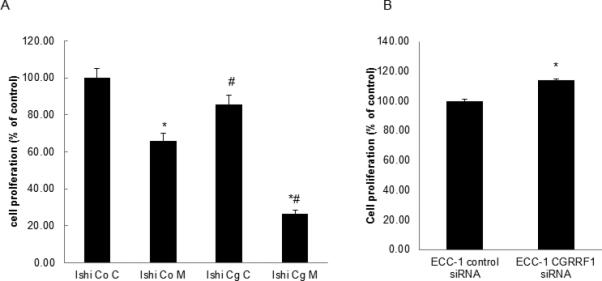
(A) Ishikawa cells were transfected with a pCMV6/CGRRF1 expression construct (Cg) or control vector (Co) and stable clones were isolated. Cells were then treated with 10 mM metformin for 48 hours, and cell proliferation evaluated by MTT. * p<0.001 control vs. metformin; # p<0.001, Ishikawa (Co) vs. Ishikawa (Cg). (B) ECC-1 cells were transiently transfected with either control or CGRRF1 siRNA. 24 hours following transfection, MTT assays were performed as a measure of cell proliferation. A reduction in CGRRF1 expression is associated with an increased proliferative rate. * p<0.05 control vs. CGRRF1 siRNA.
The observation that CGRRF1 is growth inhibitory, and augments the direct effects of metformin in vitro was confirmed by cell cycle analysis (Figure 3). Ishikawa cells treated with metformin (10mM) for 48 hours demonstrated a greater percentage of cells in G1 phase (48.19% vs. 60.063% , control vs. metformin treatment), while G1/G2M increased from 2.19± 0.13 to 5.65 ± 0.16 (p=0.00, control vs. metformin group), suggesting that metformin induces cell cycle arrest. Overexpression of CGRRF1 in Ishikawa cells further enhanced the G1 arrest effect of metformin, 52.69% vs. 72.09% (control vs. metformin treatment), while G1/G2M increased from 2.64 ± 0.27 to 6.20 ± 0.87 (p=0.003, control vs. metformin group) (Figure 3).
Figure 3. CGRRF1 prevents cell cycle progression.
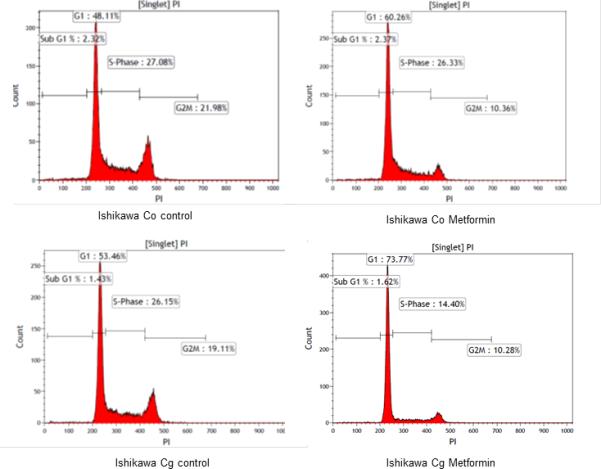
Stable clones isolated from Ishikawa cells transfected with a pCMV6/CGRRF1 expression construct (Cg) or control vector (Co) were treated with metformin (10mM) for 48 hours, and then processed for cell cycle analysis. Data shown is one representative experiment from three replicated experiments.
Taken together, these data suggest that while metformin and overexpression of CGRRF1 inhibit endometrial cancer growth in vitro, the effects of metformin are enhanced in the presence of CGRRF1. Loss of CGRRF1 is associated with increased cellular proliferation.
Downstream markers of CGRRF1 expression
The effects of CGRRF1 expression levels were evaluated using additional biomarkers of cellular proliferation by Western blot analysis with activation-specific antibodies. In Ishikawa cells overexpressing CGRRF1 (Figure 4A), a decrease in S6 ribosomal protein phosphorylation was observed when compared to Ishikawa cells stably transfected with control plasmid in support of a growth inhibitory role for CGRRF1 (Figure 4B).
Figure 4. Overexpressing CGRRF1 modulates endometrial cancer proliferation.
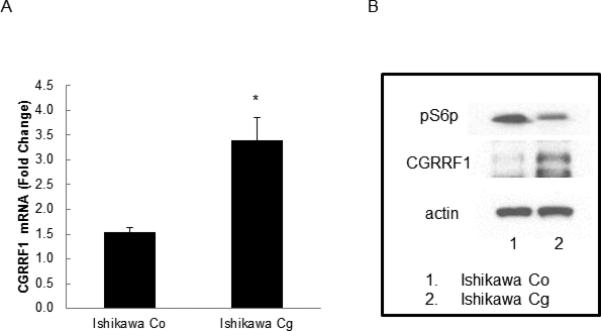
(A) Ishikawa cells were transfected with a pCMV6/CGRRF1 expression construct (Cg) or control vector (Co) and stable clones established. CGRRF1 mRNA level was evaluated by RT-qPCR. (B) Phosphorylation of ribosomal S6 protein (pS6p), a downstream marker of proliferation, was compared in Ishikawa cells transfected with pCMV6 or pCMV6-CGRRF1 by Western blot analysis. CGRRF1 expression inhibits phosphorylation of ribosomal S6 protein (indicating reduced proliferation).
CGRRF1 expression is regulated by p53
CGRRF1 was initially described as a p53 response gene in embryonic fibroblasts [19]. We confirm that that CGRRF1 expression mirrors that of p53 in the colon cancer cell lines HCT116 p53+/+ which express wild-type p53, and the p53-null counterpart, HCT116 p53-/-cell line (Figure 5A).
Figure 5. P53 induces CGRRF1 expression.
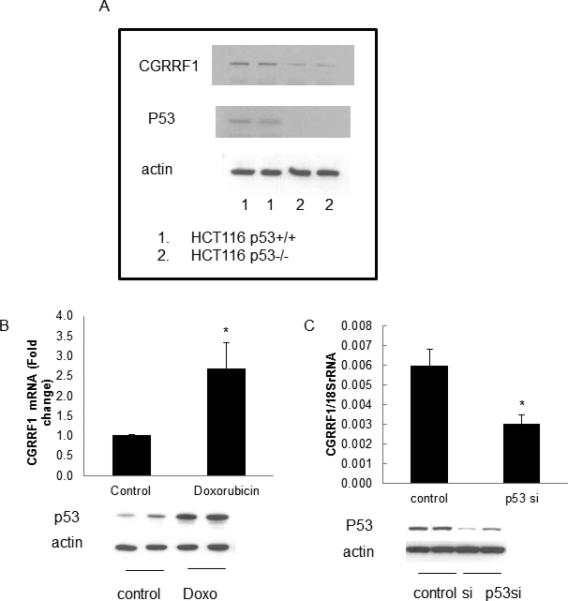
(A) CGRRF1 protein levels were evaluated in HCT116 p53+/+ cells and HCT116 p53-/- cells by Western blot analysis. (B, C) The effect of p53 on CGRRF1 expression was evaluated by RT-qPCR assay. Expression of p53 was evaluated in ECC-1 cells treated with doxorubin (to induce p53) (B) or ECC-1cells treated with p53 siRNA (to silence p53) (C). CGRRF1 expression is significantly induced in doxorubicin-treated ECC-1 cells, and inhibited in p53 siRNA treated cells.
To confirm this finding in endometrial cancer, ECC-1 cells were treated with doxorubicin, a drug known to induce p53 expression. The simultaneous increase of both p53 and CGRRF1 expression in doxorubicin treated cells was observed (1.0 vs. 2.7, control vs. doxorubicin, p=0.048) (Figure 5B). Conversely, when p53 expression was silenced in ECC-1 cells using a p53-specitic siRNA, CGRRF1 expression also decreased (0.006 vs. 0.003, control siRNA vs. p53 siRNA, p=0.034) (Figure 5C).
Expression of CGRRF1 in human endometrium and endometrial tumors
CGRRF1 gene expression was measured in tissue samples of normal endometrium, endometrial hyperplasia and endometrial tumor samples by RT-qPCR analysis. CGRRF1 expression was significantly lower in hyperplasia, Grade I, Grade II, Grade III, UPSC, and MMMT tumor tissues compared to that in normal endometrium (p<0.01) (Figure 6). These findings mirror our in vitro studies, which demonstrated that the decreased expression of CGRRF1 in endometrial cancer cell lines is associated with increased cellular proliferation.
Figure 6. CGRRF1 expression in normal endometrium, endometrial hyperplasia and endometrial tumors.
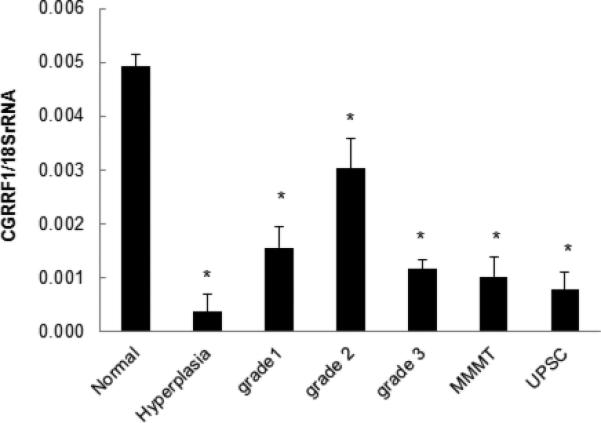
CGRRF1 expression in normal, hyperplasia human endometrium, or endometrial cancer tissue was evaluated by RT-qPCR assay. CGRRF1 was significantly decreased in all cases of early and late endometrial disease as compared with normal endometrium (* p<0.01).
Discussion
Recent findings by our laboratory and others, suggest that metformin may be a useful agent for the chemoprevention of endometrial cancer and the prevention of cancer recurrence, especially in the context of obesity. Metformin is thought to modulate endometrial proliferation by multiple mechanisms. Metformin increases insulin sensitivity, thereby reducing circulating levels of insulin and IGF1, both of which are associated with endometrial proliferation. Metformin has also been shown to directly inhibit cellular proliferation by modulating cellular metabolism. While circulating insulin levels reflect systemic responses to metformin, and are easily measured, additional tissue-specific biomarkers of metformin are necessary to assess metformin response in the endometrium. General markers of proliferation, such as Ki67 and PCNA, have some utility but may not be sufficiently sensitive to reflect tissue response to short-term metformin use [17]. Furthermore, endometrial biopsies contain limited amounts of tissue for comprehensive evaluation of biomarkers using immunohistochemistry.
We have identified the putative tumor suppressor gene, CGRRF1 as a potential biomarker of endometrial tissue response to metformin in the context of obesity. In our preclinical animal model, CGRRF1 expression is low in the endometrium of estrogenized obese, insulin-resistant, Zucker rats; however its expression is significantly induced in response to treatment with metformin. The re-induction of CGRRF1 in response to metformin is not seen in lean, estrogenized, insulin-sensitive controls, suggesting that changes in CGRRF1 expression levels directly reflect the restoration of insulin sensitivity in tissues, and/or reduced circulating insulin levels resulting from metformin treatment. These preclinical findings suggest that while CGRRF1 may possess some limitations as a tissue biomarker of metformin response in lean individuals, it should prove most useful in the population of women who are at highest risk for endometrial cancer. Furthermore, CGRRF1 levels can be measured by RT-qPCR, which requires only minute tissue samples for RNA isolation, such as those obtained in endometrial biopsies. A follow-up study, validating CGRRF1 as a biomarker in obese women undergoing chemopreventive treatment with metformin, is currently underway.
The role of CGRRF1 in the endometrium and in endometrial cancer has not previously been characterized. Our findings demonstrate that CGRRF1 is highly expressed in normal, post-menopausal endometrium, and its expression is significantly diminished in endometrial hyperplasia. Endometrial hyperplasia is most commonly diagnosed in obese women, with insulin resistance. Therefore, these findings reflect those seen in our obese, insulin-resistant animal model [17]. CGRRF1 levels are suppressed in endometrioid tumors of all grades, mixed mullerian tumors and in uterine papillary serous carcinomas, reflecting the proliferative state of these tumors as compared to normal, post-menopausal endometrium. Curiously, our data show a relative increase in CGRRF1 expression in Grade 2 as compared to hyperplasia or other endometrial tumor grades and types. Recent data published by The Cancer Genome Atlas Research Network suggest that endometrial carcinomas can be subdivided into at least four subgroups based on gene expression and mutational status. Three of the four subsets consist almost entirely of endometriod tumors without differences in tumor grade, while UPSC, mixed adenocarcinomas and some Grade 3 endometrioid tumors fall into a fourth category which more closely resemble serous ovarian cancer. It is further possible that the stromal component of each tumor grade can influence CGRRF1 expression. We plan to investigate whether those endometrioid tumors, which express higher levels of CGRRF1 fall specifically into any of the three subcategories, and will also examine if the expression of CGRRF1 is associated with outcome. Given that the physiologic role of CGRRF1 has not yet been clearly identified, we will further establish whether CGRRF1 expression levels may represent a novel marker of tumor grade or subtype.
As originally described in embryonic fibroblasts [19] , CGRRF1 expression can be modulated in endometrial tumor cells by p53. Endometrial cancer cells, which typically express low levels of CGRRF1, express elevated levels of CGRRF1 following p53 activation by doxorubicin. As indicated by the degree of response, it is unlikely that P53 is the lone regulator of CGRRF1 expression in endometrial cancer. Indeed, CGRRF1-levels are modulated by the RB2/p130 tumor suppressor gene in Burkitt lymphoma [20] , while CGRRF1 levels have been shown to be epigenetically regulated in testicular cancer [24] . The modulation of CGRRF1 expression in endometrial cancer cells will require further characterization, as it may represent a useful tissue-specific marker of drug response.
Previous studies suggest a tumor suppressor function for CGRRF1 itself. The restoration of CGRRF1 expression in endometrial cancer cells in vitro not only retards cellular proliferation, but also increases tumor cell sensitivity to metformin, and promotes cell cycle arrest in metformin-treated cells. While no clearly defined, tumor-suppressive role has been described in the literature, our data suggest that CGRRF1 may be a component of one of the growth-inhibitory pathways activated by metformin that further modulates metformin responsiveness in cells. This is further reflected at the molecular level by a decrease in phosphorylation of ribosomal S6 protein, a marker of cellular proliferation. Taken together, these in vitro studies suggest that combining metformin with drugs that further increase CGRRF1 may prove more effective in the treatment of endometrial cancer than metformin alone.
Supplementary Material
Acknowledgments
This project was supported in part by Grant Number P50CA098258 from the National Cancer Institute, and also in part by the National Institutes of Health through MD Anderson's Cancer Center Support Grant CA016672.
Footnotes
Conflict of interest statement
The authors report no conflict of interest.
Supplemental data
The effect of p53 on CGRRF1 expression was evaluated by Western blot analysis in ECC-1 cells. Expression of p53 was silenced using p53 si RNA.
References
- 1.Flegal KM, Carroll MD, Kit BK, Ogden CL. Prevalence of obesity and trends in the distribution of body mass index among US adults, 1999-2010. JAMA : the journal of the American Medical Association. 2012;307:491–7. doi: 10.1001/jama.2012.39. [DOI] [PubMed] [Google Scholar]
- 2.Flegal KM, Carroll MD, Ogden CL, Curtin LR. Prevalence and trends in obesity among US adults, 1999-2008. JAMA : the journal of the American Medical Association. 303:235–41. doi: 10.1001/jama.2009.2014. [DOI] [PubMed] [Google Scholar]
- 3.Gilbert CA, Slingerland JM. Cytokines, obesity, and cancer: new insights on mechanisms linking obesity to cancer risk and progression. Annual review of medicine. 2013;64:45–57. doi: 10.1146/annurev-med-121211-091527. [DOI] [PubMed] [Google Scholar]
- 4.Hursting SD, Digiovanni J, Dannenberg AJ, Azrad M, Leroith D, Demark-Wahnefried W, et al. Obesity, energy balance, and cancer: new opportunities for prevention. Cancer Prev Res (Phila) 2012;5:1260–72. doi: 10.1158/1940-6207.CAPR-12-0140. [DOI] [PMC free article] [PubMed] [Google Scholar]
- 5.Franciosi M, Lucisano G, Lapice E, Strippoli GF, Pellegrini F, Nicolucci A. Metformin therapy and risk of cancer in patients with type 2 diabetes: systematic review. PloS one. 2013;8:e71583. doi: 10.1371/journal.pone.0071583. [DOI] [PMC free article] [PubMed] [Google Scholar]
- 6.Mahmood K, Naeem M, Rahimnajjad NA. Metformin: the hidden chronicles of a magic drug. European journal of internal medicine. 2013;24:20–6. doi: 10.1016/j.ejim.2012.10.011. [DOI] [PubMed] [Google Scholar]
- 7.Pollak MN. Investigating metformin for cancer prevention and treatment: the end of the beginning. Cancer discovery. 2012;2:778–90. doi: 10.1158/2159-8290.CD-12-0263. [DOI] [PubMed] [Google Scholar]
- 8.Quinn BJ, Kitagawa H, Memmott RM, Gills JJ, Dennis PA. Repositioning metformin for cancer prevention and treatment. Trends in endocrinology and metabolism: TEM. 2013 doi: 10.1016/j.tem.2013.05.004. [DOI] [PubMed] [Google Scholar]
- 9.Calle EE, Kaaks R. Overweight, obesity and cancer: epidemiological evidence and proposed mechanisms. Nature reviews Cancer. 2004;4:579–91. doi: 10.1038/nrc1408. [DOI] [PubMed] [Google Scholar]
- 10.Schmandt RE, Iglesias DA, Co NN, Lu KH. Understanding obesity and endometrial cancer risk: opportunities for prevention. American journal of obstetrics and gynecology. 2011;205:518–25. doi: 10.1016/j.ajog.2011.05.042. [DOI] [PMC free article] [PubMed] [Google Scholar]
- 11.Zhang ZH, Su PY, Hao JH, Sun YH. The role of preexisting diabetes mellitus on incidence and mortality of endometrial cancer: a meta-analysis of prospective cohort studies. International journal of gynecological cancer : official journal of the International Gynecological Cancer Society. 2013;23:294–303. doi: 10.1097/IGC.0b013e31827b8430. [DOI] [PubMed] [Google Scholar]
- 12.Shang Y. Molecular mechanisms of oestrogen and SERMs in endometrial carcinogenesis. Nature reviews Cancer. 2006;6:360–8. doi: 10.1038/nrc1879. [DOI] [PubMed] [Google Scholar]
- 13.Zhang Q, Shen Q, Celestino J, Milam MR, Westin SN, Lacour RA, et al. Enhanced estrogen-induced proliferation in obese rat endometrium. American journal of obstetrics and gynecology. 2009;200:186, e1–8. doi: 10.1016/j.ajog.2008.08.064. [DOI] [PMC free article] [PubMed] [Google Scholar]
- 14.Westin SN, Broaddus RR, Deng L, McCampbell A, Lu KH, Lacour RA, et al. Molecular clustering of endometrial carcinoma based on estrogen-induced gene expression. Cancer Biol Ther. 2009:8. doi: 10.4161/cbt.8.22.9740. [DOI] [PMC free article] [PubMed] [Google Scholar]
- 15.Nissen SE, Wolski K. Effect of rosiglitazone on the risk of myocardial infarction and death from cardiovascular causes. The New England journal of medicine. 2007;356:2457–71. doi: 10.1056/NEJMoa072761. [DOI] [PubMed] [Google Scholar]
- 16.Woodcock J, Sharfstein JM, Hamburg M. Regulatory action on rosiglitazone by the U.S. Food and Drug Administration. The New England journal of medicine. 2010;363:1489–91. doi: 10.1056/NEJMp1010788. [DOI] [PubMed] [Google Scholar]
- 17.Zhang Q, Celestino J, Schmandt R, McCampbell AS, Urbauer DL, Meyer LA, et al. Chemopreventive effects of metformin on obesity-associated endometrial proliferation. American journal of obstetrics and gynecology. 2013 doi: 10.1016/j.ajog.2013.03.008. [DOI] [PMC free article] [PubMed] [Google Scholar]
- 18.Carmody LC, Germain A, Morgan B, VerPlank L, Fernandez C, Feng Y, et al. Identification of a Selective Small-Molecule Inhibitor of Breast Cancer Stem Cells - Probe 2. Probe Reports from the NIH Molecular Libraries Program. Bethesda (MD) 2010 [Google Scholar]
- 19.Madden SL, Galella EA, Riley D, Bertelsen AH, Beaudry GA. Induction of cell growth regulatory genes by p53. Cancer research. 1996;56:5384–90. [PubMed] [Google Scholar]
- 20.De Falco G, Leucci E, Lenze D, Piccaluga PP, Claudio PP, Onnis A, et al. Gene-expression analysis identifies novel RBL2/p130 target genes in endemic Burkitt lymphoma cell lines and primary tumors. Blood. 2007;110:1301–7. doi: 10.1182/blood-2006-12-064865. [DOI] [PubMed] [Google Scholar]
- 21.Aleixandre de Artinano A, Miguel Castro M. Experimental rat models to study the metabolic syndrome. The British journal of nutrition. 2009;102:1246–53. doi: 10.1017/S0007114509990729. [DOI] [PubMed] [Google Scholar]
- 22.Fellmann L, Nascimento AR, Tibirica E, Bousquet P. Murine models for pharmacological studies of the metabolic syndrome. Pharmacology & therapeutics. 2013;137:331–40. doi: 10.1016/j.pharmthera.2012.11.004. [DOI] [PubMed] [Google Scholar]
- 23.Shen Q, Cline GW, Shulman GI, Leibowitz MD, Davies PJ. Effects of rexinoids on glucose transport and insulin-mediated signaling in skeletal muscles of diabetic (db/db) mice. J Biol Chem. 2004;279:19721–31. doi: 10.1074/jbc.M311729200. [DOI] [PubMed] [Google Scholar]
- 24.Lind GE, Skotheim RI, Fraga MF, Abeler VM, Esteller M, Lothe RA. Novel epigenetically deregulated genes in testicular cancer include homeobox genes and SCGB3A1 (HIN-1). J Pathol. 2006;210:441–9. doi: 10.1002/path.2064. [DOI] [PubMed] [Google Scholar]
Associated Data
This section collects any data citations, data availability statements, or supplementary materials included in this article.


