

Abstract
Bacteria, which are often considered as avid reproductive organisms under constant selective pressure to utilize available nutrients to proliferate, might seem an inappropriate model to study aging. However, environmental conditions are rarely supporting the exponential growth that is most often studied in laboratories. In the wild, Escherichia coli inhabits environments of relative nutritional paucity. Not surprisingly, under such circumstances, members of an E. coli population age and progressively lose the ability to reproduce, even when environmental conditions provide such an opportunity. Here, we review the methods to study chronological aging in bacteria and some of the mechanisms that may contribute to their age-dependent loss of viability.
Keywords: Aging, Escherichia coli, Oxidative DNA damage, Protein carbonylation, Rifampicin, Stress resistance, Time-lapse microscopy
1. Introduction
Inoculation and maintenance of a bacterial population in the same environment without the addition or removal of cells or nutrients is termed batch culture. It differs from continuous culture systems whereby either a fraction of cells is serially transferred to fresh medium at a certain point before stationary phase (serial passage) or cells are constantly removed and fresh nutrients added to the same incubation vessel (chemostat) (1). When inoculated into fresh LB (see “Subheading 1” below for details) and maintained at 37°C in batch culture, an Escherichia coli population goes through five distinct phases that can be described in terms of changes in the number of cells over time and are shown in Fig. 1 (1). The exact timing of those phases is dependent on both the strain and the technique used during the experiment. The time periods that will be herein mentioned are based on experiments with strain BW25113 (2).
Fig. 1.
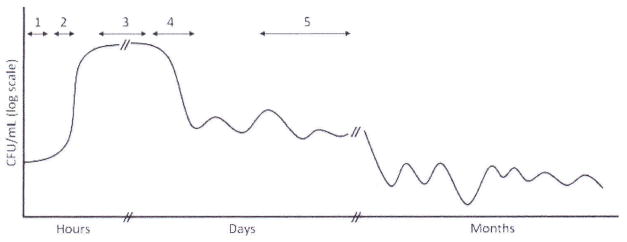
A schematic of Escherichia coli life cycle in LB batch culture; adapted from ref. 1.
The period when no increase in biomass using optical density measurements can be detected is called lag phase (phase 1 in Fig. 1). It is worth noting that cells removed from cultures that have spent more time in stationary phase (see below) display longer lag phases compared to cells removed from “younger” cultures (3). Following lag phase, the culture exhibits an exponential increase in the number of cells, during the so-called log phase (phase 2 in Fig. 1), which is arguably the most intensively studied physiological state. As time progresses during log phase, the following four changes occur, among others: excreted metabolic by-products accumulate in the medium, pH increases from 7.5 to approximately 8.5, cell density also increases and growth rate declines, marking the onset of stationary phase (phase 3 in Fig. 1). Inoculation of E. coli cells into conditioned medium obtained from early stationary phase cultures (after 12 h of incubation) results in cell proliferation detected as an increase in optical density at 600 nm (OD600, our unpublished observation). This observation rules out the possibility that cessation of proliferation is the result of nutrient exhaustion, increase in pH or the accumulation of growth-inhibiting metabolic by-products in the medium and points to cell density increase as the most important physiological trigger for stationary phase entry.
The maximum cell density reached is approximately 2×10⁹ cells/mL. After approximately 18 h in stationary phase, during which no change in the number of cells is observed, the population exhibits a marked decline in the number of living organisms, referred to as the death phase of the E. coli life cycle in LB (phase 4 in Fig. 1). By the end of the death phase, 90–99% of the original population loses the ability to form colonies when plated on nutrient agar medium. The progressive loss of viability during the death phase of the E. coli life cycle, reminiscent of the age-dependent loss of function and increase in death rate that is defined as aging in higher organisms, makes E. coli an important model organism to understand aging in prokaryotes but also a system to identify and understand the fundamental factors that modulate aging in all organisms.
During phase 5 (Fig. 1), the number of cells per milliliter remains relatively constant for periods of up to 5 years without the addition of nutrients (1). Despite this stability at the macroscopic level, the surviving population undergoes many cycles of death and proliferation of mutants adapted to the changing conditions created during the experiment. This phenomenon has been termed GASPing, which stands for growth advantage in stationary phase (4). Although quite interesting in terms of mechanisms of evolutionary adaptation, it is outside the scope of an investigation into the mechanisms of senescence. It is therefore apparent that continuous culture systems are unsuitable for the study of chronological aging in bacteria, since the culture is maintained in a proliferating state throughout the duration of these experiments.
1.1. Studying Stationary Phase Survival in E. coli
Two different types of nutrient media can be used to study stationary phase survival in E. coli, namely complex media and defined-minimal media. The former contain a mixture of amino acids, peptides and carbohydrates (see Notes 1 and 2), while the latter contain specific inorganic compounds that provide the bacteria with all the elements they require, as well as a defined carbon and energy source (usually glucose). The most commonly used complex and defined media are LB and M9 minimal medium, respectively.
The nutrients available in unbuffered LB versus minimal media and the pH eventually reached are quite different (also depending on the carbon source used in minimal media) and, as a result, physiological changes and other phenomena observed during the stationary phase of the bacterial life cycle will not always coincide among different media (Fig. 2). Perhaps the most important functional distinction between stationary phase in LB compared to stationary phase in minimal medium is that in the latter, stationary phase is reached due to the exhaustion of a specific nutrient required for the production of biomass. The limiting nutrient is chosen by the investigator and is commonly the phosphate, nitrogen or carbon source. Under such conditions, the survival and underlying physiology of E. coli cells starved for a specific nutrient is examined. By contrast, cessation of proliferation of a population maintained in LB is not triggered by nutrient exhaustion (see above). A lot of work has been done on the stationary phase physiology of E. coli under conditions of starvation for a specific nutrient; the information extracted from these studies should not be extrapolated to stationary phase in LB without sufficient experimental verification.
Fig. 2.
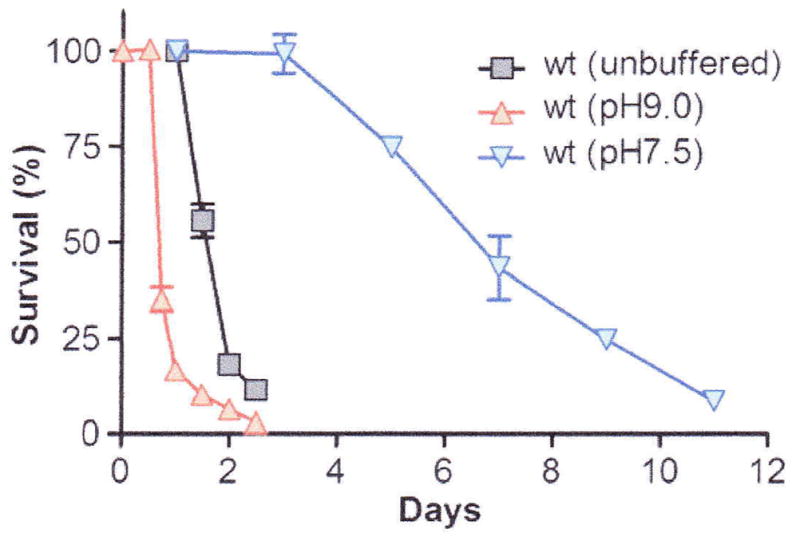
Chronological aging of bacteria in unbuffered, alkaline, or neutral pH LB medium; redrawn based on data published in ref. 16.
Despite the differences in the proximal causes of stationary phase entry, the life cycle of stationary phase E. coli in different fresh media is quite similar, characterized by a log phase followed by death (5) and the expression of the GASP (6). The physiological differences between cells proliferating in LB and M9 minimal medium containing 0.4% glucose as the carbon source have been described using a microarray analysis of gene expression. Higher expression of amino acid and pyrimidine biosynthetic genes, as well as glucose metabolism genes was observed in minimal medium compared to LB (7). On the other hand, LB-grown cultures had increased expression compared to minimal medium of gluconeogenic genes and genes that mediate the breakdown of small molecules.
Reports of the abundance of E. coli in its aquatic habitats vary from 0.01 to 10/mL in pristine well water and mountain streams (8) to 100–1,000/mL in the watersheds of grazed pastures (9). These studies used the colony-forming ability as a measure of the abundance of bacteria. However, a considerable proportion of bacteria in aquatic environments is metabolically active as judged, for example, by electron transfer activity, but cannot form colonies when transferred on rich nutrient medium (10). This physiological state has been termed viable, but not culturable (VBNC) and its contribution to the ecology of enteric bacteria has been intensively studied. The last cited reference enumerates as many as 47 different techniques that have been used to accurately assign bacteria to the correct place of the physiological spectrum that ranges from active proliferation to death. It therefore becomes apparent that any account of the viability of E. coli in its secondary environment is heavily dependent on the methodology used to quantify viability. Detailed examination of the relative merits of these techniques is outside the scope of this text.
Some studies report that, in river water, the loss of culturability is paralleled by a decrease in direct counts (number of cells visible under the microscope) obtained by acridine orange and viable counts estimated using yeast extract and nalidixic acid and therefore conclude that E. coli should not enter the VBNC state in such a habitat (11). Others report a progressive loss of colony-forming units (CFU’s) in seawater, while metabolic activity assayed by the ability of a functioning electron transport chain to reduce 2-(p-iodophenyl)-3-p-nitrophenyl-5-phenyltetrazolium chloride remains constant, thus suggesting that the VBNC state is indeed a part of the physiology of E. coli in aquatic environments (12). Total cell counts obtained by microscopy appear to remain constant even after extended incubation (56 days in ref. 11) reflecting a preservation of the integrity of the membrane of otherwise dead bacteria. It is worth mentioning that the seemingly straightforward observation of colonies after incubation on solid nutrient media used to measure colony-forming ability is complicated by the fact that E. coli loses the ability to form colonies on Endo agar, a medium commonly used to detect enteric microorganisms, while retaining the ability to form colonies on trypticase soy agar (13). Attempting a generalization based on several published studies, Rozen and Belkin suggest that the ability to form colonies on nutrient plates is the first loss of E. coli when faced with conditions approximating seawater in vitro, while other metabolic capabilities are either retained or lost at differing rates (14). Thus, a significant part of the life of E. coli in soil and aquatic habitats may be spent in the VBNC state.
On the other hand, during stationary phase incubation in LB, colony-forming ability and viability do seem to coincide, according to the study of Ericsson et al. (15). In this study, stationary phase E. coli maintained in nutrient broth were trapped, stained with the fluorescent dyes SYTO 9 and propidium iodide, and observed using fluorescence microscopy after the addition of fresh nutrient medium (15). Bacteria fluorescing green (SYTO 9) have intact membranes, whereas red bacteria have damaged membranes that allow propidium iodide to enter. Upon fresh nutrient addition, none of the cells stained red divided and 93.3% of cells stained green did. These results argue against the existence of viable but not culturable cells during stationary phase in complex medium, such that viability, survival and culturability can be considered generally equivalent under the experimental conditions described above. Therefore, according to the life cycle (Fig. 1), a long-lived E. coli population is one that survives longer in stationary phase (phase 3 in Fig. 1) compared to the control population.
Based on this technique, a genome-wide screen for long-lived single-gene knock-out mutants in E. coli was performed and several strains that exhibit extended stationary phase survival compared to wt, independently if the cultures’ pH (Fig. 2) were found. The extended survival of these mutants was dependent on the hypoxia-inducible transcription factor ArcA and on the production of acetate, one of the metabolic by-products of fermentation (16). The metabolic switch from TCA cycle/respiration to glycolysis and glycerol production was recently reported as a central component of the lifespan extension observed in the Saccharomyces cerevisiae tor1Δ and sch9Δ mutants (17). Such mechanisms of lifespan extension are expected to be dependent on a broad metabolic repertoire that confers the ability to grow and survive both in the presence and absence of oxygen. A metabolic model for lifespan extension in the nematode worm Caenorhabditis elegans, which cannot survive in the absence of oxygen, also invoked the reduced use of aerobic respiration in favor of fermentative malate dismutation, producing acetate and succinate, as a common metabolic adaptation of most long-lived mutants described for this species (18). Recently, several studies implicated HIF-1, a functional homolog of ArcA found in metazoans, in lifespan regulation in C. elegans (19–21). Thus, the metabolic alterations leading to extended stationary phase survival in the bacterium E. coli might reveal the conservation of fundamental lifespan-regulating mechanisms.
1.2. Protein Carbonylation
Protein carbonyls are carbon–oxygen double bonds formed at the side chains of the amino acids argininc, lysine, proline, and threonine (22). Unlike other oxidative modifications like disulfide bond formation, these modifications are irreversible, rendering the degradation of the affected proteins the only means of limiting the dysfunction caused by their presence. A time-dependent accumulation of protein carbonyls is observed during stationary phase in E. coli (24), with some proteins showing increased susceptibility (TCA cycle enzymes, among others) (23). Populations lacking both cytosolic superoxide dismutases display a higher amount of protein carbonylation and also a more rapid loss of viability during stationary phase. On the other hand, incubation of a stationary phase population in the absence of oxygen causes a significant lifespan extension (24). The use of radioselectan equilibrium density-gradient centrifugation allows the separation of a stationary phase population of E. coli to a high-density and a low-density fraction. Desnues et al. showed that die high density fraction displays increased expression of catalase, enhanced protein carbonylation and preferential loss of viability compared to the low-density fraction (25). These observations provided credence to the notion that oxidative deterioration of proteins is causally linked to stationary phase death in E. coli.
In another study, an age-dependent accumulation of protein carbonyls was observed in the wild type (wt) strain incubated in LB buffered at pH 7.5, but protein carbonyls were reduced in the long-lived lipA strain (26), consistent with the hypothesis that age-dependent death in E. coli is associated with the accumulation of protein carbonyls. However, the lipA acs mutant survived longer than the wt strain, despite having a similar protein carbonylation load to wt. It is possible that a compensatory, longevity-assuring mechanism is activated in the lipA strain to counteract the increased protein carbonylation caused by the lack of Acs. However, the most parsimonious interpretation for these data is the lack of a causal association between stationary phase survival and protein carbonylation in E. coli.
In an early attempt to tackle the mechanistic basis of aging, Harman proposed in 1956 that free radicals (such as the ones that give rise to protein carbonylation) generated as a consequence of oxidative metabolism cause aging (27). Studies providing evidence for this theory in many different model systems have been performed since it was first put forward. An account of this vast volume of work is outside the scope of this text; the interested reader is directed to a recent review (28). However, more recently a number of studies have challenged the generality of the free radical theory of aging. The nematode worm C. elegans has five sod genes. A recent report found that lack of any one of those genes, as well as combined deficiency of two to three genes has no effect on the organism’s lifespan (29). Instead, lack of the mitochondrial SOD further extends the lifespan of the long-lived clk-1 mutant. Overexpression of the mitochondrial SOD in mice does not protect against age-related neurological defects and produces a 4.3% mean lifespan extension (30), which is much smaller in magnitude compared to the effects observed with mice deficient in the growth hormone axis (31).
Using an evolutionary biology approach, Jobson et al. compared the nonsynonymous and synonymous evolution of approximately 5.7 million sites in 25 species and correlated these changes to the species’ lifespan. Despite the limited capacity of such an associational approach to reach valid conclusions about a phenotype as complex as aging, the authors found that genes involved in oxidative stress defense, including the superoxide dismutases, have not been involved in the selection process that led to increased lifespans in mammals (32). The authors found such evidence for genes involved in lipid composition. However, it is likely that: (a) even though free radicals may be one of the major mediators of age-dependent cellular damage the overexpression of specific antioxidant enzymes is not a sufficiently sophisticated intervention to insure that toxic levels of free radicals are reduced while the normal levels of free radicals, which participate in cellular function, are not affected, (b) Similarly, genes involved in oxidative damage may not have been involved in the selection process leading to lifespan extension because altered function of each gene alone would be expected to have both beneficial and detrimental effects.
Thus, although there is strong evidence for the involvement of superoxide in certain diseases, such as amyotrophic lateral sclerosis, its role in lifespan regulation is mixed across different model systems and experimental circumstances. As mentioned above, there is also mixed evidence about the involvement of oxidative damage in bacterial senescence. The available data suggests that although protection against oxidative stress may lead to a modest lifespan extension, it may be only a small part of the longevity promotion effect induced by interfering with the central regulators of aging, such as the evolutionarily conserved, nutrient-responsive growth hormone/insulin growth factor I signaling pathway (31).
1.3. Oxidative DNA Damage
Rifampicin is a broad-spectrum bacteriostatic drug that acts by inhibiting subunit β of the RNA polymerase, encoded by rpoB in E. coli (33). Point mutations in this gene prevent binding of the drug to its target, allowing growth of the mutant strain in the presence of the antibiotic. The occurrence of rifampicin-resistant mutants (which represent mostly base substitutions) has therefore been used as an indirect measure of DNA damage in E. coli (34). To our knowledge, the role of DNA damage in the stationary phase survival/aging of E. coli has not been studied. Although the extended lifespan phenotype we unveiled (16) could provide fertile ground for the exploration of this subject, no time-dependent increase in DNA damage was observed by enumeration of rifampicin-resistant mutants in the wt strain (2). The reason for this could either be technical or biological. On the technical side, the assay used might not be sensitive enough to detect age-dependent DNA damage occurring during a survival experiment, since the rpoB locus might not be a representative target of the genome-wide DNA damage occurring under these conditions. The biological explanation is that stationary phase death in E. coli happens independently of damage to DNA; a technique that measures DNA damage across larger regions of the genome should be used to further explore this issue. It is worth noting however, that we observed a time-dependent increase in oxidative DNA damage in the mutant lacking both cytosolic superoxide dismutases (sodA sodB) (2), consistent with previous reports about both static (35) and proliferating (36) populations of this mutant.
1.4. Stress Resistance
One of the hallmarks of stationary phase in E. coli is the development of resistance to heat and oxidative stress. Cells starved for carbon or nitrogen were markedly more resistant than proliferating cells to incubation at 57°C or exposure to 15 mM hydrogen peroxide (37). Furthermore, starved cultures exhibited greater resistance than growing cultures preadapted to heat or hydrogen peroxide before treatment with the respective stressors. The RNA polymerase of E. coli is made up of a core component and one of several sigma subunits; the identity of the sigma subunit is modulated by environmental conditions and confers sequence selectivity to the polymerase. In broad terms, the sigma 70 subunit (encoded by rpoD) is used predominantly during log phase and the sigma S subunit (encoded by rpoS) during stationary phase (38). The latter protein mediates stationary phase resistance to heat (39) and oxidative stress (40), and also contributes to glycogen synthesis (41). E. coli strains with extended stationary phase survival also exhibit enhanced resistance to heat stress and to paraquat treatment (16). Paraquat is a herbicide that catalyzes the formation of intracellular superoxide, by successive rounds of reduction by intracellular reducing agents and oxidation by oxygen to form superoxide (42). Stress resistance is coupled to longevity in several model organisms (43), perhaps reflecting an evolutionarily conserved physiological state that channels resources away from reproduction and towards maintenance and protection functions (44).
1.5. Chronological Versus Replicative Aging
The study of stationary phase E. coli populations as a model system for aging should be contrasted with another observation about the organism’s physiology that has recently been associated with aging. This observation is that cell division in E. coli, although morphologically symmetrical, produces two functionally different progeny. Daughter cells that inherit one of die two poles of the mother cell (“old pole”) show progressively slower growth rates compared to daughter cells inheriting the “new pole” (45). The mechanistic basis for aging in this organism is thought to be the asymmetrical segregation of some aging-inducing factor in cells inheriting the old pole following binary fission. Therefore, some sort of time-dependent functional asymmetry between “parent” and “offspring” is tightly linked to the aging process even in organisms without a clear germline/soma separation. This finding has implications on the evolutionary biology of aging, since it is inconsistent with the disposable soma theory of aging, which states that organisms age because of limited resources allocated to the maintenance of somatic cells due to the need to maintain the germ cells that are responsible for the propagation of the species. Hence, the E. coli findings obtained using time-lapse microscopy raise the possibility that aging can occur in an organism without a clear germline/soma separation.
In a different study, cells receiving the old pole were shown to preferentially accumulate protein aggregates (46), providing a possible mechanistic link to the aging-inducing factor accumulating in old pole cells mentioned above. These observations are reminiscent of the replicative lifespan of S. cerevisiae that has been extensively used to model the aging process of mitotic tissues in higher organisms (47), whereas the chronological lifespan of yeast is regarded as a more suitable model for the aging of post-mitotic tissues and organisms (48). It would be of interest to test the correlation between inheritance of old poles and stationary phase survival; such an experiment would be quite demanding technically though, as the observation of functionally asymmetrical division was performed using time-lapse microscopy (45) and the establishment of a stationary phase population under such conditions is not straightforward. Conversely, it would also be interesting to identify any effects of mutations affecting stationary phase survival on the replicative aging of E. coli.
1.6. Conclusion
In summary, as for eukaryotes, E. coli age chronologically and this process can be postponed by dietary restriction or by mutations in a number of genes involved in metabolism. Although both DNA and protein damage can accumulate during aging in E. coli, it is not known whether this damage is a cause or consequence of aging and viability loss. The conservation of key age-dependent macromolecular damage phenotypes together with the role of genes that control the hypoxia response in regulating lifespan in both bacteria and higher eukaryotes, indicate that some of the most fundamental mechanisms of aging are conserved from bacteria to mammals. The simplicity of E. coli makes it a valuable model to test the evolutionary theories of aging.
2. Materials
2.1. Common Materials
2.1.1. Consumables
pH test strips.
125-mm Petri dishes.
16-mm glass test tubes.
125-mL Erlenmeyer flasks.
2.1.2. Equipment
Incubator with controlled humidity.
Orbitally rotating platform.
pH meter.
2.1.3. Reagents
LB medium: 1% bacto tryptone (see Note 1), 0.5% yeast extract (see Note 2), 0.5% (w/v) NaCl. For solid medium, add 1.5% agar. Sterilized by autoclaving.
HEPES (N-(2-hydroxyethyl)-piperazine-N′-ethanesulfonic acid) buffer: 1 M stock, sterilized by autoclaving and kept at room temperature.
AMPSO (N-(1,1-dimethyl-2-hydroxyethyl)-3-amino-2-hydroxypropanesulfonic acid) buffer: 1 M stock, sterilized by autoclaving and kept at room temperature.
NaCl, 0.5% (w/v), sterilized by autoclaving.
2.2. Quantification of Protein Carbonyls
Y-PER protein extraction reagent (Thermo Fisher Scientific Inc—Pierce, Rockford, EL USA).
BCA protein assay kit (Thermo Fisher Scientific Inc—Pierce).
Oxyblot protein oxidation detection kit (Millipore—Chemicon, Billerica, MA, USA).
Slot blot apparatus.
PVDF membrane.
Blocking buffer: PBS (pH 7.4), 0.05% (v/v) Tween-20, 1% (w/v) BSA.
Washing buffer: PBS (pH 7.4), 0.05% (v/v) Tween-20.
Chemiluminescent horseradish peroxidase (HRP) detection reagent.
2.3. Quantification of Oxidative DNA Damage
Rifampicin, stock solution of 120 mg/mL in ethanol, stored at −20°C.
2.4. Assaying Stress Resistance
Methyl viologen dichloride hydrate (see Note 3).
2.5. Time-Lapse Microscopy
Temperature-controlled (Cube and Box incubation system, Life Imaging Services, Reinach, Switzerland) automated microscope (Zeiss 200 M; Zeiss, Jena, Germany), along with filters from Chroma, Rockingham, Vermont, USA.
MetaMorph microscope control software (Universal Imaging, Downingtown, PA, USA).
CoolSNAP HQ CCD camera (Princeton Instruments, Trenton, NJ, USA).
3. Methods
3.1. Enumeration of Colony-Forming Units
A small (approximately 50 μL) sample is collected from the frozen stock (maintained at −70°C) and streaked onto a fresh LB agar plate.
After incubating the plate overnight at 37°C, inoculate 2–3 colonies into 1 mL of LB (see Note 4).
Overnight culture is inoculated (1:1,000) into fresh medium. Cultures are incubated in 3 mL of LB in 16-mm diameter test tubes rotating orbitally at 220 rpm for 12 h; stationary phase has been reached after this period (see Note 5).
At this point, if working with various mutant strains, cell density can be adjusted to approximately 1.5 × 10⁹/mL (density of BW25113 strain) by resuspending a pellet containing the desired number of cells in cell-free spent medium of the same strain.
If working with different mutant or wild type (wt) strains reaching different pH at stationary phase, the pH can be adjusted to 8.5 (pH of stationary phase wt culture in initially unbuffered LB) by adding AMPSO buffer to a final concentration of 100 mM that has been brought to the desired pH with 10 M NaOH (see Notes 6 and 7).
Cultures are incubated at 37°C and 70% relative humidity and CFU’s are measured over time by removing an aliquot, serially diluting in 0.5% NaCl that has been sterilized by autoclaving, followed by colony enumeration after plating on LB agar plates that are incubated for approximately 16 h at 37°C (see Note 8). Hence, enumeration of live bacteria using this method is dependent on the ability of a non-proliferating bacterium from the liquid culture to resume growth when transferred onto solid nutrient media, resulting in the formation of a colony visible by the naked eye.
3.2. Quantification of Protein Carbonyls
Oxidative damage in the form of protein carbonyls has been used as a biomarker of protein damage and cellular senescence in E. coli.
An E. coli strain is inoculated in 25 mL of LB in a 125-mL flask by a 1:1,000 transfer from an overnight 1 mL LB culture (see Note 9).
At 3 h after inoculation, 3 mL are removed from the culture to provide the log phase sample.
2.5 mL of 1 M HEPES buffer is added to the culture at 12 h after inoculation, that is the onset of stationary phase (see Note 10).
On days 1, 3, and 5, 1.5-mL samples are collected in Eppendorf tubes. The samples are centrifuged, supernatant aspirated off and the pellets are flash-frozen by incubating in crushed dry ice for 2 min. The frozen pellets are subsequendy stored at −70°C.
After all samples have been collected, they are removed from the freezer and thawed on ice.
Each pellet is then resuspended in 100 μL of Y-PER protein extraction reagent (Pierce) and incubated for 20 min at room temperature.
Cell debris is pelleted by centrifuging for 5 min at 14,000 × J and the supernatant used as the protein extract during the subsequent steps.
Protein concentration is quantified in duplicate using the BCA protein assay kit (Pierce, see Note 11).
The Oxyblot protein oxidation detection kit (Chemicon) is used to quantify the amount of protein carbonyls in each sample starting with 8 μg of protein for each sample in a volume of 5 μL.
Each protein aliquot is denatured by the addition of 5 μL, 12% SDS.
10 μL of 1× 2,4-dinitrophenylhydrazine (DNPH) solution is then added and the solutions incubated at room temperature for 15 min to derivatize the protein carbonyls.
7.5 μL of neutralization solution is then added.
All samples are subsequently transferred to a PVDF membrane using a slot blot apparatus and the Western blot performed as follows.
The membrane is consecutively incubated for 1 h each at room temperature first with a rabbit anti-DNP antibody and then with a HRP-conjugated goat anti-rabbit IgG antibody, both in blocking buffer with gentle shaking.
The membrane is rinsed twice with washing buffer between the two antibody incubations and after the second incubation.
Chemiluminescent HRP detection reagent is layered on top of the membrane and incubated for 1 min at room temperature.
An autoradiography film is then exposed for 30 s on top of the membrane and subsequently developed in the darkroom.
Signal intensity is quantified using die Image J software (http://rsbwcb.nih.gov/ij/).
3.3. Quantification of Oxidative DNA Damage
Cultures are processed as described in Subheading 2 with HEPES (pH 7.5) in a volume of 25 mL in 125-mLErlenmeyer flasks.
Rifampicin-resistant mutants are quantified by plating on LB plates containing the antibiotic at 120 μg/mL after washing once with 0.5% NaCl.
The colonies grown in rifampicin are enumerated and normalized by the total number of CFU’s at each time-point (see Note 12).
3.4. Assaying Stress Resistance
To assay heat shock resistance, cultures are buffered with AMPSO after 12 h of incubation as described in Subheading 3.1, returned to the incubator and 4 h later (16 h after inoculation) are subjected to a 5-min incubation in a 54°C water bath without shaking and CFU’s enumerated before and after the treatment.
For the measurement of resistance to paraquat (methyl viologen dichloride hydrate), cultures are prepared in the same way and paraquat (see Note 3) is added to 500 μM at 12 h after inoculation. CFU’s are enumerated before and after a 12-h incubation at 37°C.
3.5. Time-Lapse Microscopy
Protocol adapted from (45):
A wild-type strain of E. coli is modified to express yellow fluorescent protein under the control of the lactose operon repressor and the Pl promoter of lambda phage (49).
Cells are inoculated onto microscope cavity slides from exponentially growing liquid cultures, such that the colonies and cells grow exponentially in a single plane on the surface of a solid matrix of LB-agarose (NaCl concentration of 5 g/L, see Note 13). The slides are incubated in a temperature-controlled automated microscope at 30°C for up to 6 h (see Notes 14 and 15).
Up to seven fields containing one to four cells each are manually identified at the start of the experiment and stored in the MetaMorph microscope control software.
Fluorescent images are recorded at each field with time points taken generally every 4 min for the first 160 min, then every 2 min for die remaining time (see Notes 16 and 17).
Images are taken with a CoolSNAP HQ camera at 100× magnification; the resulting images have a spatial dimension of 0.064 μm per pixel (see Notes 18 and 19).
Footnotes
Tryptone is marketed as a pancreatic digest of casein. Casein (80%) and whey (20%) are the fundamental protein components of milk. Casein is a mixture of proteins that contains all of the common amino acids. After it is separated from the other components of milk, it is subjected to enzymatic hydrolysis using pancreatic enzymes that contain, among others, trypsin and chymotrypsin. The resulting substance contains varying amounts of all the amino acids, both free and as part of peptides, and very little carbohydrate (4.3 mg/g).
Yeast extract, an animal-free peptone, is manufactured by the controlled autolysis of cultures of the baker’s yeast S. cerevisiae. Apart from amino acids, it also contains a significant amount of carbohydrate (163 mg/g) and also several micronutrients that include B-complex vitamins. All information regarding the contents of LB was extracted from the BD Bionutrients™ technical manual, third edition revised, which is available from the manufacturer’s website.
A fresh solution of paraquat is prepared using sterile de-ionized water before each use to ensure that the drug does not break down during extended storage.
Survival experiments can also be carried out in a various minimal media (e.g., M9 or M63) with the addition of the different carbon sources at the desired concentrations (e.g., M9 medium containing 0.5% glucose). The recipe for these media can be found in standard laboratory manuals (e.g., the one edited by Maniatis).
In case a higher degree of aeration compared to the one provided by test-tubes is required, cultures can be maintained in 10 mL of LB in orbitally shaking 125-mL Erlenmeyer flasks.
The pH can be adjusted to a neutral value (7.5, since the intracellular pH of E. coli over a range of extracellular pH values is 7.4–7.8 (50)) by the addition of 100 mM HEPES buffer to the culture.
Spontaneous and adjusted pH for the different strains can be quantified using either a pH electrode or pH test strips.
The period of incubation of these LB agar plates need not be precisely measured, but care should be taken to allow enough time for any late-appearing colonies to emerge and be counted.
To minimize the fraction of culture removed for each sampling, larger culture volumes are required compared to those for the survival experiments described above.
The quantification of protein carbonyls during a survival experiment is more appropriately carried out at an external pH of 7.5 (rather than 8.5) so as to increase the time-window available for the detection of any age-dependent changes.
All extracts are diluted using water to equalize the protein concentration to that of the least concentrated sample.
Care should be taken in order to measure any late-emerging colonies on the rifampicin plates. These colonies need to be restreaked on rifampicin-containing plates to ensure that they are indeed resistant and to rule out the possibility that they arose due to the breakdown of the antibiotic.
The slide cavities are sealed with silicone grease and contained sufficient oxygen and nutrients to allow unhindered growth and fluorescence for the length of the experiment.
The entire microscope is contained within the incubator, eliminating temperature variation.
The conditions described for time-lapse microscopy result in an excess of nutrients and a protected environment without external causes of cell mortality.
A subset of six colonies is recorded every 40 s for improved time resolution.
The excitation light does not affect the cellular growth rate.
Excitation light (480–520 nm) is limited to 5% of the output of a 100-W Hg vapor lamp, with an exposure of 2 s.
Emission wavelengths are 505–565 nm.
References
- 1.Finkel SE. Long-term survival during stationary phase: evolution and die GASP phenotype. Nat Rev Microbiol. 2006;4:113–120. doi: 10.1038/nrmicro1340. [DOI] [PubMed] [Google Scholar]
- 2.Gonidakis S. PhD thesis. University of Southern California; Los Angeles: 2010. Molecular genetics of longevity in Escherichia coli. [Google Scholar]
- 3.Pin C, Baranyi J. Single-cell and population lag times as a function of cell age. Appl Environ Microbiol. 2008;74:2534–2536. doi: 10.1128/AEM.02402-07. [DOI] [PMC free article] [PubMed] [Google Scholar]
- 4.Zambrano MM, Siegele DA, Almiron M, Tormo A, Kolter R. Microbial competition: Escherichia coli mutants that take over stationary phase cultures. Science. 1993;259:1757–1760. doi: 10.1126/science.7681219. [DOI] [PubMed] [Google Scholar]
- 5.Nystrom T, Larsson C, Gustafsson L. Bacterial defense against aging: role of the Escherichia coli ArcA regulator in gene expression, readjusted energy flux and survival during stasis. EMBO J. 1996;15:3219–3228. [PMC free article] [PubMed] [Google Scholar]
- 6.Parrell MJ, Finkel SE. The growth advantage in stationary-phase phenotype conferred by rpoS mutations is dependent on the pH and nutrient environment. J Bacteriol. 2003;185:7044–7052. doi: 10.1128/JB.185.24.7044-7052.2003. [DOI] [PMC free article] [PubMed] [Google Scholar]
- 7.Wei Y, Lee JM, Richmond C, Blattner FR, Rafalski JA, LaRossa RA. High-density microarray-mediated gene expression profiling of Escherichia coli. J Bacteriol. 2001;183:545–556. doi: 10.1128/JB.183.2.545-556.2001. [DOI] [PMC free article] [PubMed] [Google Scholar]
- 8.Hartl DL, Dykhuizen DE. The population genetics of Escherichia coli. Annu Rev Genet. 1984;18:31–68. doi: 10.1146/annurev.ge.18.120184.000335. [DOI] [PubMed] [Google Scholar]
- 9.Doran JW, Linn DM. Bacteriological quality of runoff water from pastureland. Appl Environ Microbiol. 1979;37:985–991. doi: 10.1128/aem.37.5.985-991.1979. [DOI] [PMC free article] [PubMed] [Google Scholar]
- 10.Roszak DB, Colwell RR. Survival strategies of bacteria in the natural environment. Microbiol Rev. 1987;51:365–379. doi: 10.1128/mr.51.3.365-379.1987. [DOI] [PMC free article] [PubMed] [Google Scholar]
- 11.Bogosian G, Sammons LE, Morris PJ, O’Neil JP, Heitkamp MA, Weber DB. Death of the Escherichia coli K-12 strain W3110 in soil and water. Appl Environ Microbiol. 1996;62:4114–4120. doi: 10.1128/aem.62.11.4114-4120.1996. [DOI] [PMC free article] [PubMed] [Google Scholar]
- 12.Garcia-Lara J, Martinez J, Vilamu M, Vives-Rego J. Effect of previous growth conditions on the starvation-survival of Escherichia coli in seawater. J Gen Microbiol. 1993;139:1425–1431. doi: 10.1099/00221287-139-7-1425. [DOI] [PubMed] [Google Scholar]
- 13.Morinigo MA, Cornax R, Castro D, Martinez-Manzanares E, Borrego JJ. Viability of Salmonella spp and indicator microorganisms in seawater using membrane diffusion chambers. Antonie Van Leeuwenhoek. 1990;57:109–117. doi: 10.1007/BF00403162. [DOI] [PubMed] [Google Scholar]
- 14.Rozen Y, Belkin S. Survival of enteric bacteria in seawater. FEMS Microbiol Rev. 2001;25:513–529. doi: 10.1111/j.1574-6976.2001.tb00589.x. [DOI] [PubMed] [Google Scholar]
- 15.Ericsson M, Hanstorp D, Hagberg P, Enger J, Nystrom T. Sorting out bacterial viability with optical tweezers. J Bacteriol. 2000;182:5551–5555. doi: 10.1128/jb.182.19.5551-5555.2000. [DOI] [PMC free article] [PubMed] [Google Scholar]
- 16.Gonidakis S, Finkel SE, Longo VD. Genome-wide screen identifies Escherichia coli TCA-cycle-related mutants with extended chronological lifespan dependent on acetate metabolism and the hypoxia-inducible transcription factor ArcA. Aging Cell. 2010;9:868–881. doi: 10.1111/j.1474-9726.2010.00618.x. [DOI] [PMC free article] [PubMed] [Google Scholar]
- 17.Wei M, Fabrizio P, Madia F, Hu J, Ge H, Li LM, Longo VD. Torl/Sch9-regulated carbon source substitution is as effective as calorie restriction in life span extension. PLoS Genet. 2009;5:e1000467. doi: 10.1371/journal.pgen.1000467. [DOI] [PMC free article] [PubMed] [Google Scholar]
- 18.Rea S, Johnson TE. A metabolic model for life span determination in Caenorhabditis elegans. Dev Cell. 2003;5:197–203. doi: 10.1016/s1534-5807(03)00242-9. [DOI] [PubMed] [Google Scholar]
- 19.Chen D, Thomas EL, Kapahi P. HIF-1 modulates dietary restriction-mediated lifespan extension via IRE-1 in Caenorhabditis elegans. PLoS Genet. 2009;5:el000486. doi: 10.1371/journal.pgen.1000486. [DOI] [PMC free article] [PubMed] [Google Scholar]
- 20.Mehta R, Steinkraus KA, Sutphin GL, Ramos FJ, Shamieh LS, Huh A, Davis C, Chandler-Brown D, Kaeberlein M. Proteasomal regulation of the hypoxic response modulates aging in C. elegans. Science. 2009;324:1196–1198. doi: 10.1126/science.1173507. [DOI] [PMC free article] [PubMed] [Google Scholar]
- 21.Zhang Y, Shao Z, Zhai Z, Shen C, Powell-Coffman JA. The HIF-1 hypoxia-inducible factor modulates lifespan in C. elegans. PLoS One. 2009;4:e6348. doi: 10.1371/journal.pone.0006348. [DOI] [PMC free article] [PubMed] [Google Scholar]
- 22.Nystrom T. Role of oxidative carbonylation in protein quality control and senescence. EMBO J. 2005;24:1311–1317. doi: 10.1038/sj.emboj.7600599. [DOI] [PMC free article] [PubMed] [Google Scholar]
- 23.Dukan S, Nystrom T. Bacterial senescence: stasis results in increased and differential oxidation of cytoplasmic proteins leading to developmental induction of the heat shock regulon. Genes Dev. 1998;12:3431–3441. doi: 10.1101/gad.12.21.3431. [DOI] [PMC free article] [PubMed] [Google Scholar]
- 24.Dukan S, Nystrom T. Oxidative stress defense and deterioration of growth-arrested Escherichia coli cells. J Biol Chem. 1999;274:26027–26032. doi: 10.1074/jbc.274.37.26027. [DOI] [PubMed] [Google Scholar]
- 25.Desnues B, Cuny C, Gregori G, Dukan S, Aguilaniu H, Nystrom T. Differential oxidative damage and expression of stress defence regulons in culturable and non-culturable Escherichia coli cells. EMBO Rep. 2003;4:400–404. doi: 10.1038/sj.embor.embor799. [DOI] [PMC free article] [PubMed] [Google Scholar]
- 26.Gonidakis S, Finkel SE, Longo VD. E. coli hypoxia-inducible factor ArcA mediates lifespan extension in a lipoic acid synthase mutant by suppressing acetyl-CoA synthetase. Biol Chem. 2010;391:1139–1147. doi: 10.1515/BC.2010.120. [DOI] [PMC free article] [PubMed] [Google Scholar]
- 27.Harman D. Aging: a theory based on free radical and radiation chemistry. J Gerontol. 1956;11:298–300. doi: 10.1093/geronj/11.3.298. [DOI] [PubMed] [Google Scholar]
- 28.Muller FL, Lustgarten MS, Jang Y, Richardson A, Van Remmen H. Trends in oxidative aging theories. Free Radic Biol Med. 2007;43:477–503. doi: 10.1016/j.freeradbiomed.2007.03.034. [DOI] [PubMed] [Google Scholar]
- 29.Van Raamsdonk JM, Hekimi S. Deletion of the mitochondrial superoxide dismutase sod-2 extends lifespan in Caenorhabditis elegans. PLoS Genet. 2009;5:e1000361. doi: 10.1371/journal.pgen.1000361. [DOI] [PMC free article] [PubMed] [Google Scholar]
- 30.Hu D, Cao P, Thiels E, Chu CT, Wu GY, Oury TD, Klann E. Hippocampal long-term potentiation, memory, and longevity in mice that overexpress mitochondrial superoxide dismutase. Neurobiol Learn Mem. 2007;87:372–384. doi: 10.1016/j.nlm.2006.10.003. [DOI] [PMC free article] [PubMed] [Google Scholar]
- 31.Longo VD, Finch CE. Evolutionary medicine: from dwarf model systems to healthy centenarians? Science. 2003;299:1342–1346. doi: 10.1126/science.1077991. [DOI] [PubMed] [Google Scholar]
- 32.Jobson RW, Nabholz B, Galtier N. An evolutionary genome scan for longevity-related natural selection in mammals. Mol Biol Evol. 2009;27:840–847. doi: 10.1093/molbev/msp293. [DOI] [PubMed] [Google Scholar]
- 33.Jin DJ, Gross CA. Mapping and sequencing of mutations in the Escherichia coli rpoB gene that lead to rifampicin resistance. J Mol Biol. 1988;202:45–58. doi: 10.1016/0022-2836(88)90517-7. [DOI] [PubMed] [Google Scholar]
- 34.Garibyan L, Huang T, Kim M, Wolff E, Nguyen A, Nguyen T, Diep A, Hu K, Iverson A, Yang H, Miller JH. Use of the rpoB gene to determine the specificity of base substitution mutations on the Escherichia coli chromosome. DNA Repair (Amst) 2003;2:593–608. doi: 10.1016/s1568-7864(03)00024-7. [DOI] [PubMed] [Google Scholar]
- 35.Benov L, Fridovich I. A superoxide dismutase mimic protects sodA sodB Escherichia coli against aerobic heating and stationary-phase death. Arch Biochem Biophys. 1995;322:291–294. doi: 10.1006/abbi.1995.1465. [DOI] [PubMed] [Google Scholar]
- 36.Farr SB, D’Ari R, Touati D. Oxygen-dependent mutagenesis in Escherichia coli lacking superoxide dismutase. Proc Natl Acad Sci U S A. 1986;83:8268–8272. doi: 10.1073/pnas.83.21.8268. [DOI] [PMC free article] [PubMed] [Google Scholar]
- 37.Jenkins DE, Schultz JE, Matin A. Starvation-induced cross protection against heat or H2O2 challenge in Escherichia coli. J Bacteriol. 1988;170:3910–3914. doi: 10.1128/jb.170.9.3910-3914.1988. [DOI] [PMC free article] [PubMed] [Google Scholar]
- 38.Hengge-Aronis R. Stationary phase gene regulation: what makes an Escherichia coli promoter sigmaS-selective? Curr Opin Microbiol. 2002;5:591–595. doi: 10.1016/s1369-5274(02)00372-7. [DOI] [PubMed] [Google Scholar]
- 39.Hengge-Aronis R, Klein W, Lange R, Rimmele M, Boos W. Trehalose synthesis genes are controlled by the putative sigma factor encoded by rpoS and are involved in stationary-phase thermotolerance in Escherichia coli. J Bacteriol. 1991;173:7918–7924. doi: 10.1128/jb.173.24.7918-7924.1991. [DOI] [PMC free article] [PubMed] [Google Scholar]
- 40.Conter A, Gangneux C, Suzanne M, Gutierrez C. Survival of Escherichia coli during long-term starvation: effects of aeration, NaCl, and the rpoS and osmC gene products. Res Microbiol. 2001;152:17–26. doi: 10.1016/s0923-2508(00)01164-5. [DOI] [PubMed] [Google Scholar]
- 41.Hengge-Aronis R, Fischer D. Identification and molecular analysis of glgS, a novel growth-phase-regulated and rpoS-dependent gene involved in glycogen synthesis in Escherichia coli. Mol Microbiol. 1992;6:1877–1886. doi: 10.1111/j.1365-2958.1992.tb01360.x. [DOI] [PubMed] [Google Scholar]
- 42.Hassan HM, Fridovich I. Regulation of the synthesis of superoxide dismutase in Escherichia coli. Induction by methyl viologen. J Biol Chem. 1977;252:7667–7672. [PubMed] [Google Scholar]
- 43.Miller RA. Cell stress and aging: new emphasis on multiplex resistance mechanisms. J Gerontol A Biol Sci Med Sci. 2009;64:179–182. doi: 10.1093/gerona/gln072. [DOI] [PMC free article] [PubMed] [Google Scholar]
- 44.Longo VD, Mitteldorf J, Skulachev VP. Programmed and altruistic ageing. Nat Rev Genet. 2005;6:866–872. doi: 10.1038/nrg1706. [DOI] [PubMed] [Google Scholar]
- 45.Stewart EJ, Madden R, Paul G, Taddei F. Aging and death in an organism that reproduces by morphologically symmetric division. PLoS Biol. 2005;3:e45. doi: 10.1371/journal.pbio.0030045. [DOI] [PMC free article] [PubMed] [Google Scholar]
- 46.Lindner AB, Madden R, Demarez A, Stewart EJ, Taddei F. Asymmetric segregation of protein aggregates is associated with cellular aging and rejuvenation. Proc Natl Acad Sci U S A. 2008;105:3076–3081. doi: 10.1073/pnas.0708931105. [DOI] [PMC free article] [PubMed] [Google Scholar]
- 47.Steinkraus KA, Kaeberlein M, Kennedy BK. Replicative aging in yeast: the means to the end. Annu Rev Cell Dev Biol. 2008;24:29–54. doi: 10.1146/annurev.cellbio.23.090506.123509. [DOI] [PMC free article] [PubMed] [Google Scholar]
- 48.Fabrizio P, Longo VD. The chronological life span of Saccharomyces cerevisiae. Aging Cell. 2003;2:73–81. doi: 10.1046/j.1474-9728.2003.00033.x. [DOI] [PubMed] [Google Scholar]
- 49.Elowitz MB, Levine AJ, Siggia ED, Swain PS. Stochastic gene expression in a single cell. Science. 2002;297:1183–1186. doi: 10.1126/science.1070919. [DOI] [PubMed] [Google Scholar]
- 50.Slonczewski JL, Rosen BP, Alger JR, Macnab RM. pH homeostasis in Escherichia coli: measurement by 31P nuclear magnetic resonance of methylphosphonate and phosphate. Proc Natl Acad Sci U S A. 1981;78:6271–6275. doi: 10.1073/pnas.78.10.6271. [DOI] [PMC free article] [PubMed] [Google Scholar]