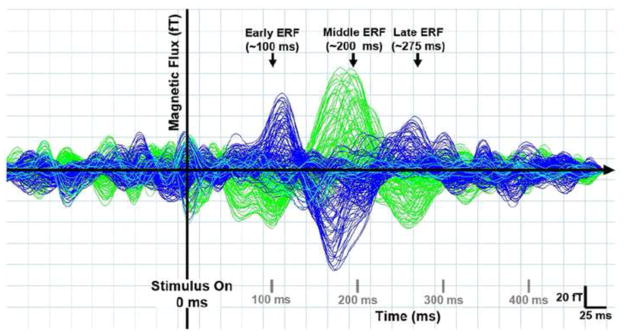
Figure 2. Timing of MEG Evoked Responses.

Representative data from one subject showing three main stimulus evoked responses in magnetic signals averaged across all trial types (i.e. after collapsing across all experimental conditions). Traces represent the averaged magnetic response for each MEG sensor as a function of time for one recording run (180 trials). Blue and green traces represent sensors positioned over the right and left cortical hemispheres respectively while aqua traces represent midline sensor positions. The earliest evoked response peaked between 40–140 ms post stimulus (early ERF). A second, higher amplitude response peaked between 140–290 ms post stimulus (middle ERF) and was followed by a third, lower amplitude response that peaked between 190–390 ms post stimulus.
