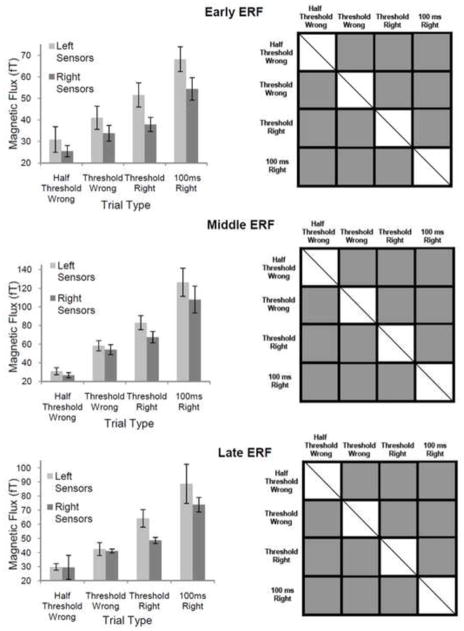
Figure 5. Mean ERF Peak Amplitudes for Correctly and Incorrectly Identified Stimuli of ½ Threshold, Threshold and 100 ms Duration.
Left column— average ERF peak amplitudes for each trial type (error bars represent standard errors of the mean). For all three ERFs (early, middle and late), the mean peak amplitude of evoked responses gradually increased from low values for trials where ½ threshold duration stimuli were incorrectly identified to high values for trials where 100 ms duration stimuli were correctly identified. Right column— Statisticlaly significant differences between the various trial types. Grey squares depict pairwise comparisons that were significantly different. Squares with diagonal lines represent conditions that could not be compared. Statistical analysis was done after combining data recorded from left and right sensor groups for each trial type. All pairwise comparisons yielded significant differences. These data support a graded rathar than all-or-none model of stimulus recognition.

