

Abstract
Background
The American Heart Association's 2020 Strategic Impact Goals define a new concept, “cardiovascular (CV) health”; however, current prevalence estimates of the status of CV health in U.S. adults according to age, sex and race/ethnicity have not been published.
Methods and Results
We included 14,515 adults (≥20 years) from the 2003-2008 National Health and Nutrition Examination Surveys. Participants were stratified by young (20-39 years), middle (40-64 years), and older ages (65+ years). CV health behaviors (diet, physical activity, body mass index, smoking) and CV health factors (blood pressure, total cholesterol, fasting blood glucose, smoking) were defined as poor, intermediate, or ideal. Less than 1% of adults exhibited ideal CV health for all 7 metrics. For CV health behaviors, non-smoking was most prevalent (range:60.2-90.4%) while ideal Healthy Diet Score was least prevalent (range:0.2-2.6%) across groups. Prevalence of ideal BMI (range:36.5-45.3%) and ideal physical activity levels (range:50.2-58.8%) were higher in young adults compared to middle or older ages. Ideal total cholesterol (range:23.7-36.2%), blood pressure (range:11.9-16.3%) and fasting blood glucose (range:31.2-42.9%) were lower in older adults compared with young and middle age adults.Prevalence of poor CV health factors was lowest in young age but higher at middle and older ages. Prevalence estimates by age and sex were consistent across race/ethnic groups.
Conclusions
These prevalence estimates of CV health represent a starting point from which effectiveness of efforts to promote CV health and prevent CV disease can be monitored and compared in U.S. adult populations.
Keywords: Cardiovascular Diseases, Diet, Epidemiology, Obesity, Risk Factors
The American Heart Association's (AHA) Strategic Impact Goals for 2020 and Beyond1 comprisethe following objective: “By 2020, to improve the cardiovascular health of all Americans by 20% while reducing deaths from cardiovascular diseases and stroke by 20%”. Accompanying these goals was a new concept, “cardiovascular (CV) health”, along with metrics for defining and monitoring it in the U.S. population. For this purpose, the definition includes criteria for the entire spectrum of CV health, including poor, intermediate, and ideal ranges for each of 7 metrics. To achieve overall “Ideal CV health”, adults must have the simultaneous presence of: 1) absence of clinical CVD (i.e., coronary heart disease, myocardial infarction, angina, stroke, heart failure);2)ideal CV health behaviors (non-smoking, body mass index (BMI) <25 kg/m2, physical activity at recommended goal levels2, and dietary intakes consistent with a DASH-like eating pattern3); and 3) ideal CV health factors (non-smoking (also considered a behavior), untreated total cholesterol <200 mg/dL, untreated blood pressure <120/<80 mm Hg, untreated fasting blood glucose<100 mg/dL). The association betweenideal CV health and extremely favorable outcomes over 20 years of follow-up has been recently validated in the Atherosclerosis Risk in Communities study4. Although general prevalence estimates of CV health metrics are available for U.S. adults ≥ 20 years1, prevalence estimates by age, sex, and race/ethnicity have not been reported.
Using a representative sample of U.S. adults examined from 2003-2008, we sought to define current age-,sex-, and race/ethnicity-specific prevalence estimates of the individual components of CV health according to poor, intermediate, and ideal levels. Additionally, we detail specific prevalence estimates for adults having zero to seven ideal CV health components as identified in the AHA 2020 Strategic Impact Goals.
Methods
Measurements and Sample
This cross-sectional study utilized six years of data from the 2003-2008 National Health and Nutrition Examination Surveys (NHANES)5. NHANES collects data in two-year cycles and the sampling methodology used for participant recruitment is designed to ensure the sample is nationally representative of the civilian, non-institutionalized U.S. population. To ensure the representative nature of sampling,NHANES data are collected using a complex, multistage, probability design to select participants from strata defined by geography and proportions of minority populations. These strata are mostly single counties or contiguous counties selected with probability proportional to a measure of size. Participants were interviewed at home and were invited to attend a mobile examination center (MEC), where they underwent various anthropometric and physiologic examinations and provided a blood sample. All data were collected according to standard NHANES protocols across sites.The NHANES questionnaires and protocols are available elsewhere6. The total combined sample of NHANES 2003-2008 was 30,619 participants. The analysis sample for the current report consisted of 14,515 adults, following exclusions for age <20 years (n=14,015), incomplete interview or exam (n=1,264), or pregnancy or breast-feeding at time of exam (n=825). All participants withavailable CV components were included in prevalence estimates for specific components, while participants with complete information for all 7 CV health components were included for prevalence estimates of the number of CV health factors. Written informed consent was given by all participants and the study design, data collection and analyses were performed in accordance with ethical standards of supervising institutional review boards of all centers involved.
Demographic Characteristics
Demographic characteristics (age, sex, race/ethnicity, educational attainment, annual household income) were queried during the home interview. Participants were stratified by age into three groups: young age (20-39 years), middle age (40-64 years), or older age (65+ years). Self-reported race/ethnicity was categorized asnon-Hispanic White, non-Hispanic Black, Mexican American, Other Hispanic or Other according to NHANES protocol. Educational attainment was categorized as < high school, completion of high school, or > high school. Annual household income was categorized as <$45,000 or ≥ $45,000.
Definition of Cardiovascular Health
To define the complete spectrum of CV health, all components are categorized as poor, intermediate, or ideal as outlined in the AHA 2020 Strategic Impact Goals1. Criteria for CV health components for adults≥20 years are outlined in Table 1. Ideal CV health is defined by the simultaneous presence of ideal levels of all sevenCV health components.
Table 1.
American Heart Association 2020 Strategic Impact Goals Definition of Poor, Intermediate, and Ideal Cardiovascular Health for Each Goal/Metric for Adults > 20 Years of Age
| Cardiovascular Health Goals/Metrics | Definitions | ||
|---|---|---|---|
| Poor | Intermediate | Ideal | |
| Current Smoking | Yes | Former, quit ≤ 12 months prior | Never or quit > 12 months prior |
| Body Mass Index | ≥30.0 kg/m2 | 25.0–29.9 kg/m2 | <25.0 kg/m2 |
| Physical Activity Level | None | 1–149 minutes/week moderate intensity or 1–74 minutes/week vigorous intensity or 1–149 minutes/week moderate + vigorous* | ≥150 minutes/week moderate intensity or ≥75 minutes/week vigorous intensity or ≥150 minutes/week moderate + vigorous* |
| Healthy Diet Score† | 0-1 Components | 2-3 Components | 4-5 Components |
| Total Cholesterol | ≥240 mg/dL | 200-239 mg/dL or treated to goal | <200 mg/dL untreated |
| Blood Pressure | SBP ≥140 or DBP ≥90 mmHg | SBP 120-139 or DBP 80-89 mmHg or treated to goal | <120/<80 mmHg untreated |
| Fasting Blood Glucose | ≥126 mg/dL | 100-125 mg/dL or treated to goal | <100 mg/dL untreated |
Table adapted from Lloyd-Jones et al. Circulation. 2010; 121:586-613.
Minutes of vigorous activity are equal to 2X minutes of moderate activity when moderate and vigorous activities are combined.
Healthy Diet Score components include Fruits and vegetables: ≥4.5 cups/day: Fish: ≥two 3.5-oz servings/week, Fiber-rich whole grains (≥1.1 g of fiber per 10 g of carbohydrate): ≥three 1-oz-equivalent servings/day; Sodium: ≤1500 mg/day; Sugar-sweetened beverages: ≤450 kcal/week. Dietary recommendations are scaled according to a 2,000 kcal/day diet.
Assessment of Cardiovascular Health Behaviors
Smoking status was determined based on responses to questionnaires regarding use of cigarettes, pipes, and cigars. Height and weight were measured during the clinical exam and used to calculate BMI (kg/m2). To assess self-reported physical activity, participants were asked to report the frequency and duration of specific moderate intensity activities, “tasks that caused light sweating or a slight to moderate increase in breathing or heart rate,” and vigorous intensity activities that “cause heavy sweating or large increases in breathing or heart rate” over the past week or month.Transportation and household activities were asked separately. For assessment of dietary intake, survey respondents provided two interviewer-administered 24-hour recalls. From these recalls, the proportion of U.S. adults who meet the primary five goalsof the Healthy Diet Score used to define CV health were assessed, including fruits and vegetables ≥ 4.5 cups/day, fish ≥ two 3.5 ounce servings/week, whole grains ≥ three 1 oz. servings/day, sodium < 1500 mg/day, added sugar in sugar-sweetened beverages < 450 kcal/week. Intakes of fruits, vegetables, fish and whole grains were scaled to a 2,000 kcal/day diet. All dietary factors were calculated using the MyPyramid Equivalents Database according to methodology established by the USDA Center for Nutrition Policy and Promotion7.
Assessment of Cardiovascular Health Factors
Participants were asked to fast for ≥12 hours prior to clinical examination. Blood samples were obtained and sent to central laboratories for determination of blood lipids and plasma glucose. Detailed descriptions about blood collection and processingare provided in the NHANES Laboratory/Medical TechnologistsProcedures Manual [http://www.cdc.gov/nchs/nhanes/nhanes_questionnaires.htm]. All blood pressure measurements were taken after resting quietly in a sitting position for 5 minutes and determining the maximum inflation level. Three consecutive blood pressure readings were attempted. If a blood pressure measurement was interrupted or incomplete, a fourth attempt could be made. The average of all blood pressure measurements were used for these analyses. Blood pressure measurements were taken in the MEC and medical history, including medication use and history of CVD or diabetes, was assessed during home interview.
Definition of Treatment Control for Cardiovascular Health Factors
Total cholesterol <200 mg/dL, blood pressure ≤140/<90 mm/Hg, and fasting blood glucose <130 mg/dLwere used asthe threshold definitions of controlled treatment is in agreement with current clinical practice guidelines8-10.
Statistical Analyses
All statistical analyses were performed using SAS 9.1 (SAS institute, Cary, NC). To incorporate the complex, multistage sampling design of the NHANES, procedure SURVEYFREQ was utilized. The examination and average laboratory weights were used to estimate the number of non-institutionalized, non-pregnant, non-lactating U.S. adults ≥20 years old in each age, sex and race/ethnicity group as appropriate. Final sampling weights were divided by the number of combined surveys to estimate population average. For prevalence estimates, non-overlapping 95% CIs indicatestatistical significance.
Results
Our final analysis sample included 14,515 NHANES participants, which represents a population of approximately 205.6 million non-institutionalized U.S. adults. The sample was balanced by sex (49.3% women, 50.7% men). Sociodemographic characteristics and prevalence estimates for all components of CV health according to health status (poor, intermediate, ideal) stratified by sex and age group, are presented in Tables 2 and 3. Similar estimates for race/ethnic groups are presented in Supplemental Tables 1-6. Men and women of all age groups were predominantly non-Hispanic White, and young and middle aged men and women frequently had an education level beyond high school. Young and middle aged adults tended to have an annual household income ≥$45,000while<$45,000 was most frequently reportedfor older adults. When compared to non-Hispanic Whites, non-Hispanic Black and Mexican American men and women less frequently had an education level beyond high schooland reported an annual household income ≥$45,000.
Table 2.
Characteristics and Prevalence of Cardiovascular Health Behaviors and Factors in U.S. WOMEN by Age Group: National Health and Nutrition Examination Surveys 2003-2008
| Characteristics | Young Age 20-39 years | Middle Age 40-64 years | Older Age 65+ years | |||
|---|---|---|---|---|---|---|
| Percent Prevalence (95% C.I.) | Population Estimates (millions) | Percent Prevalence (95% C.I.) | Population Estimates (millions) | Percent Prevalence (95% C.I.) | Population Estimates (millions) | |
| Race/Ethnicity | (n=2,166) | (n=3,008) | (n=1,985) | |||
| White (Non-Hispanic) | 64.4 (60.0-68.8) | 23.1 | 72.5 (68.4-76.6) | 35.0 | 82.5 (79.1-85.9) | 16.9 |
| Black (Non-Hispanic) | 14.1 (11.4-16.8) | 5.1 | 12.0 (9.5-14.6) | 5.8 | 8.7 (6.6-10.9) | 1.8 |
| Mexican American | 10.1 (7.9-12.3) | 3.6 | 5.8 (4.2-7.4) | 2.8 | 3.2 (1.8-4.7) | 0.7 |
| Other Hispanics | 5.3 (3.9-6.7) | 1.8 | 5.8 (4.2-7.4) | 1.9 | 2.1 (1.1-3.1) | 0.7 |
| Other | 6.1 (4.6-7.7) | 2.2 | 3.9 (2.6-5.2) | 2.8 | 3.4 (2.3-4.6) | 0.4 |
| Educational Attainment | (n=2,165) | (n=3,007) | (n=1,974) | |||
| <High school | 16.0 (14.0-18.1) | 5.7 | 15.0 (13.1-16.9) | 7.2 | 30.2 (26.5-34.0) | 6.2 |
| High school graduate | 21.8 (19.4-24.2) | 7.8 | 25.2 (23.1-27.2) | 12.2 | 32.8 (30.6-35.1) | 6.7 |
| ≥ High school | 62.2 (59.3-65.0) | 22.3 | 59.8 (56.6-63.0) | 28.9 | 36.9 (33.6-40.2) | 7.5 |
| Annual Household Income | (n=1,904) | (n=2,656) | (n=1,819) | |||
| <$45,000 | 50.9 (47.7-54.1) | 15.8 | 44.2 (40.8-47.6) | 17.8 | 72.9 (69.0-76.9) | 13.7 |
| ≥ $45,000 | 49.1 (45.9-52.3) | 15.2 | 55.8 (52.4-59.2) | 22.5 | 27.1 (23.1-31.0) | 5.1 |
| Smoking Status | (n=2,165) | (n=3,008) | (n=1,985) | |||
| Poor | 27.2 (24.4-29.9) | 9.7 | 22.2 (19.8-24.5) | 10.7 | 8.6 (7.3-10.0) | 1.7 |
| Intermediate | 3.8 (3.0-4.6) | 1.4 | 2.2 (1.5-2.8) | 1.1 | 1.0 (0.5-1.4) | 0.2 |
| Ideal | 69.1 (66.1-72.0) | 24.7 | 75.6 (73.3-78.0) | 36.5 | 90.4 (89.0-91.7) | 18.5 |
| Body Mass Index | (n=2,142) | (n=2,962) | (n=1,908) | |||
| Poor | 31.2 (28.5-34.0) | 11.1 | 39.1 (36.7-41.6) | 18.6 | 30.8 (28.1-33.5) | 6.1 |
| Intermediate | 23.4 (21.1-25.7) | 8.3 | 27.8 (25.6-30.0) | 13.2 | 35.5 (32.6-38.5) | 7.0 |
| Ideal | 45.3 (42.1-48.6) | 16.1 | 33.1 (30.6-35.7) | 15.8 | 33.7 (30.6-36.7) | 6.7 |
| Physical Activity Level | (n=2,166) | (n=3,008) | (n=1,985) | |||
| Poor | 26.6 (24.3-28.9) | 9.5 | 34.3 (31.7-36.9) | 16.6 | 52.0 (48.5-55.5) | 10.6 |
| Intermediate | 23.2 (20.7-25.6) | 8.3 | 24.3 (22.4-26.2) | 11.7 | 20.9 (18.7-23.1) | 4.3 |
| Ideal | 50.2 (47.0-53.4) | 18.0 | 41.4 (38.6-44.2) | 20.0 | 27.1 (24.0-30.1) | 5.5 |
| Healthy Diet Score | (n=1,785) | (n=2,651) | (n=1,702) | |||
| Poor | 83.0 (80.9-85.1) | 24.8 | 71.0 (1.6-67.7) | 30.8 | 60.0 (1.4-57.1) | 10.8 |
| Intermediate | 16.5 (14.4-18.7) | 4.9 | 28.0 (1.6-24.8) | 12.1 | 37.3 (1.4-34.6) | 6.7 |
| Ideal | 0.5 (0.0-0.9) | 0.1 | 1.1 (0.2-0.7) | 0.5 | 2.6 (0.4-1.8) | 0.5 |
| Total Cholesterol | (n=2,001) | (n=2,851) | (n=1,833) | |||
| Poor | 8.2 (6.8-9.6) | 2.7 | 20.3 (18.4-22.3) | 9.4 | 21.7 (19.4-23.9) | 4.1 |
| Intermediate | 23.1 (21.2-25.1) | 7.7 | 44.2 (42.4-46.0) | 20.5 | 54.6 (52.3-57.0) | 10.5 |
| Ideal | 68.7 (66.5-70.9) | 22.8 | 35.5 (32.9-38.0) | 16.4 | 23.7 (21.4-26.0) | 4.5 |
| Blood Pressure | (n=1,963) | (n=2,719) | (n=1,776) | |||
| Poor | 2.2 (1.5-2.8) | 0.7 | 17.2 (15.5-19.0) | 7.5 | 41.4 (38.8-43.9) | 7.6 |
| Intermediate | 19.0 (16.7-21.3) | 6.2 | 45.4 (43.2-47.6) | 19.9 | 46.7 (44.2-49.3) | 8.6 |
| Ideal | 78.8 (76.5-81.1) | 25.8 | 37.4 (34.7-40.1) | 16.4 | 11.9 (9.7-14.0) | 2.2 |
| Fasting Blood Glucose | (n=525) | (n=766) | (n=483) | |||
| Poor | 1.6 (0.6-2.7) | 0.4 | 6.7 (4.6-8.8) | 2.2 | 17.5 (13.2-21.8) | 2.2 |
| Intermediate | 11.8 (9.0-14.6) | 2.7 | 31.0 (26.2-35.8) | 10.1 | 39.6 (34.2-44.9) | 5.0 |
| Ideal | 86.6 (83.6-89.5) | 20.1 | 62.3 (57.0-67.6) | 20.2 | 42.9 (37.7-48.1) | 5.4 |
Percentages may not total 100 due to rounding. Population estimates for may not be equal across individual variables due to varying sample sizes.
Table 3.
Characteristics and Prevalence of Cardiovascular Health Behaviors and Factors in U.S. MEN by Age Group: National Health and Nutrition Examination Surveys 2003-2008
| Characteristics | Young Age 20-39 years | Middle Age 40-64 years | Older Age 65+ years | |||
|---|---|---|---|---|---|---|
| Percent Prevalence (95% C.I.) | Population Estimates (millions) | Percent Prevalence (95% C.I.) | Population Estimates (millions) | Percent Prevalence (95% C.I.) | Population Estimates (millions) | |
| Race/Ethnicity | (n=2,476) | (n=2,900) | (n=1,980) | |||
| White (Non-Hispanic) | 62.5 (58.0-67.1) | 24.9 | 74.6 (70.7-78.4) | 34.2 | 83.4 (80.0-86.7) | 12.8 |
| Black (Non-Hispanic) | 11.6 (9.4-13.9) | 4.6 | 10.4 (8.4-12.5) | 4.8 | 7.6 (5.7-9.5) | 1.2 |
| Mexican American | 13.8 (11.3-16.3) | 5.5 | 6.4 (4.8-8.0) | 2.9 | 3.4 (1.9-4.9) | 0.5 |
| Other Hispanic | 5.3 (3.6-7.0) | 2.1 | 3.1 (2.1-4.0) | 1.4 | 2.6 (1.4-3.9) | 0.4 |
| Other | 6.8 (5.1-8.4) | 2.7 | 5.5 (4.1-6.9) | 2.5 | 3.0 (1.8-4.2) | 0.5 |
| Educational Attainment | (n=2,475) | (n=2,898) | (n=1,974) | |||
| <High school | 19.8 (17.6-22.1) | 7.9 | 16.7 (14.5-18.9) | 7.6 | 27.3 (23.9-30.7) | 4.2 |
| High school graduate | 27.4 (24.8-30.1) | 10.9 | 26.0 (23.8-28.1) | 11.9 | 26.1 (22.6-29.7) | 4.0 |
| ≥ High school | 52.7 (49.3-56.2) | 21.0 | 57.4 (54.2-60.5) | 26.3 | 46.6 (41.7-51.4) | 7.1 |
| Annual Household Income | (n=2,153) | (n=1,174) | (n=1,810) | |||
| <$45,000 | 47.7 (44.5-50.9) | 16.4 | 38.5 (35.0-42.1) | 14.5 | 64.7 (60.9-68.5) | 9.0 |
| ≥ $45,000 | 52.3 (49.1-55.5) | 18.0 | 61.5 (57.9-65.0) | 23.1 | 35.3 (31.5-39.1) | 5.0 |
| Smoking Status | (n=2,476) | (n=2,900) | (n=1,947) | |||
| Poor | 34.4 (32.1-36.7) | 13.7 | 28.0 (25.4-30.5) | 12.8 | 9.2 (7.5-11.0) | 1.4 |
| Intermediate | 5.4 (4.3-6.5) | 2.2 | 2.2 (1.5-2.9) | 1.0 | 1.8 (1.0-2.6) | 0.3 |
| Ideal | 60.2 (58.0-62.4) | 24.0 | 69.8 (67.2-72.3) | 32.0 | 89.0 (87.0-90.9) | 13.7 |
| Body Mass Index | (n=2,445) | (n=2,862) | (n=1,917) | |||
| Poor | 27.5 (24.8-30.2) | 10.8 | 36.2 (33.3-39.2) | 16.4 | 30.5 (27.9-33.2) | 4.6 |
| Intermediate | 36.0 (33.7-38.3) | 14.1 | 42.2 (39.5-44.9) | 19.1 | 43.5 (40.1-46.9) | 6.5 |
| Ideal | 36.5 (34.2-38.8) | 14.4 | 21.5 (19.3-23.8) | 9.7 | 26.0 (23.6-28.3) | 3.9 |
| Physical Activity Level | (n=2,476) | (n=2,900) | (n=1,980) | |||
| Poor | 22.0 (19.7-24.4) | 8.8 | 32.1 (29.2-35.0) | 14.7 | 42.6 (39.9-45.2) | 6.5 |
| Intermediate | 19.2 (17.3-21.0) | 7.6 | 19.0 (16.9-21.1) | 8.7 | 16.5 (14.3-18.7) | 2.5 |
| Ideal | 58.8 (56.0-61.6) | 23.4 | 48.9 (46.4-51.5) | 22.4 | 41.0 (37.7-44.3) | 6.3 |
| Healthy Diet Score | (n=1,958) | (n=2,450) | (n=1,705) | |||
| Poor | 92.0 (90.0-94.0) | 29.6 | 82.7 (80.8-84.5) | 32.5 | 69.4 (67.1-71.6) | 9.5 |
| Intermediate | 7.8 (5.8-9.7) | 2.5 | 16.7 (15.0-18.5) | 6.6 | 29.5 (27.4-31.6) | 4.0 |
| Ideal | 0.2 (0.0-0.5) | 0.1 | 0.6 (0.2-0.9) | 0.2 | 1.1 (0.5-1.8) | 0.2 |
| Total Cholesterol | (n=2,301) | (n=2,751) | (n=1,883) | |||
| Poor | 10.9 (9.2-12.7) | 4.1 | 19.6 (17.8-21.4) | 8.6 | 9.3 (8.1-10.6) | 1.4 |
| Intermediate | 28.2 (25.9-30.5) | 10.5 | 44.4 (41.8-47.0) | 19.6 | 54.4 (51.5-57.3) | 8.0 |
| Ideal | 60.8 (58.5-63.1) | 22.6 | 36.0 (33.3-38.7) | 15.9 | 36.2 (33.4-39.1) | 5.3 |
| Blood Pressure | (n=2,271) | (n=2,692) | (n=1,871) | |||
| Poor | 7.6 (6.1-9.1) | 2.8 | 19.4 (17.4-21.5) | 8.3 | 31.7 (28.8-34.5) | 4.5 |
| Intermediate | 41.1 (38.6-43.7) | 15.0 | 51.2 (48.5-53.9) | 21.8 | 52.0 (49.6-54.5) | 7.4 |
| Ideal | 51.3 (48.3-54.3) | 18.7 | 29.4 (27.0-31.8) | 12.5 | 16.3 (13.6-19.1) | 2.3 |
| Fasting Blood Glucose | (n=645) | (n=726) | (n=538) | |||
| Poor | 2.4 (1.2-3.6) | 0.6 | 9.5 (6.4-12.5) | 2.8 | 17.0 (12.8-21.3) | 1.7 |
| Intermediate | 27.0 (23.1-30.9) | 7.2 | 43.9 (37.0-50.8) | 12.9 | 51.8 (46.3-57.2) | 5.2 |
| Ideal | 70.6 (66.8-74.4) | 18.9 | 46.6 (40.3-53.0) | 13.7 | 31.2 (27.0-35.4) | 3.1 |
Percentages may not total 100 due to rounding. Population estimates for may not be equal across individual variables due to varying sample sizes.
Prevalence of Cardiovascular Health Behaviors
The majority of men and women in all age groups reported ideal smoking status; these were the highest prevalence rates among all ideal CV health components. Young non-Hispanic White men exhibited the highest prevalence and older non-Hispanic White men exhibited the lowest prevalence of current smoking (e.g., poor smoking status).Less than half of young men and women exhibited ideal BMI andgreater than two-thirds of middle and older age adults were overweight or obese. Non-Hispanic Black women exhibited the highest prevalence while non-Hispanic White women exhibited the lowest prevalence of intermediate and poor BMI. Young adults, particularly non-Hispanic Black men, most frequently reported ideal physical activity levels but prevalence was lower across higher age groups. The largest proportion of men and women with poor physical activity levels was in the older age group, with the highest prevalence in non-Hispanic White women. Women generally exhibited lower prevalence of ideal physical activity in every age group compared with men.
Ideal Healthy Diet Score was the least prevalent CV health component overall. Greater than 99%of young men were classified as having an intermediate or poor Healthy Diet Score. Zero young men had an ideal Healthy Diet Score.Unlike other health behaviors, prevalence of adultswith ideal Healthy Diet Scoreswashighest in older age compared to young or middle age.
Prevalence of Cardiovascular Health Factors
Young adults exhibited the highest prevalence of ideal levels of total cholesterol, blood pressure, and fasting glucose plasma, particularly among non-Hispanic black women, compared to middle and older age groups. Despite these more favorable estimates, between 13.4% to 48.7% of young men and women had CV health factors in the intermediate or poor range (depending on the CV health component examined).Men had lower prevalence of ideal blood pressure and total cholesterol in young adulthood compared with women. At older age, women had a lower prevalence of ideal blood pressure and total cholesterol compared to men. Thehighest prevalence of poor and intermediate total cholesterol was observed in older non-Hispanicwomen while the highest prevalence of poor and intermediate blood pressure was observed in older non-Hispanic Black women. Ideal levels of fasting blood glucose were the most prevalent of ideal CV health factor across all groups, particularly in young adults where less than one-third (from 13.4-29.4%) were in poor and intermediate ranges. Women generally exhibited higher prevalence of ideal fasting blood glucose compared to men, while the lowest prevalence of ideal fasting blood glucose was observed in non-Hispanic White men.
Number of Ideal Cardiovascular Behaviors and Factors
Less than 1% of all adults exhibited ideal levels of all 7 CV health components. Prevalence estimates for the number of ideal CV health components (0 to 7) by sex and age groups are presented in Figure 1 and additionally stratified by race/ethnic group in Supplemental Figures 1-6. Young men most frequently had 3 to 4 ideal CV health components, middle aged men most commonly had between 2 to 3 ideal CV health components,and older men most commonly exhibited 2 to 3 ideal CV health components. Young women most frequently met ideal criteria for 4 to 5 ideal CV health components, middle aged women most commonly exhibited approximately 3 ideal CV health components, and older women exhibited between 2 to 3 ideal CV health components. The distribution of the number of ideal CV health components according to age was similar when examined across race/ethnic groups, however, young non-Hispanic White women exhibited the highest number of ideal CV health factors (between 4-5 ideal components). No older non-Hispanic Black men exhibited greater than 4 ideal CV health components.
Figure 1.
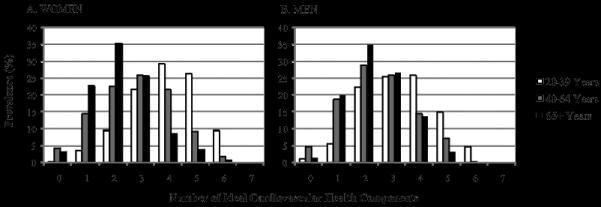
Number of Ideal Cardiovascular Health Components in U.S. Adults by≥ 20 Years by Age and Sex Group: National Health and Nutrition Examination Surveys 2003-2008
Distribution of Cardiovascular Health Components
The distribution of CV health components according to age, sex, and CV health status are displayed in Tables 4 and 5. For intermediate BMI, the lowest 25th percentile of adults are <1.5 units (kg/m2) from being classified as ideal BMI while adults in the lowest 25th percentile of the poor BMI category are <2.0 units from reaching intermediate levels. For adults with intermediate physical activity levels, 75% are >30 minutes/week from reaching ideal levels.Median values for intermediate total cholesterol ranges are <15 mg/dL from ideal levels;older adults with intermediate total cholesterol have ranges closest to ideal levels.Greater than 75% of adults with intermediate blood pressure have elevated systolic blood pressure (≥120 mm/Hg). Young adults with poor blood pressure have higher prevalence of elevated diastolic blood pressure (≥ 80 mm/Hg)compared to middle and older ages. For intermediate fasting blood glucose, the lowest 25th percentile of adults are < 3 mg/dL from reaching ideal levels while the lowest 25th percentile of adultsin the poor categoryare<15 mg/dL from reaching intermediate levels.
Table 4.
Distribution of Cardiovascular Health Behaviors and Factors According to Cardiovascular Health Status in U.S. WOMEN by Age Group: National Health and Nutrition Examination Surveys 2003-2008
| Characteristics | Young Age 20-39 years (n=2,166) | Middle Age 40-64 years (n=3,008) | Older Age 65+ years (n=1,985) |
|---|---|---|---|
| Median (Interquartile Range) | Median (Interquartile Range) | Median (Interquartile Range) | |
| Body Mass Index | (n=2,142) | (n=2,962) | (n=1,908) |
| Poor | 35.3 (32.3-39.6) | 35.0 (32.2-39.2) | 33.5 (31.6-37.0) |
| Intermediate | 27.2 (26.1-28.5) | 27.4 (26.2-28.8) | 27.4 (26.2-28.6) |
| Ideal | 21.9 (20.2-23.5) | 22.5 (21.0-23.9) | 22.7 (21.1-23.9) |
| Physical Activity Level | (n=2,166) | (n=3,008) | (n=1,985) |
| Intermediate | |||
| Vigorous Activity | 9.3 (0.0-30.4) | 0.0 (0.0-21.0) | 0.0 (0.0-0.0) |
| Moderate Activity | 56.1 (28.0-90.0) | 60.0 (28.0-98.1) | 63.1 (35.0-100.0) |
| Total Activity* | 84.1 (60.0-120.0) | 90.0 (56.1-120.0) | 80.0 (40.0-120.0) |
| Ideal | |||
| Vigorous Activity | 126.2 (30.0-294.4) | 105.1 (0.0-240.0) | 0.0 (0.0-159.1) |
| Moderate Activity | 238.3 (120.0-600.0) | 276.9 (154.2-600.0) | 300.0 (210.0-510.0) |
| Total Activity* | 620.0 (332.9-1,200.0) | 600.0 (315.4-1,200.0.0) | 480.0 (287.4-900.0) |
| Total Cholesterol | (n=2,001) | (n=2,851) | (n=1,833) |
| Poor | 258.5 (247.0-274.0) | 260.0 (249.0-280.0) | 261.0 (249.0-281.0) |
| Intermediate | 214.0 (206.0-224.0) | 213.0 (203.0-225.0) | 208.0 (182.0-222.0) |
| Ideal | 168.0 (151.0-182.0) | 178.0 (162.0-189.0) | 177.0 (161.0-189.0) |
| Blood Pressure | (n=1,963) | (n=2,719) | (n=1,776) |
| Poor | |||
| Systolic Blood Pressure (mmHg) | 141.0 (134.0-149.0) | 150.0 (143.0-159.0) | 157.0 (147.0-171.0) |
| Diastolic Blood Pressure (mmHg) | 91.0 (87.0-95.0) | 82.0 (74.0-91.0) | 70.0 (59.0-78.0) |
| Intermediate | |||
| Systolic Blood Pressure (mmHg) | 123.0 (120.0-127.0) | 124.5 (120.0-131.0) | 127.0 (120.0-134.0) |
| Diastolic Blood Pressure (mmHg) | 76.0 (69.0-82.0) | 74.0 (68.0-80.0) | 63.0 (55.0-71.0) |
| Ideal | |||
| Systolic Blood Pressure (mmHg) | 107.0 (101.0-112.0) | 109.0 (103.0-114.0) | 112.0 (106.0-116.0) |
| Diastolic Blood Pressure (mmHg) | 65.0 (60.0-71.0) | 68.0 (62.0-73.0) | 62.0 (55.0-68.0) |
| Fasting Blood Glucose | (n=525) | (n=766) | (n=483) |
| Poor | 145.5 (137.0-248.8) | 172.0 (141.0-234.0) | 146.5 (134.0-174.0) |
| Intermediate | 104.0 (101.0-108.0) | 105.0 (102.0-111.9) | 107.0 (103.0-114.0) |
| Ideal | 90.0 (85.0-94.0) | 92.3 (87.8-96.0) | 93.0 (88.4-96.8) |
Minutes of vigorous activity are equal to 2X minutes of moderate activity when moderate and vigorous activities are combined.
Table 5.
Distribution Cardiovascular Health Behaviors and Factors and Treatment According to Category of Cardiovascular Health in U.S. MEN by Age Group: National Health and Nutrition Examination Surveys 2003-2008
| Characteristics | Young Age 20-39 years (n=2,476) | Middle Age 40-64 years (n=2,900) | Older Age 65+ years (n=1,980) |
|---|---|---|---|
| Median (Interquartile Range) | Median (Interquartile Range) | Median (Interquartile Range) | |
| Body Mass Index | (n=2,445) | (n=2,862) | (n=1,917) |
| Poor | 33.4 (31.4-37.0) | 33.4 (31.4-36.6) | 32.9 (31.3-35.7) |
| Intermediate | 27.4 (26.1-28.5) | 27.5 (26.4-28.8) | 27.4 (26.2-28.7) |
| Ideal | 22.8 (21.1-23.9) | 23.0 (21.5-24.0) | 23.0 (21.4-24.2) |
| Physical Activity Level | (n=2,476) | (n=2,900) | (n=1,980) |
| Intermediate | |||
| Vigorous Activity | 17.5 (4.7-37.4) | 5.8 (0.0-28.0) | 0.0 (0.0-14.0) |
| Moderate Activity | 42.1 (18.7-84.1) | 60.0 (28.0-105.0) | 70.0 (31.5-105.0) |
| Total Activity* | 86.4 (56.1-120.0) | 90.0 (50.0-120.0) | 90 (60.0-120.0) |
| Ideal | |||
| Vigorous Activity | 240.0 (105.1-660) | 168.2 (51.4-420.6) | 70.1 (0.0-300) |
| Moderate Activity | 300.1 (122.7-853.4) | 300.0 (150.0-720.0) | 353.4 (210.3-600.0) |
| Total Activity* | 960.0 (469.6-2,281.5) | 799.5 (385.5-1,860.0) | 654.2 (350.5-1,200.0) |
| Total Cholesterol | (n=2,301) | (n=2,751) | (n=1,883) |
| Poor | 261.0 (248.0-277.0) | 261.0 (249.0-279.0) | 259.0 (248.0-278.0) |
| Intermediate | 214.0 (205.0-225.0) | 210.0 (199.0-224.0) | 195.0 (162.0-214.0) |
| Ideal | 169.0 (150.0-184.0) | 177.0 (162.0-189.0) | 168.0 (150.0-185.0) |
| Blood Pressure | (n=2,271) | (n=2,692) | (n=1,871) |
| Poor | |||
| Systolic Blood Pressure (mmHg) | 141.0 (132.0-145.0) | 147.0 (141.0-155.0) | 152.0 (145.0-163.0) |
| Diastolic Blood Pressure (mmHg) | 91.0 (78.0-95.0) | 88.0 (78.0-94.0) | 74.0 (63.0-82.0) |
| Intermediate | |||
| Systolic Blood Pressure (mmHg) | 125.0 (121.0-129.0) | 124.0 (120.0-131.0) | 127.0 (120.0-133.0) |
| Diastolic Blood Pressure (mmHg) | 74.0 (65.0-81.0) | 76.0 (70.0-82.0) | 65.0 (57.0-73.0) |
| Ideal | |||
| Systolic Blood Pressure (mmHg) | 112.0 (107.0-116.0) | 112.0 (106.0-116.0) | 111.0 (105.0-116.0) |
| Diastolic Blood Pressure (mmHg) | 66.0 (59.0-72.0) | 70.0 (65.0-74.0) | 62.0 (56.0-68.0) |
| Fasting Blood Glucose | (n=645) | (n=726) | (n=538) |
| Poor | 149.0 (132.0-250.0) | 162.5 (134.0-236.0) | 150.0 (135.0-182.0) |
| Intermediate | 104.0 (101.0-108.0) | 107.0 (103.0-113.0) | 109.0 (103.0-115.0) |
| Ideal | 92.0 (88.0-96.0) | 94.0 (90.0-97.0) | 94.0 (91.0-97.0) |
Minutes of vigorous activity are equal to 2X minutes of moderate activity when moderate and vigorous activities are combined.
The proportion of adults who meet goal levels for individual components of the Healthy Diet Score according to poor, intermediate, and ideal Healthy Diet Score is displayed according to age and sex in Figure 2. Across all levels of Healthy Diet Score, sodium and whole grain recommendations are the least commonly achieved goal while the sugar-sweetened beverages goalare most commonly met. A lower proportion of males meet the sodium and fruit and vegetable goal compared to women in all categories, however, men more consistently meet goals for fish intake.
Figure 2.
Prevalence of AttainingIndividualComponents of the Healthy Diet Score in U.S. Adults≥ 20 Years According to Poor, Intermediate, and Ideal Healthy Diet Score byAge and Sex: National Health and Nutrition Examination Surveys 2003-2008
Treatment of Cardiovascular Health Factors
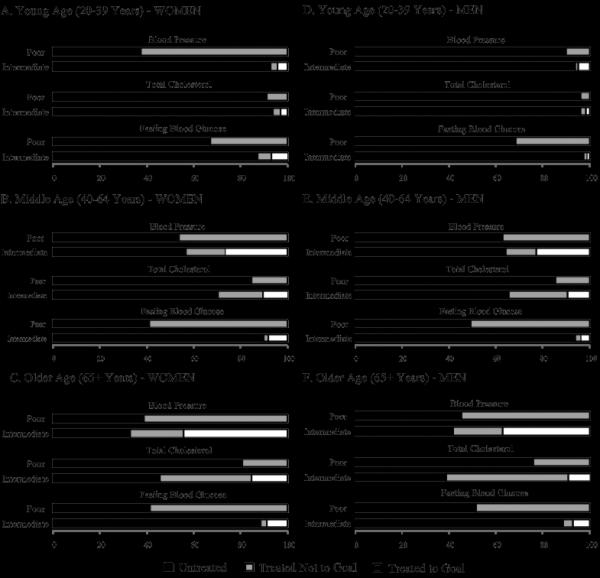
The proportion of adults who are untreated, treated (uncontrolled), and treated (controlled) for individual CV health factors (i.e., blood pressure, total cholesterol, and fasting blood glucose) are displayed according to age and sex in Figure 3. The proportion of adults reporting treatment was generally higher across increasing age groups. The proportion of adults receiving treatment in all age groups was similar between men and women except in young adults with poor blood pressure where treatment was more prevalent in women. Prevalence of cholesterol treatment was the lowest of all CV health factors, particularly in young adults. For fasting blood glucose, men in poor categories were more commonly treated compared to women yet small proportions of adults in intermediate categories reported treatment. Among adults receiving treatment, total cholesterol was the least frequent CV health factor treated to controlled levels.
Figure 3.

Treatment Status for Poor and Intermediate Cardiovascular Health Factors (Blood Pressure, Total Cholesterol, FastingBlood Glucose) in U.S. Adults≥ 20 Years by Age and Sex: National Health and Nutrition Examination Surveys 2003-2008
Discussion
These prevalence estimates of poor, intermediate and ideal levels quantify the current status of the full spectrum of CV health in the U.S. adult population and important subgroups, and provide a critical baseline for monitoring progress towards achievement of the AHA 2020 Strategic Impact Goals. The AHA 2020 Goals are focused on improving the CV health of all Americans by reducing the prevalence of poor levels (through treatment and lifestyle) while increasing the prevalence of ideal levels (with lifestyle change) of CV health behaviors and health factors. The concept is based on the notion proposed by Rose11 that shifting the population mean and distribution of behaviors and factors, even slightly, towards healthier levels can have dramatic benefits in health promotion and disease prevention11-13. Whereas ideal CV health is just that, ideal, this profile is unlikely to be achieved by large proportions of the U.S. population for the foreseeable future. Therefore, clinical and public health programs focused on shifting the entire distribution of CV health towards more favorable levels are needed – particularly among minority populations.
Our data indicate that less than 1% of U.S. adults have ideal levels of all 7 CV health components; prevalence estimates for which are even lower in non-Hispanic Black and Mexican American adults. Although alarming, these estimates are consistent with recent reports from a middle-aged community-based study population where only 0.1% of participants exhibited overall ideal CV health14. Although CV health behaviors and factors are equally weighted in the current AHA definition, it is important to emphasize the direct causal association between adverse CV behaviors (i.e., physical inactivity, poor dietary intake, obesity, smoking) and CV factors (i.e., blood pressure, blood lipids, blood glucose)15-25. Since >90% of U.S. adults report intermediate or poor Healthy Diet Scores, more than two-thirds exhibit intermediate or poor BMI, and less than half report physical activity at goal levels, it is likely these unfavorable CV behaviors are substantially responsible for the coinciding unfavorable state of CV health factors in the U.S. adult population.More importantly, improvements in even a single health behavior, such as improvements achieved through weight loss, can result in improvements in multiple CV health factors. This strong interrelationship between CV health behaviors and factors is an important reminder that individual components of CV health do not exist in a physiologic vacuum;a concept that should be strongly considered when determining specific target populations and strategic interventions for the improvement of CV health from a population approach.
Large proportions of U.S. adults with poor and intermediate CVD health factors (i.e., blood pressure, total cholesterol and blood glucose) are untreated or are receiving treatment but remain uncontrolled. These individualsrepresent a substantial target population whereincreases inprevalence and effectiveness of pharmacological treatment may be an effective approach for improving CV health. Although treated adults cannot be (by definition) categorized as having ideal CV health, substantial improvements in poor and intermediate CV health factors could be achieved with effective treatment. For example, in adults with intermediate blood pressure – a group representing a significant proportion of the U.S. adult population – mean treated SBP was approximately 10 mmHg lower than untreated SBP based on these current estimates indicating reasonable blood pressure control with treatment.It is therefore alarming that the majority of adults with intermediate CV health factors are not receiving any pharmacologic treatment. Considering these findings, a substantial need exists for interventions aimed at increasing the prevalence of treatment in adults with intermediate and poor CV health factors.Furthermore, young adults constitute the greatest proportions of untreated adults with poor and intermediate CV health factors; and indication that significant public health action is needed to increase the prevalence of treatment for CV health factors exists in this age group. Among adults with treated CV health factors, a substantial need also exists for improvements in prevalence of those treated to goal levels. Although lifestyle modification is often a preferred option for initial treatment of unfavorable clinical CV risk factors, adjunct lifestyle and drug treatment at earlier ages could reduceduration of exposure to CV risk and would likely result in lower CVD/CHD event rates in middle and older ages.
Since many past voluntaryand individual-level efforts to improve aspects of CV health in the U.S. population have been unsuccessful –particularly efforts for behavioral change –public health policy changes may be a more effective approach to assistin choosing healthier options. Examples of successful programs include indoor smoking bans26, 27 and state-regulated seat belt laws28, 29.The strikingly low prevalence of ideal Healthy Diet Scores is an indication that this CV health component requires direct targeting efforts. The extensive evidence of a direct causal association between dietary intake and CVD risk13, 30,31 further supports the concept that population-based improvements in dietary quality are a promising strategy to achieve progress towards the AHA 2020 Strategic Impact Goals. Broad population-level dietary strategies have great potential for affecting large numbers of people as well as targeting specific aspects of dietary intake which will directly influence CV risk. Recently proposed strategies include institution of progressive modification towards more favorable levels of nutrients and foods, including sodium, whole grains, and potassium32; nutrients and foods shown in the current study to be the least prevalent components of the AHA's Healthy Diet Score for adults in all age groups to achieve. In 2003, this approach was implemented in the United Kingdom, where independent government agencies responsible for food safety initiated changes in the sodium content of certain foods through direct cooperation with food manufacturers. Such efforts have resulted in an average reduction in sodium intake by 360 mg per day in a 4 year period33. Relatively gradual adjustments to the nutrient content of target items in the food supply could result in changes which are nearly imperceptible to consumers but would have a major impact on CV risk at the population level.If sodium intake could be gradually reduced by 1200 mg daily in the U.S. population, such reductions would have a beneficial influence on major CVD risk factors, especially blood pressure, and are estimated to result in a 50% reduction in the annual number of new cases of CHD, a 48.5% reduction in stroke cases, a 54.5% reduction in myocardial infarction cases, and a 47.8% reduction in annual number of deaths from any cause34.
Our findings should be interpreted in light of some limitations. Although NHANES is a complex, multistage probability sample of the civilian non-institutionalized population of the U.S., these data are cross-sectional and do not represent changes in single individuals over time. The NHANES measures of physical activity, smoking, and dietary consumption examined for the current investigation were self-reported, thus, the possibility of misclassification is possible. Physical activity and dietary questionnaires have been shown to be valuable in indicating conditions where an improvement in these measures would be beneficial and in monitoring population prevalence35.
It is also important to note that only participants with complete data for all 7 components of CV health were included in prevalence estimates for the number of ideal CV health factors. Based on NHANES protocols, fasting blood glucose is selected from a random sub-sample of participants and although proper sampling methodology is used to assure national representation, less than one-third of participants have information for this CV health component. Despite attempts to ensure unbiased sampling, participants with incomplete interview or exam data tended to be younger, more frequently non-Hispanic Black, and exhibited higher systolic blood pressure and total cholesterol; characteristics which may have biased these specific prevalence estimates towards apparent health.
Finally, due to the low prevalence of ideal CV health and many of its individual components, participant data from multiple NHANES exams was combined for this report which raises the possibility that changes in the prevalence rates may have occurred over the 6-year time period examined. While it was necessary to combine multiple cycles of NHANES exams to increase the nationally representative nature of the prevalence estimates and to have sufficient numbers of participants to estimate prevalence of all CV health components, the authors acknowledge that subtle indications of changes over time were observed. Most notably was the significantly higher prevalence of ideal physical activity levels in 2007-2008 compared to earlier exam years. Although assessment of self-reported moderate and vigorous physical activity was performed in all cycles examined, the differences in physical activity levels across cycles may, in part, be due toimprovements to the instruments used in the 2007-2008 NHANES questionnaires.For other CV components, prevalence estimates for Healthy Diet Scores and blood pressureremained stable,prevalence estimates for adults with ideal smoking status slightly increased,andideal levels of BMI, total cholesterol and blood glucose slightly decreased across exams.Thesesubtle changes may indicate worsening trends in obesity, dysglycemia and hypercholesterolemia, but are accompanied by favorable trends in physical activity levels and smoking; influences which when combinedwould likely have very little influence on the prevalence estimates of overall ideal CV health.
In conclusion, the prevalence of ideal levels of CV health behaviors and factors as recommended by the AHA 2020 Strategic Impact Goals is low and inversely associated with age while the corresponding levels of poor and intermediate health are unacceptably high. These estimates represent a starting point for the current prevalence of CV health from which the effectiveness of programs guided by the AHA 2020 Strategic Impact Goals and their influence on population rates of CVD can be monitored and compared. The fact that all components of CV health are modifiable through treatment and lifestyleshould generate optimism for the new strategic directions for the American Heart Association in its research, clinical, public health, and advocacy programs for cardiovascular health promotion and disease prevention.
Supplementary Material
Acknowledgements
The findings and conclusions in this report are those of the authors and do not necessarily represent the official position of the Centers for Disease Control and Prevention.
Funding Sources: This study was supported by grant T32 HL 069771-07 from the NationalHeart, Lung, and Blood Institute (PI: Daviglus).
Footnotes
Conflict of Interest Disclosures: None.
Publisher's Disclaimer: This is a PDF file of an unedited manuscript that has been accepted for publication. As a service to our customers we are providing this early version of the manuscript. The manuscript will undergo copyediting, typesetting, and review of the resulting proof before it is published in its final citable form. Please note that during the production process errors may be discovered which could affect the content, and all legal disclaimers that apply to the journal pertain.
References
- 1.Lloyd-Jones DM, Hong Y, Labarthe D, Mozaffarian D, Appel LJ, Van Horn L, Greenlund K, Daniels S, Nichol G, Tomaselli GF, Arnett DK, Fonarow GC, Ho PM, Lauer MS, Masoudi FA, Robertson RM, Roger V, Schwamm LH, Sorlie P, Yancy CW, Rosamond WD. American Heart Association Strategic Planning Task F, Statistics C. Defining and setting national goals for cardiovascular health promotion and disease reduction: The american heart association's strategic impact goal through 2020 and beyond. Circulation. 2010;121:586–613. doi: 10.1161/CIRCULATIONAHA.109.192703. [DOI] [PubMed] [Google Scholar]
- 2.2008 Physical Activity Guidelines for Americans. US. Department of Health and Human Services; Washington, DC: 2008. [Google Scholar]
- 3.The DASH Diet. Dietary approaches to stop hypertension. Lippincotts Primary Care Practice. 1998;2:536–538. [PubMed] [Google Scholar]
- 4.Folsom AR, Yatsuya H, Nettleton JA, Lutsey PL, Cushman M, Rosamond WD. Community prevalence of ideal cardiovascular health, by the american heart association definition, and relationship with cardiovascular disease incidence. Journal of the American College of Cardiology. 2011;57:1690–1696. doi: 10.1016/j.jacc.2010.11.041. [DOI] [PMC free article] [PubMed] [Google Scholar]
- 5.Centers for Disease Control and Prevention (CDC). National Center for Health Statistics (NCHS) National Health and Nutrition Examination Survey Data. Hyattsville, MD: U.S: [Google Scholar]
- 6.Werko L. End of the road for the diet-heart theory? Scandinavian Cardiovascular Journal. 2008;42:250–255. doi: 10.1080/14017430802064981. [DOI] [PubMed] [Google Scholar]
- 7.Britten P, Marcoe K, Yamini S, Davis C. Development of food intake patterns for the mypyramid food guidance system. Journalof Nutrition Education and Behavior. 2006;38:S78–92. doi: 10.1016/j.jneb.2006.08.007. [DOI] [PubMed] [Google Scholar]
- 8.Executive summary of the third report of the national cholesterol education program (NCEP) expert panel on detection, evaluation, and treatment of high blood cholesterol in adults (Adult Treatment Panel III). Journal of the American Medical Association. 2001;285:2486–2497. doi: 10.1001/jama.285.19.2486. [DOI] [PubMed] [Google Scholar]
- 9.Executive summary: Standards of medical care in diabetes--2011. Diabetes Care. 2011;34(Suppl 1):S4–10. doi: 10.2337/dc11-S004. [DOI] [PMC free article] [PubMed] [Google Scholar]
- 10.Chobanian AV, Bakris GL, Black HR, Cushman WC, Green LA, Izzo JL, Jr., Jones DW, Materson BJ, Oparil S, Wright JT, Jr., Roccella EJ. The seventh report of the joint national committee on prevention, detection, evaluation, and treatment of high blood pressure: The jnc 7 report. Journal of the American Medical Association. 2003;289:2560–2572. doi: 10.1001/jama.289.19.2560. [DOI] [PubMed] [Google Scholar]
- 11.Rose G. The strategy of preventive medicine. Oxford University Press; Oxford: 1992. [Google Scholar]
- 12.Whelton PK, Brancati FL. Hypertension management in populations. Clinical and Experimental Hypertension. 1993;15:1147–1156. doi: 10.3109/10641969309037101. [DOI] [PubMed] [Google Scholar]
- 13.Stamler J. Established major coronary risk factors. In: Marmot M, Elliott P, editors. Coronary heart disease epidemiology: From aetiology to public health. Oxford University Press; New York: 1992. pp. 35–66. [Google Scholar]
- 14.Bambs C, Kip KE, Dinga A, Mulukutla SR, Aiyer AN, Reis SE. Low prevalence of “ideal cardiovascular health” in a community-based population: The heart strategies concentrating on risk evaluation (heart score) study. Circulation. 2011;123:850–857. doi: 10.1161/CIRCULATIONAHA.110.980151. [DOI] [PMC free article] [PubMed] [Google Scholar]
- 15.Physical activity guidelines for americans. Oklahoma Nurse. 2008;53:25. [PubMed] [Google Scholar]
- 16.Knoops KT, de Groot LC, Kromhout D, Perrin AE, Moreiras-Varela O, Menotti A, van Staveren WA. Mediterranean diet, lifestyle factors, and 10-year mortality in elderly european men and women: The hale project. Journal of the American Medical Association. 2004;292:1433–1439. doi: 10.1001/jama.292.12.1433. [DOI] [PubMed] [Google Scholar]
- 17.Hu FB, Manson JE, Stampfer MJ, Colditz G, Liu S, Solomon CG, Willett WC. Diet, lifestyle, and the risk of type 2 diabetes mellitus in women. New England Journal of Medicine. 2001;345:790–797. doi: 10.1056/NEJMoa010492. [DOI] [PubMed] [Google Scholar]
- 18.The 2004 United States Surgeon General's Report: The health consequences of smoking. New South Wales Public Health Bulletin. 2004;15:107. [PubMed] [Google Scholar]
- 19.Stampfer MJ, Hu FB, Manson JE, Rimm EB, Willett WC. Primary prevention of coronary heart disease in women through diet and lifestyle. New England Journal of Medicine. 2000;343:16–22. doi: 10.1056/NEJM200007063430103. [DOI] [PubMed] [Google Scholar]
- 20.Akesson A, Weismayer C, Newby PK, Wolk A. Combined effect of low-risk dietary and lifestyle behaviors in primary prevention of myocardial infarction in women. Archives of Internal Medicine. 2007;167:2122–2127. doi: 10.1001/archinte.167.19.2122. [DOI] [PubMed] [Google Scholar]
- 21.Chiuve SE, McCullough ML, Sacks FM, Rimm EB. Healthy lifestyle factors in the primary prevention of coronary heart disease among men: Benefits among users and nonusers of lipid-lowering and antihypertensive medications. Circulation. 2006;114:160–167. doi: 10.1161/CIRCULATIONAHA.106.621417. [DOI] [PubMed] [Google Scholar]
- 22.Chiuve SE, Rexrode KM, Spiegelman D, Logroscino G, Manson JE, Rimm EB. Primary prevention of stroke by healthy lifestyle.[see comment]. Circulation. 2008;118:947–954. doi: 10.1161/CIRCULATIONAHA.108.781062. [DOI] [PMC free article] [PubMed] [Google Scholar]
- 23.Mozaffarian D, Kamineni A, Carnethon M, Djousse L, Mukamal KJ, Siscovick D. Lifestyle risk factors and new-onset diabetes mellitus in older adults: The cardiovascular health study. Archives of Internal Medicine. 2009;169:798–807. doi: 10.1001/archinternmed.2009.21. [DOI] [PMC free article] [PubMed] [Google Scholar]
- 24.US Department of Health and Human Services and US Department of Agriculture . Dietary Guidelines for Americans. 6th ed. US Government Printing Office; Washington, DC: 2005. 2005. [Google Scholar]
- 25.Clinical Guidelines on the Identification, Evaluation, and Treatment of Overweight and Obesity in Adults. National Heart, Lung, and Blood Institute; Bethesda, MD: 1998. [Google Scholar]
- 26.Samet JM. Smoking bans prevent heart attacks. Circulation. 2006;114:1450–1451. doi: 10.1161/CIRCULATIONAHA.106.649103. [DOI] [PubMed] [Google Scholar]
- 27.Sargent RP, Shepard RM, Glantz SA. Reduced incidence of admissions for myocardial infarction associated with public smoking ban: Before and after study. British Medical Journal. 2004;328:977–980. doi: 10.1136/bmj.38055.715683.55. [DOI] [PMC free article] [PubMed] [Google Scholar]
- 28.Vital signs: Nonfatal, motor vehicle--occupant injuries (2009) and seat belt use (2008) among adults --- United States. MMWR. Morbidity and Mortality Weekly Report. 2011;59:1681–1686. [PubMed] [Google Scholar]
- 29.Dinh-Zarr TB, Sleet DA, Shults RA, Zaza S, Elder RW, Nichols JL, Thompson RS, Sosin DM. Reviews of evidence regarding interventions to increase the use of safety belts. American Journal of Preventive Medicine. 2001;21:48–65. doi: 10.1016/s0749-3797(01)00378-6. [DOI] [PubMed] [Google Scholar]
- 30.Kromhout D, Menotti A, Kesteloot H, Sans S. Prevention of coronary heart disease by diet and lifestyle: Evidence from prospective cross-cultural, cohort, and intervention studies. Circulation. 2002;105:893–898. doi: 10.1161/hc0702.103728. [DOI] [PubMed] [Google Scholar]
- 31.Report of the dietary guidelines advisory committee dietary guidelines for americans, 1995. Nutrition Reviews. 1995;53:376–379. doi: 10.1111/j.1753-4887.1995.tb01493.x. [DOI] [PubMed] [Google Scholar]
- 32.Institute of Medicine . A population-based policy and systems change approach to prevent and control hypertension. National Academics Press; Washington, DC: 2010. [PubMed] [Google Scholar]
- 33.He FJ, MacGregor GA. A comprehensive review on salt and health and current experience of worldwide salt reduction programmes. Journal of Human Hypertension. 2009;23:363–384. doi: 10.1038/jhh.2008.144. [DOI] [PubMed] [Google Scholar]
- 34.Bibbins-Domingo K, Chertow GM, Coxson PG, Moran A, Lightwood JM, Pletcher MJ, Goldman L. Projected effect of dietary salt reductions on future cardiovascular disease. N Engl J Med. 2010;362:590–599. doi: 10.1056/NEJMoa0907355. [DOI] [PMC free article] [PubMed] [Google Scholar]
- 35.Shephard RJ. Limits to the measurement of habitual physical activity by questionnaires. British Journal of Sports Medicine. 2003;37:197–206. 206. doi: 10.1136/bjsm.37.3.197. [DOI] [PMC free article] [PubMed] [Google Scholar]
Associated Data
This section collects any data citations, data availability statements, or supplementary materials included in this article.