Abstract
Blood samples are extensively used for the molecular diagnosis of many hematological diseases. The daily practice in a clinical laboratory of molecular diagnosis in hematology involves using a variety of techniques, based on the amplification of nucleic acids. Current methods for polymerase chain reaction (PCR) use purified genomic DNA, mostly isolated from total peripheral blood cells or white blood cells (WBC). In this paper we describe a real-time fluorescence resonance energy transfer-based method for genotyping directly from blood cells. Our strategy is based on an initial isolation of the WBCs, allowing the removal of PCR inhibitors, such as the heme group, present in the erythrocytes. Once the erythrocytes have been lysed, in the LightCycler® 2.0 Instrument, we perform a real-time PCR followed by a melting curve analysis for different genes (Factors 2, 5, 12, MTHFR, and HFE). After testing 34 samples comparing the real-time crossing point (CP) values between WBC (5×10⁶ WBC/mL) and purified DNA (20 ng/μL), the results for F5 Leiden were as follows: CP mean value for WBC was 29.26±0.566 versus purified DNA 24.79±0.56. Thus, when PCR was performed from WBC (5×10⁶ WBC/mL) instead of DNA (20 ng/μL), we observed a delay of about 4 cycles. These small differences in CP values were similar for all genes tested and did not significantly affect the subsequent analysis by melting curves. In both cases the fluorescence values were high enough, allowing a robust genotyping of all these genes without a previous DNA purification/extraction.
Keywords: real-time PCR, LightCycler® 2.0 Instrument, melting peak, FRET, white blood cells, lysis, erythrocytes
Introduction
The procedures used for DNA purification from blood cells in a laboratory of molecular biology in hematology tend to be tedious, consuming both financial and temporal resources. With this in mind, several authors have already developed new methods to avoid or simplify the extraction and purification step of the nucleic acids.1,2 To date, different experimental approaches have described the possibility of performing polymerase chain reaction (PCR) or real-time PCR directly from cells.3–10 In the case of blood samples, these methods were mostly aimed at blocking the PCR inhibitory capacity of some blood components, such as the heme group of erythrocytes, or ethylenediaminetetraacetic acid (EDTA).11 In this paper we describe our strategy based on an initial lysis of the erythrocytes. This strategy was already suggested by de Vries et al12 for conventional PCR. The isolation of the white blood cells (WBCs) allows the removal of PCR inhibitors, such as the heme group. After the lysis procedure we collected the WBCs in phosphate buffer solution (PBS) and introduced them directly into the real-time PCR mix. For DNA releasing from the cells, we took advantage of the strategy already described in the literature, based on the application of successive heat–cool cycles, already included in the PCR cycles.3 Thus, the heat–cool cycles allow the release of DNA from the cells (Figure 1). In order to determine the robustness of the method in this study we included different polymorphisms frequently found in patients suffering from thrombosis or hereditary hemochromatosis: Factor 2 (G20210A); Factor 5 Leiden (G1691A); Factor 12 (C46T); MTHFR (C677T); and HFE (H63D/C282Y). The PCR conditions established in our protocol efficiently amplify the different genes studied without the need for a previous DNA extraction. Melting curve studies were as robust as those obtained from purified DNA. This procedure gives a rapid way of genotyping directly by PCR from a sample without extracting DNA, thereby reducing time and workload significantly.
Figure 1.
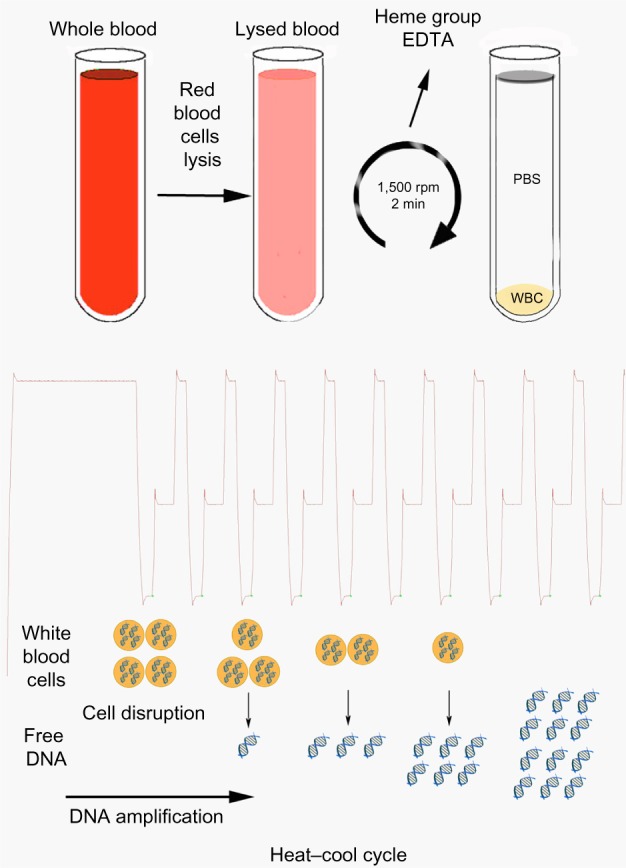
Protocol scheme for real-time PCR without DNA extraction.
Notes: The protocol is based on an initial lysis stage of the red blood cells that remove PCR inhibitors such as the heme group from the PCR mix. After isolation of the WBCs, the different heat–cool cycles of the PCR extract the DNA from the cells, allowing the amplification of several genes.
Abbreviations: PCR, polymerase chain reaction; WBCs, white blood cells; EDTA, ethylenediaminetetraacetic acid; PBS, phosphate buffered saline; min, minutes.
Material and methods
Patients, blood collection and white blood cell isolation
The study included peripheral blood from 34 patients and was approved by the Ethics Committee of the Balearic Islands (CEIC-IB). Peripheral blood was collected into tubes containing EDTA. Among the samples, we included a mixture of mutant alleles for F5 (G1691A, n=4), F2 (G20210A, n=7), F12 (C46T, n=12), MTHFR (C677T, n=2) and HFE (H63D, n=2/C282Y, n=3). A milliliter of peripheral blood was obtained from the EDTA tubes. Red blood cells (RBCs) were lysed for 10 minutes in 9 mL of lysis buffer (8.22 g ammonium chloride [NH4Cl], 1 g sodium bicarbonate [NaHCO3] and 0.037 g EDTA dissolved in 1 L ddH2O). We then washed and resuspended WBCs in 200 μL of PBS (1X) (Table 1). In order to standardize the samples for the real-time PCR reaction, cells were counted in a Scepter™ 2.0 Automated Cell Counter (Merck Millipore, Billerica, MA, USA) and adjusted to 5×10⁶ cells/mL. Genomic DNA from the same samples was extracted from 200 μL of peripheral blood using the QIAamp DNA Blood Mini Kit following the manufacturer’s instructions (QIAGEN, Venlo, the Netherlands). Once isolated, the DNA was dissolved in 50 μL of dilution buffer and quantified in an Ultrospec 4300 pro spectrophotometer (Amersham biosciences, Piscataway, NJ, USA). The DNA concentration was adjusted to 20 ng/μL. Two microliters of the WBCs (5×10⁶ cells/mL) or DNA (20 ng/μL) preparation was added to a LightCycler® 2.0 Instrument capillary (Roche Diagnostics Corporation, Indianapolis, IN, USA) containing 8 μL of the PCR reaction mixture (Tables 2 and 3). Samples were blinded and all of them were a mixture of normal, heterozygous, or homozygous cases for all the mutations analyzed.
Table 1.
Primers and probes
| F5 primers | Fw 5′-TGCCCAGTGCTTAACAAGACCA-3′ |
| Rv 5′-CTTGAAGGAAATGCCCCATTA-3′ | |
| F5 probes | 5′-GGCGAGGAATACAGGTAT-3′-FLU |
| 5′-LCRed705-TGTCCTTGAAGTAACCTTTCAGAAATTCTG-3′ | |
| F2 primers | Fw 5′-CCGCTGGTATCAAATGGG-3′ |
| Rv 5′-CCAGTAGTATTACTGGCTCTTCCTG-3′ | |
| F2 probes | 5′-CTCAGCGAGCCTCAATG′-3-FLU PT-610 |
| 5′-LC-Red610-TCCCAGTGCTATTCATGGGC-3′ | |
| F12 primers | Fw 5′-TCCCTTCTTCTGCTTCCAGT-3′ |
| Rv 5′-ATGGCTCATGGCTGTGATAG-3′ | |
| F12 probes | 5′-GGACCAACGGACGGACGCCA-3′-FLU |
| 5′-LC-Red640-AGGGCTCTGCTGCTCCTGGGGTTCCTG-3′ | |
| HFE H63D primers | Fw 5′-GCTCTGTCTCCAGGTTCACACTC-3′ |
| Rv 5′-CCCTCTCCACATACCCTTGC-3′ | |
| HFE H63D probes | 5′-CGGCGACTCTCATCATCATAGAACACGAACA-3′-FLU |
| 5′-LC-Red705-CTGGTCATCCACGTAGCCCAAAGCTTCAA-3′ | |
| HFE C282Y primers | Fw 5′-TGGCAAGGGTAAACAGATCC-3′ |
| Rv 5′-CTCAGGCACTCCTCTCAACC-3′ | |
| HFE C282Y probes | 5′-AGATATACGTGCCAGGTGGAGC-3′-FLU |
| 5′-LC-Red640-CCCAGGCCTGGATCAGCCCCTCATTGTGATCTGGG-3′ | |
| MTHFR primers | Fw 5′-AGGCCAGCCTCTCCTGACTG-3′ |
| Rv 5′-AGGACGGTGCGGTGAGAGTG-3′ | |
| MTHFR probes | 5′-TGACCTGAAGCACTTGAAGGAGAAGGTGTC-3′-FLU |
| 5′-LC-Red640-CGGGAGCCGATTTCATCA-3′ |
Abbreviations: Fw, forward; Rv, reverse.
Table 2.
Reaction mix used for RT-PCR procedure
| Reaction mix | F5 (single) | F5/F2/F12 (triplex) | F5/F2 (duplex) |
|---|---|---|---|
| Mix hybridization probes (Plus) 5× | 4 μL | 4 μL | 4 μL |
| H20 | 8 μL | 1 μL | 2 μL |
| F5 Fw (4 μM) | 1 μL | 0.2 μL | 1 μL |
| F5 Rv (4 μM) | 3 μL | 3 μL | 3 μL |
| F5-Flu (4 μM) | 1 μL | 1.2 μL | 1 μL |
| F5-705 (4 μM) | 1 μL | 1.2 μL | 1 μL |
| F2 Fw (4 μM) | – | 0.8 μL | 1 μL |
| F2 Rv (4 μM) | – | 1.6 μL | 3 μL |
| F2-Flu (4 μM) | – | 0.6 μL | 1 μL |
| F2-610 (4 μM) | – | 0.6 μL | 1 μL |
| F12 Fw (4 μM) | – | 0.4 μL | |
| F12 Rv (4 μM) | – | 2.2 μL | |
| F12-Flu (4 μM) | – | 0.6 μL | |
| F12-640 (4 μM) | – | 0.6 μL | |
| WBCs (5×10⁶ WBC/mL) | 2 μL | 2 μL | 2 μL |
Abbreviations: WBCs, white blood cells; RT-PCR, real-time polymerase chain reaction; Fw, forward; Rv, reverse.
Table 3.
Reaction mix used for RT-PCR procedure
| Reaction mix | MTHFR (single) | HFE (H63D) (single) | HFE (C282Y) (single) |
|---|---|---|---|
| Mix hybridization probes (no Plus) 10× | 2 μL | 2 μL | 2 μL |
| H2O | 8.4 μL | 0.2 μL | 8.4 μL |
| MgCl2 | 1.6 μL | 0.8 μL | 1.6 μL |
| MTHFR Fw (4 μM) | 1 μL | – | – |
| MTHFR Rv (4 μM) | 3 μL | – | – |
| MTHFR-Flu (4 μM) | 1 μL | – | – |
| MTHFR-640 (4 μM) | 1 μL | – | – |
| H63D Fw (4 μM) | – | 1 μL | – |
| H63D Rv (4 μM) | – | 3 μL | – |
| H63D-Flu (4 μM) | – | 1 μL | – |
| H63D-610 (4 μM) | – | 1 μL | – |
| F12 Fw (4 μM) | – | – | 1 μL |
| F12 Rv (4 μM) | – | – | 3 μL |
| F12-Flu (4 μM) | – | – | 1 μL |
| F12-640 (4 μM) | – | – | 1 μL |
| WBCs (5×10⁶ WBC/mL) | 2 μL | 2 μL | 2 μL |
Abbreviations: WBCs, white blood cells; RT-PCR, real-time polymerase chain reaction.
Real-time PCR and melting analysis
The method was carried out on a LightCycler® 2.0 Instrument and consisted of a first step amplification by real-time PCR of the genes to be genotyped. For each gene we used a primer pair together with the corresponding fluorescence resonance energy transfer probes (FRET). Primers, sensor, and anchor probe sequences, as well as reaction mixtures and PCR conditions used in this paper, are described in Tables 1–4. The primer/probe synthesis was performed by TIB MOLBIOL (Berlin, Germany). The anchor probe was located in the vicinity of the mutation and was labeled at its 5′ end with Red 610 for F2, Red 640 for F12, HFE (C282Y/H63D) and MTHFR (C667T), or Red 705 for F5 detection.13–16 An adjacent sensor probe was placed over the mutation (1–5 nucleotides away from the anchor probe) and was labeled with fluorescein at its 3′ end. Immediately after the PCR reaction, melting peak analysis was performed on the same LightCycler® 2.0 Instrument. The software provided with this instrument (LightCycler® 4.01) gives the melting temperature (Tm) of the sensor probes. The detection of the nucleotide variation of the gene is based on the fact that the base pair mismatch between the sensor/anchor probe and template causes a decrease in Tm that can easily be detected by a melting peak analysis in the LightCycler® 2.0. The polymerases used in the PCRs were the LightCycler® FastStart DNA MasterPLUS HybProbe (Roche Diagnostics Corporation), and the MyTaq™ HS Mix (Bioline, Taunton, MA, USA).
Table 4.
Real-time PCR + melting conditions
| Gene
|
F2/F5/12 (single, dúplex or triplex)
|
||||||
|---|---|---|---|---|---|---|---|
| Cycles | Temperature (°C) | Time (seconds) | Ramp rate (°C/s) | ||||
| 1 | 95 | 180 | 20 | ||||
| 45–50 | 95 | 15 | 20 | ||||
| 55 | 15 | 20 | |||||
| 72 | 30 | 20 | |||||
| Melting | 95 | 60 | 20 | ||||
| 55 | 30 | 20 | |||||
| 45 | 30 | 20 | |||||
| 40 | 120 | 20 | |||||
| 85 | 0 | 0.1 | |||||
| Cool | 40 | 30 | |||||
|
Gene
|
MTHFR
|
H63D
|
C282Y
|
||||
| Cycles | Temp (°C) | Time (seconds) | Temp (°C) | Time (seconds) | Temp (°C) | Time (seconds) | Ramp rate (°C/s) |
|
| |||||||
| 1 | 95 | 180 | 95 | 180 | 95 | 180 | 20 |
| 45–50 | 95 | 15 | 95 | 15 | 95 | 15 | 20 |
| 53 | 15 | 60 | 15 | 55 | 15 | 20 | |
| 72 | 30 | 72 | 30 | 72 | 30 | 20 | |
| Melting | 95 | 2 | 95 | 0 | 95 | 5 | 20 |
| 40 | 20 | 45 | 0 | 45 | 15 | 20 | |
| 80 | 0 | 85 | 0 | 85 | 0 | 0.1 | |
| Cool | 40 | 40 | 40 | 40 | 40 | 40 | |
Abbreviation: PCR, polymerase chain reaction.
Optimization procedure of the real-time PCR
For the optimization procedure, and based on the evidence describing the releasing of nuclear DNA associated with heat– cool cycles,3 we tested different times of denaturation/annealing for the PCR protocol. Finally, for all the genes described in this manuscript we used 15 seconds for denaturation and 15 seconds for annealing steps. The extension time depended on the size of the amplicon for each gene. We used positive and negative controls already validated by conventional techniques (see the section Technique validation). With the aim of maximizing the sensitivity of the PCR, we used asymmetric primer concentration, which prevented the PCR signal from reaching saturation. Using an excessive amount of amplification primers and allowing the preferential synthesis of the reverse strand complementary to the hybridization probes caused a significant increase of the fluorescence intensity on the PCR FRET-based reaction, greatly improving the sensitivity during the melting analysis.16–18 The detection of the different polymorphisms, as well as the efficiency gain with asymmetric concentration of primers, was assayed on a single, duplex, or even triplex real-time PCR depending on the genes.
Technique validation
In order to validate this protocol with a reference method, we carried out a sequence analysis in ABI 3100 (BigDye® Terminator v3.1; Life Technologies, Carlsbad, CA, USA) (data not shown) for all the genes described in the manuscript. Moreover, all the samples used to set up this protocol were previously genotyped, from purified DNA, with an already-validated real-time PCR method.13–16,19
Data analysis
The results from the crossing point (CP) included in this paper are expressed as the mean ± standard error of the mean of at least ten independent experiments.
Results
Blood lysis allows real-time PCR and melting curve analysis without DNA purification
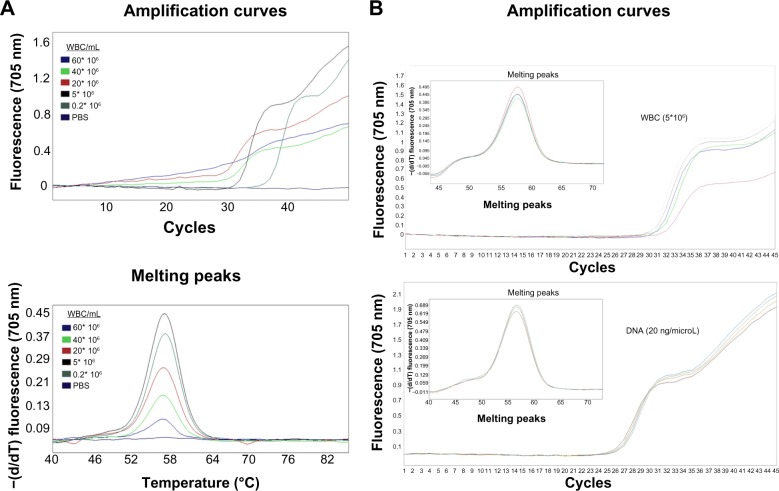
We performed a real-time PCR for F5 Leiden with a different concentration range of WBCs (60×106–0.2×10⁶ WBC/mL). Amplification and melting curves in Figure 2A show that the most suitable concentration of WBCs for the PCR and melting analysis was between 0.2–5×10⁶ WBC/mL. To compare the sensitivity of the DNA extraction-free method in front of purified DNA (20 ng/μL), we chose the concentration of 5×10⁶ WBC/mL. After testing the 34 samples, the CP values for the WBC versus purified DNA results were as follows: CP mean value for WBC was 29.26±0.566 versus purified DNA 24.79±0.56 (Figure 2B). Thus, when PCR was performed from WBC (5×10⁶ WBC/mL) instead of purified DNA (20 ng/μL), we only observed a delay of about 4 cycles. Finally, we calculated the DNA concentrations that could be isolated from 5×10⁶ WBC. For all the samples we obtained a DNA concentration of approximately 10 ng/μL. These small differences in CP values did not affect the analysis of melting curves between the two types of samples (Figure 2B). In both cases the fluorescence values were high enough, allowing a robust genotyping of F5 Leiden. These differences were similar for all the genes tested (data not shown).
Figure 2.
Real-time PCR for F5 Leiden, DNA extraction free method versus purified DNA method.
Notes: (A) Concentration range of WBCs (60×106–0.2×10⁶ WBC/mL) show that the most suitable concentration of WBC for PCR and melting analysis purposes was located between 0.2–5×10⁶ WBC/mL. (B) Real-time CP values for the WBC versus purified DNA: CP mean value for WBC was 29.26±0.566 versus purified DNA 24.79±0.56. PCR from WBC versus purified DNA show a delay of about four cycles in CP.
Abbreviations: PCR, polymerase chain reaction; WBCs, white blood cells; CP, crossing point; PBS, phosphate buffered saline; −(d/dT), negative derivative of fluorescence over temperature.
Primer asymmetry increases the efficiency of the melting curves
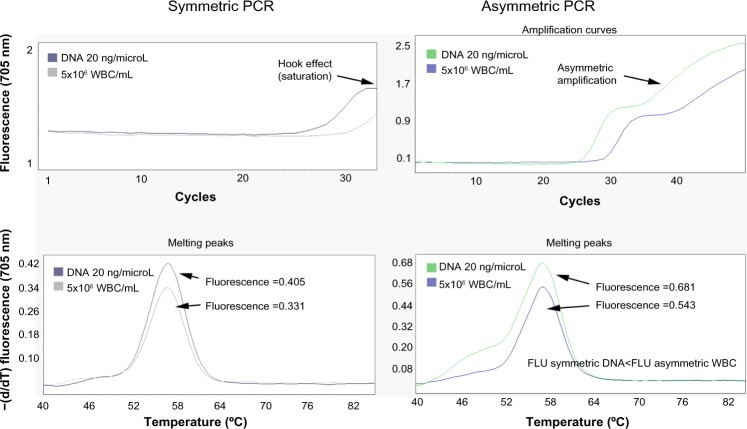
The performance of a real-time PCR from WBC versus purified DNA involves a small loss of fluorescence in the melting curves. An optimization protocol based on the use of asymmetric real-time PCR was performed in order to increase the efficiency of the PCR and thus the melting curves. As described in previous publications,15–18 an increased asymmetric ratio in the concentration of each primer pair included in the real-time PCR reaction mix improved the fluorescence levels of the melting analysis without significantly decreasing the CP. This improvement in sensitivity is associated with the correction of a moderate “hook effect”, a sign of a very efficient PCR. In Figure 3, we clearly show how the fluorescence levels of the melting curve obtained from 5×10⁶ WBC/mL when using asymmetric concentration of primers in the PCR mix improves that obtained from a real-time PCR, in which previously purified DNA and symmetric concentration of primers are used. Moreover, primer asymmetry allows us to increase the number of the PCR cycles as the reaction is not saturated.
Figure 3.
Asymmetric DNA extraction free method versus symmetric purified DNA real-time PCR.
Notes: We show as the fluorescence levels of the melting curve obtained from 5×10⁶ WBC/mL when we use asymmetric concentration of primers, improves that obtained from a real-time PCR in which previous purified DNA and symmetric concentration of primers were used.
Abbreviations: PCR, polymerase chain reaction; WBCs, white blood cells; FLU, fluorescence; −(d/dT), negative derivative of fluorescence over temperature.
Full results concordance between the free extraction versus purified DNA methods
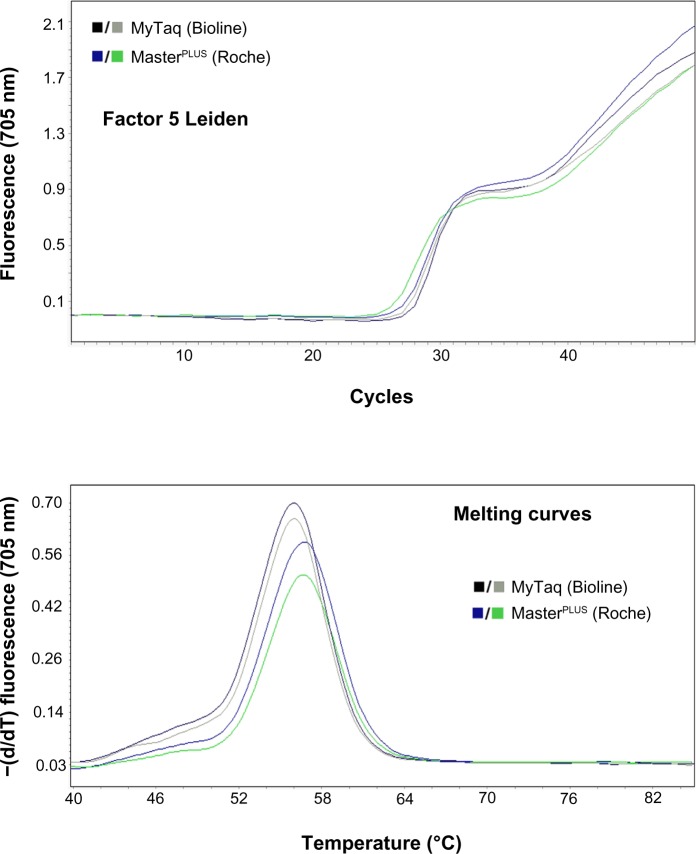
When the 34 samples, previously genotyped by sequentiation or conventional techniques (single real-time PCR and purified DNA), for F5, F2, F12, MTHFR and HFE were tested with our DNA extraction free protocol, there was a 100% match in the mutation analysis (Figure 4). Moreover, in order to demonstrate the robustness of the real-time PCR from WBCs, we performed a single PCR for F5 (one pair of primers/probes), duplex PCR for F5 and F2 (two pairs of primers/probes) and triplex PCR F5, F2 and F12 (three pairs of primers/probes) on all samples. The results for single or multiplex PCRs were equivalent to those obtained from the same PCRs performed with purified DNA (data not shown).16 Results were clear, rapid, and reliable, allowing a significant time saving compared with other more lengthy procedures. Finally, we tested the possibility of using alternative polymerases to the LightCycler® FastStart DNA MasterPLUS HybProbe to confirm the reliability of the method for multiple polymerases. The MyTaq™ HS Mix was shown for F5 to be even more effective than the LightCycler® polymerase when equivalent denaturation times were applied (Figure 5).
Figure 4.
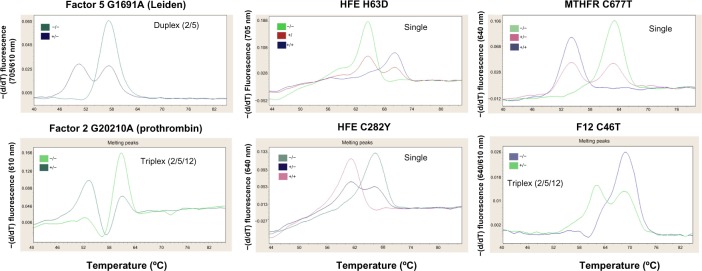
Genotyping of F2, F5, F12, MTHFR, and HFE by melting curves.
Notes: We compared the melting curves for several genes. The protocol without DNA extraction proved to be equivalent, in terms of efficiency, when performed in both single and/or multiplex (duplex or triplex) reactions.
Abbreviations: −(d/dT), negative derivative of fluorescence over temperature; −/−, normal; +/−, heterozygous; +/+, homozygous.
Figure 5.
Comparison of different DNA polymerases with the free DNA extraction method.
Notes: We tested alternative polymerases to the MasterPLUS (LightCycler® FastStart DNA MasterPLUS HybProbe; Roche Diagnostics Corporation, Indianapolis, IN, USA) to confirm the reliability of the method. MyTaq (MyTaq™ HS Mix; Bioline, Taunton, MA, USA) proved even more effective for F5 than the LightCycler® polymerase when equivalent denaturation times were applied.
Abbreviation: −(d/dT), negative derivative of fluorescence over temperature.
Sample conservation
In order to check how the WBCs can be conserved, once resuspended in PBS, we froze different samples at −20°C for one week. Then, we thawed the samples and performed a real-time PCR. Comparative studies between fresh or frozen WBCs showed that results were equivalent (data not shown).
Discussion
Detection for hemochromatosis and/or hereditary thrombophilia is among the most frequently performed molecular diagnostic tests in the hematology laboratory. The number of samples received far surpasses other routine molecular studies for diagnosis. Currently, one of the most widely used techniques for genotyping F5, F2, F12, MTHFR, or HFE polymorphisms is the real-time PCR, followed by a study of melting curves.15,20 Normally, and due to the huge number of samples received, the extraction and purification of DNA prior to the genotyping of these genes is often a limiting step for the fast implementation of these techniques. At present, the use of automated extractors or DNA purification columns are among the most implemented protocols with such a purpose. However, all these protocols take up temporal and/or financial resources. With this in mind, we tested the possibility of performing a real-time PCR and melting analysis, without the need for a previous DNA purification protocol. Different components of blood, such as the heme group, are likely to inhibit PCR.11 Thus, we propose executing an initial RBC lysis from the peripheral blood sample, to perform a real-time PCR directly from the WBCs. For DNA extraction, different publications have already suggested that heat–cool cycles, already included within the PCR process, are able to release the nuclear DNA3. Thus, in this context, the possibility of amplifying the factor 5 Leiden without the need for the prior extraction of the DNA has already been described.21 We show the possibility of performing the genotyping directly from WBCs for F2, F5, F12, MTHFR, and HFE. Thus, under asymmetric concentrations of primers, both the amplification results and fluorescence levels of the melting curves are as robust as those obtained from purified DNA samples (20 ng/μL). Furthermore, an interesting finding of this study is that the technique appears to be effective within a wide range of the concentration of WBCs. Amplification curves from WBCs (5×10⁶ WBC/mL) only suffer a small delay of 4 cycles in the CP value versus purified DNA (20 ng/μL). This delay does not affect the subsequent analysis by melting curves. However, in order to compensate for this delay, we apply asymmetric concentrations of primers whereby the phase of saturation of the real-time PCR is suppressed, increasing the fluorescence levels. Moreover, we show that the results are good enough to withstand the genotyping of several genes in single, duplex, or triplex real-time PCR reactions, demonstrating the robustness of the results obtained. Finally, since the protocol is entirely tested with LightCycler® FastStart DNA MasterPLUS HybProbe polymerases, we tested another polymerase (MyTaq™ HS Mix) for the amplification of F5. The results showed no significant differences (Figure 5).
The present protocol represents a rapid DNA extraction-free method for the genotyping, based on melting curves, of different genes associated with thrombotic events and hemochromatosis. The protocol obviates the DNA purification stage, thereby saving time and resources. Furthermore, since the manipulation performed on the sample is minimal, we may decrease the risk of contamination. Having the results of a variety of genes, we assert that this protocol will be suitable for the genotyping of almost any inherited polymorphism. The next step is to possibly apply this method in the genotyping of acquired mutations, such as the Jak2 V617F in myeloproliferative syndromes.15 Further validation must be performed to check if in the case of acquired mutations, the power of the method will be able to equalize the sensitivity obtained from purified DNA samples.
Acknowledgments
In memoriam of Jose Fco Martinez Rodriguez for his constant support, advice and encouragement, without which, this work would not have been possible.
Author contributions
All authors contributed toward data analysis, drafting and revising the paper and agree to be accountable for all aspects of the work.
Disclosure
Antoni Nicolàs belongs to ECOGEN who supplied the authors with the polymerase MyTaq™ HS Mix (Bioline). The authors report no other conflicts of interest in this work.
References
- 1.Komatsu H, Tsunoda T, Inui A, et al. Successful use of saliva without DNA extraction for detection of macrolide-resistant Mycoplasma pneumoniae DNA in children using LNA probe-based real-time PCR. J Infect Chemother. 2013;19(6):1087–1092. doi: 10.1007/s10156-013-0630-9. [DOI] [PubMed] [Google Scholar]
- 2.Morata P, Queipo-Ortuño MI, de Dios Colmenero J. Strategy for optimizing DNA amplification in a peripheral blood PCR assay used for diagnosis of human brucellosis. J Clin Microbiol. 1998;36(9):2443–2446. doi: 10.1128/jcm.36.9.2443-2446.1998. [DOI] [PMC free article] [PubMed] [Google Scholar]
- 3.Mercier B, Gaucher C, Feugeas O, Mazurier C. Direct PCR from whole blood, without DNA extraction. Nucleic Acids Res. 1990;18(19):5908. doi: 10.1093/nar/18.19.5908. [DOI] [PMC free article] [PubMed] [Google Scholar]
- 4.Balnaves ME, Nasioulas S, Dahl HH, Forrest S. Direct PCR from CVS and blood lysates for detection of cystic fibrosis and Duchenne muscular dystrophy deletions. Nucleic Acids Res. 1991;19(5):1155. doi: 10.1093/nar/19.5.1155. [DOI] [PMC free article] [PubMed] [Google Scholar]
- 5.McHale RH, Stapleton PM, Bergquist PL. Rapid preparation of blood and tissue samples for polymerase chain reaction. Biotechniques. 1991;10(1):20–22. [PubMed] [Google Scholar]
- 6.Lewin HA, Stewart-Haynes JA. A simple method for DNA extraction from leukocytes for use in PCR. Biotechniques. 1992;13(4):522–524. [PubMed] [Google Scholar]
- 7.Nordvåg BY, Husby G, Raafat el-Gewely M. Direct PCR of washed blood cells. Biotechniques. 1992;12(4):490–493. [PubMed] [Google Scholar]
- 8.Castley A, Higgins M, Ivey J, Mamotte C, Sayer DC, Christiansen FT. Clinical applications of whole-blood PCR with real-time instrumentation. Clin Chem. 2005;51(11):2025–2030. doi: 10.1373/clinchem.2005.055327. [DOI] [PubMed] [Google Scholar]
- 9.Pandori MW, Lei J, Wong EH, Klausner J, Liska S. Real-Time PCR for detection of herpes simplex virus without nucleic acid extraction. BMC Infect Dis. 2006;6:104. doi: 10.1186/1471-2334-6-104. [DOI] [PMC free article] [PubMed] [Google Scholar]
- 10.Fedick A, Su J, Jalas C, Treff NR. High-throughput real-time PCR-based genotyping without DNA purification. BMC Res Notes. 2012;5:573. doi: 10.1186/1756-0500-5-573. [DOI] [PMC free article] [PubMed] [Google Scholar]
- 11.Al-Soud WA, Rådström P. Purification and characterization of PCR-inhibitory components in blood cells. J Clin Microbiol. 2001;39(2):485–493. doi: 10.1128/JCM.39.2.485-493.2001. [DOI] [PMC free article] [PubMed] [Google Scholar]
- 12.de Vries JE, Wijnen PA, Hamulyák K, van Dieijen-Visser MP, Bekers O. PCR on cell lysates obtained from whole blood circumvents DNA isolation. Clin Chem. 2001;47(9):1701–1702. [PubMed] [Google Scholar]
- 13.van den Bergh FA, van Oeveren-Dybicz AM, Bon MA. Rapid single-tube genotyping of the factor V Leiden and prothrombin mutations by real-time PCR using dual-color detection. Clin Chem. 2000;46(8 Pt 1):1191–1195. [PubMed] [Google Scholar]
- 14.Tirado I, Fontcuberta J, Soria JM. Rapid detection of the 46C –> T polymorphism in the factor XII gene, a novel genetic risk factor for thrombosis, by melting peak analysis using fluorescence hybridization probes. Genet Test. 2003;7(4):295–301. doi: 10.1089/109065703322783644. [DOI] [PubMed] [Google Scholar]
- 15.Martínez-Serra J, Maffiotte E, Gutierrez A, Durán MA, Amat JC, Besalduch J. New real-time PCR-based method for the joint genotyping of JAK2 (V617F) with inherited thrombophilic F5 and F2 mutations. Clin Chim Acta. 2009;410(1–2):59–63. doi: 10.1016/j.cca.2009.09.022. [DOI] [PubMed] [Google Scholar]
- 16.Martínez-Serra J, Gutierrez A, Amat JC, et al. Rapid triplex asymmetric real-time PCR hybridization probe assay for the joint genotyping of F2, F5 and F12. Clin Biochem. 2009;42(12):1317–1324. doi: 10.1016/j.clinbiochem.2009.04.013. [DOI] [PubMed] [Google Scholar]
- 17.Barratt K, Mackay JF. Improving real-time PCR genotyping assays by asymmetric amplification. J Clin Microbiol. 2002;40(4):1571–1572. doi: 10.1128/JCM.40.4.1571-1572.2002. [DOI] [PMC free article] [PubMed] [Google Scholar]
- 18.Szilvási A, Andrikovics H, Kalmár L, Bors A, Tordai A. Asymmetric PCR increases efficiency of melting peak analysis on the LightCycler. Clin Biochem. 2005;38(8):727–730. doi: 10.1016/j.clinbiochem.2005.04.015. [DOI] [PubMed] [Google Scholar]
- 19.Bollhalder M, Mura C, Landt O, Maly FE. LightCycler PCR assay for simultaneous detection of the H63D and S65C mutations in the HFE hemochromatosis gene based on opposite melting temperature shifts. Clin Chem. 1999;45(12):2275–2278. [PubMed] [Google Scholar]
- 20.Seipp MT, Pattison D, Durtschi JD, Jama M, Voelkerding KV, Wittwer CT. Quadruplex genotyping of F5, F2, and MTHFR variants in a single closed tube by high-resolution amplicon melting. Clin Chem. 2008;54(1):108–115. doi: 10.1373/clinchem.2007.097121. [DOI] [PubMed] [Google Scholar]
- 21.Pernod G, Mossuz P, Polack B. Optimized factor V gene mutation detection using buffy-coat direct PCR. Biotechniques. 1997;22(5):837–840. doi: 10.2144/97225bm10. [DOI] [PubMed] [Google Scholar]


