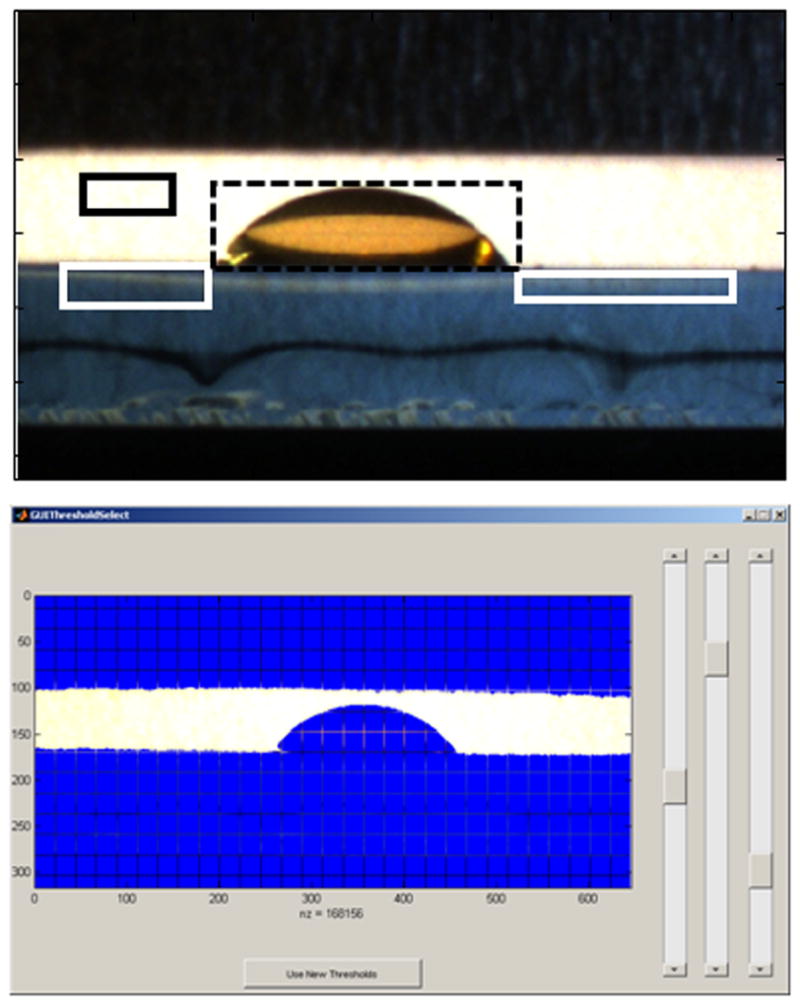
Figure 3.

A GUI-based drop profile program was custom written for these experiments. The user is first requested to use the first image of the image sequence (top panel) to define the background (black solid square), the left and right slide surface (white solid squares) and the droplet (black dashed square). Then, the user is requested to adjust the thresholds (bottom panel) using the three sliding panels. These steps define the thresholds used to define the substrate surface or baseline, separate the background from the slide and separate the droplet from the background. The drop is then fitted with a high order polynomial to measure the left and right contact angles and drop height. The drop is then fitted in each image of the sequence using the same thresholds.
