
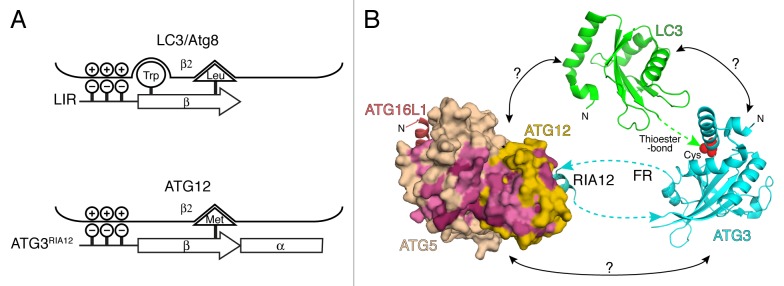
Figure 1. Summary of structural information of the E2–E3 interaction. (A) A schematic presentation of the LC3-LIR (top) and ATG12-ATG3RIA12 (bottom) interactions. (B) The structures of the human ATG3RIA12-ATG12–ATG5-ATG16N (the N-terminal fragment of ATG16L1) (PDB ID: 4NAW) complex, Arabidopsis thaliana ATG3 (3VX8) and human LC3 (1UGM) are shown in ribbon models, while ATG12–ATG5 is shown in a surface model. The residues with the highest and high conservation are colored with magenta and pink, respectively. The cyan and green dotted lines indicate the missing connections between the N- or C-termini of the RIA12 and the E2 core of ATG3, and the C terminus of LC3 and the catalytic cysteine residue (red) of ATG3, respectively. The arrows at the ends of the dotted lines indicate the directions of protein chains. Possible but uncharacterized interactions are indicated with question marks.