

Abstract
Aldehyde dehydrogenase 2 (ALDH2) is the major enzyme that metabolizes acetaldehyde produced from alcohol metabolism. Approximately 40~50% of East Asians carry an inactive ALDH2 gene and exhibit acetaldehyde accumulation after alcohol consumption. However, the role of ALDH2 deficiency in the pathogenesis of alcoholic liver injury remains obscure. In the present study, wild-type and ALDH2−/− mice were subjected to ethanol feeding and/or carbon tetrachloride (CCl4) treatment, and liver injury was assessed. Compared with wild-type mice, ethanol-fed ALDH2−/− mice had higher levels of malondialdehyde-acetaldehyde (MAA) adduct and greater hepatic inflammation, with higher hepatic IL-6 expression but surprisingly lower levels of steatosis and serum ALT. Higher IL-6 levels were also detected in ethanol-treated precision-cut-liver-slices from ALDH2−/− mice and in Kupffer cells isolated from ethanol-fed ALDH2−/− mice than those levels in wild-type mice. In vitro incubation with MAA enhanced the LPS-mediated stimulation of IL-6 production in Kupffer cells. In agreement with these findings, hepatic activation of the major IL-6 downstream signaling molecule signal transducer and activator of transcription 3 (STAT3) was higher in ethanol-fed ALDH2−/− mice than in wild-type mice. An additional deletion of hepatic STAT3 increased steatosis and hepatocellular damage in ALDH2−/− mice. Finally, ethanol-fed ALDH2−/− mice were more prone to CCl4-induced liver inflammation and fibrosis than ethanol-fed wild-type mice.
Conclusions:
ALDH2−/− mice are resistant to ethanol-induced steatosis but prone to inflammation and fibrosis via MAA-mediated paracrine activation of IL-6 in Kupffer cells. These findings suggest that alcohol, via acetaldehyde and its associated adducts, stimulates hepatic inflammation and fibrosis independent from causing hepatocyte death, and that ALDH2-deficient individuals may be resistant to steatosis and blood ALT elevation, but are prone to liver inflammation and fibrosis following alcohol consumption.
Keywords: Acetaldehyde, ALDH2, ethanol, fibrosis, inflammation, IL-6, STAT3
Introduction
Excessive alcohol consumption is a leading cause of chronic liver disease worldwide and is the basis of approximately 50% of cirrhosis cases in the USA and Europe. Alcohol consumption is also becoming one of the major causes of chronic liver disease in Asia because of a striking increase in alcohol consumption in recent years. An early response of the liver to alcohol ingestion is the development of steatosis (fatty liver), which occurs in more than 90% of heavy drinkers. Fatty liver may further progress to steatohepatitis, fibrosis, cirrhosis, and hepatocellular carcinoma in approximately 10-40% of heavy drinkers. To date, several mechanisms underlying the pathogenesis of alcoholic liver disease (ALD) have been identified.1-3 Among these mechanisms, ethanol metabolism and increased oxidative stress are thought to play a critical role in the development of ALD.4-7
In humans, more than 90% of ingested alcohol is removed via metabolic degradation that primarily occurs in the liver (hepatocytes). Ethanol is oxidized by cytosolic alcohol dehydrogenase (ADH) to form acetaldehyde, which is subsequently oxidized by mitochondrial aldehyde dehydrogenases, mainly ALDH2, to produce acetate.8 It is believed that acetaldehyde is highly toxic, mutagenic, and carcinogenic, playing an important role in the pathogenesis of ALD en route to liver fibrosis and even liver cancer through direct cytotoxicity and the release of inflammatory cytokines.9, 10 A genetic polymorphism of ALDH2 has been labeled ALDH2*2 and has a much lower activity than wild-type (WT) ALDH2*1. Up to 50% of the population of East Asia carry the ALDH2*2 allele, and these people show high blood acetaldehyde concentrations after alcohol consumption.11, 12 The inactive form of ALDH2 may prevent many individuals from drinking heavily due to an acetaldehyde-mediated “flushing syndrome”, which includes facial flushing, palpitations, drowsiness, and other unpleasant symptoms. However, many individuals with the dominant inactive form of ALDH2*2 still drink heavily and exhibit high levels of acetaldehyde, even after the intake of only a moderate amount of alcohol. For example, in individuals who were inactive ALDH2*1/2*2 heterozygotes or inactive ALDH2*2/2*2 homozygotes and who consumed even a small amount of ethanol (0.1 g/kg), the peak blood acetaldehyde levels were 5 times and 18 times higher, respectively, than the levels in active ALDH2*1/2*1 homozygotes who consumed a moderate amount of ethanol (0.8 g/kg).13 Although acetaldehyde has been shown to be toxic to hepatocytes and to promote fat accumulation in hepatocytes in vitro, 9, 10, 14 the exact in vivo effects of inactive ALDH2-associated acetaldehyde accumulation on ALD remain unknown.
To study acetaldehyde- and/or ethanol-mediated toxicity in ALDH2-inactive subjects, an animal model of simulating human ALDH2 polymorphism, ALDH2−/− mice, was generated in a previous study.15, 16 ALDH2−/− mice exhibited a null or very low level of ALDH activity in the mitochondrial fractions of the liver and had higher levels of acetaldehyde accumulation than WT mice when administered ethanol.15, 16 However, surprisingly, ALDH2−/− mice had lower levels of serum alanine transaminase (ALT) and hepatic oxidative stress than WT mice after ethanol feeding,17 whereas others reported that ethanol-induced oxidative DNA damage and CYP2E1 expression were more intense in ALDH2−/− mice than in WT mice.18 In the present study, we extensively investigated the functions of ALDH2 in the development of alcohol-induced fatty liver, inflammation, and fibrosis using ALDH2−/− mice. Our results revealed that compared with WT mice, ALDH2−/− mice were resistant to ethanol-induced steatosis and elevation of serum ALT but more susceptible to liver inflammation. ALDH2−/− mice were also more prone to ethanol plus carbon tetrachloride (CCl4)-induced liver inflammation and fibrosis. Mechanistically, ALDH2−/− mice exhibit higher hepatic levels of acetaldehyde, and malondialdehyde-acetaldehyde (MAA) adduct than WT mice after ethanol feeding. MAA stimulates Kupffer cells to produce IL-6, which activates signal transducer and activator of transcription 3 (STAT3) in hepatocytes and subsequently ameliorates fatty liver but promotes an inflammatory response and fibrosis.
Materials and methods
Mice
ALDH2−/− mice on a C57BL/6 background were kindly provided by Dr. Toshihiro Kawamoto17 and were further backcrossed to a C57BL/6N background for at least eight generations in our facility. Homozygous ALDH2−/− mice were bred to generate ALDH2−/− mice. C57BL/6N mice were purchased from the NCI (Frederick, MD) and bred in our facility to generate wild-type controls. ALDH2−/− and hepatocyte-specific STAT3-knockout double-mutant mice (ALDH2−/−STAT3Hep−/− dKO) were generated by several steps of crossing ALDH2−/− mice with AlbCreSTAT3flox/flox mice (C57BL/6N background). AlbCreSTAT3flox/flox mice were described previously.19 Eight- to 10-week-old male mice were used in this study. The National Institute on Alcohol Abuse and Alcoholism Animal Care and Use Committee approved all of the animal experiments.
Mouse models for ethanol consumption
The chronic-binge ethanol consumption model was described previously.20 In the 4-week ethanol-feeding model, mice were either fed a liquid diet containing 4% ethanol or pair-fed a control diet for 4 weeks. To induce liver fibrosis, mice were either fed a liquid diet containing 4% ethanol or pair-fed a control diet, and mice were injected (intraperitoneally, two times per week) with 0.1 ml/kg body weight of CCl4 (Sigma, St. Louis, MO) for 8 weeks.
Other methods
Additional methods are described in the Supporting Information.
Results
ALDH2−/− mice are resistant to ethanol-induced fatty liver and elevation of serum ALT levels
To investigate the role of ALDH2 in early alcohol-induced fatty liver, WT and ALDH2−/− mice were subjected to chronic-binge feeding. Both groups of mice consumed similar amounts of an ethanol diet (data not shown). Body weight was slightly decreased in WT and ALDH2−/− mice after 10-day ethanol feeding (Fig. 1A). Chronic-binge ethanol feeding elevated hepatic acetaldehyde levels, and as expected, these levels were much higher in ALDH2−/− mice than in WT mice (Fig. 1B). Interestingly, in pair-fed groups, ALDH2−/− mice also had higher hepatic acetaldehyde levels than WT mice (Fig. 1B).
Fig. 1. ALDH2−/− mice have lower levels of serum ALT and hepatic steatosis after ethanol feeding than do WT mice.
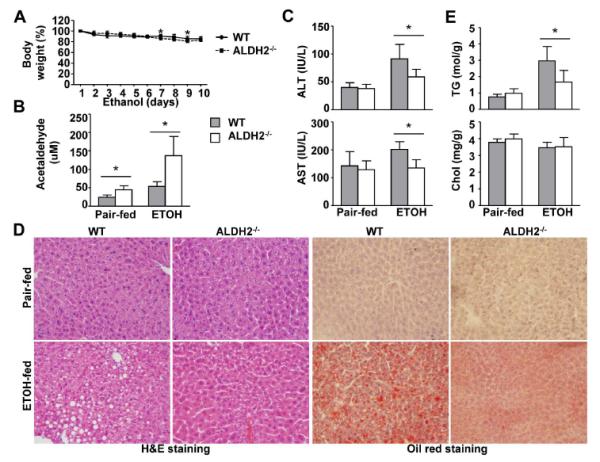
WT and ALDH2−/− mice were fed a control or ethanol diet for 10 days, followed by a single gavage of maltose or ethanol. The mice were euthanized 9 h after gavage. (A) Body weight after ethanol feeding. (B) Hepatic acetaldehyde levels. (C) Serum ALT and AST levels. (D) Representative hematoxylin and eosin (H&E) staining and Oil Red O staining of liver tissues. (E) Hepatic triglyceride (TG) and cholesterol (Chol) levels. The values represent means ± SD. (n=4 in pair-fed WT or KO group, n=8 in ethanol-fed WT or KO group) *P < 0.05.
Despite higher hepatic acetaldehyde levels in ethanol-fed ALDH2−/− mice, serum ALT and AST levels were lower in those mice than in ethanol-fed WT mice (Fig. 1C). Liver histology and Oil Red O staining revealed that ethanol-fed ALDH2−/− mice had a lower degree of steatosis than ethanol-fed WT mice (Fig. 1D). Analyses of hepatic lipid content confirmed that ALDH2−/− mice had lower hepatic levels of triglycerides than WT mice after ethanol feeding, whereas hepatic cholesterol levels were comparable between the two groups.
In addition, after 4 weeks of ethanol feeding, ALDH2−/− mice had higher hepatic acetaldehyde levels but lower steatosis and serum ALT and AST levels than WT mice (data not shown).
ALDH2−/− and WT mice have comparable levels of hepatic oxidative stress, CYP2E1, and ADH1 expression after 10-day chronic-binge ethanol feeding
Because hepatic oxidative stress, CYP2E1, and ADH1 expression play important roles in the development of ALD,21 we wondered whether the resistance of ALDH2−/− mice to ethanol-induced fatty liver was due to a change in oxidative stress, CYP2E1, and ADH1 expression. The data in Supporting Fig. 1 revealed that there were no differences in all of these parameters between the WT and ALDH2−/− groups.
ALDH2 deficiency accelerates the ethanol-induced liver inflammatory response (eg. IL-6 production) via MAA-mediated activation of Kupffer cells
Next, we examined liver inflammation in ethanol-fed WT and ALDH2−/− mice. As illustrated in Fig. 2A and supporting Fig. 2A, chronic-binge ethanol feeding did not affect the expression of F4/80 mRNA or the number of F4/80+ cells in WT mice, which is in agreement with previous findings.22 However, the number of F4/80+ cells and the hepatic expression of F4/80+ mRNA were markedly elevated in ALDH2−/− mice after ethanol feeding. Moreover, the hepatic expression levels of CD68, MCP-1, IL-6, and TNF-α mRNA were higher in ethanol-fed ALDH2−/− mice than in ethanol-fed WT mice (Fig. 2A). No significant difference were noted in hepatic IFN-γ mRNA (Fig. 2A) and hepatic IL-10 mRNA between the two groups (Supporting Fig. 2B). In addition, serum levels of MCP-1, IL-6, TNF-α, and IFN-γ were comparable in the two groups after chronic-binge ethanol feeding (data not shown).
Fig. 2. ALDH2 deficiency accelerates the ethanol-induced liver inflammatory response (eg. IL-6 production) via MAA-mediated activation of Kupffer cells. (A).
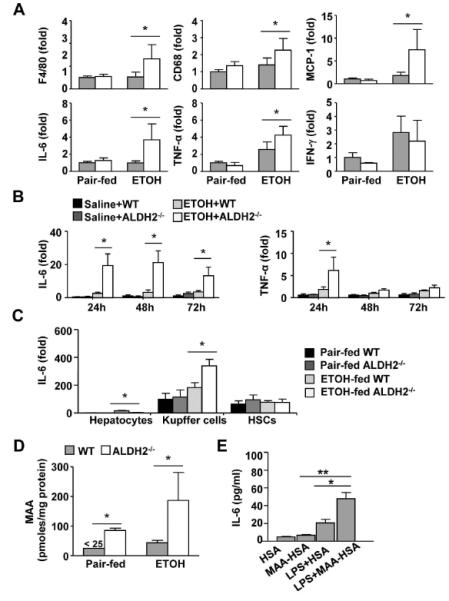
WT and ALDH2−/− mice were fed a control or ethanol diet for 10 days, followed by a single gavage of maltose or ethanol, respectively. Hepatic cytokine expression was measured using real-time PCR analyses. (n=4 in pair-fed WT or KO group, n=8 in ethanol-fed WT or KO group) (B) Expression of IL-6 and TNF-α mRNA in precision-cut liver slices (PCLS) ex vivo. (n=3 each group). (C) Hepatocytes, Kupffer cells, and HSCs were isolated from pair-fed or chronic-binge ethanol-fed mice and subjected to real-time PCR analyses. (n=3 each group). (D) Hepatic MAA levels from pair-fed or chronic-binge ethanol-fed mice were measured. (E) Kupffer cells from WT mice were isolated and treated with 25 μg/ml HSA or MAA-HSA in the presence or absence of LPS (1 ng/ml). After stimulation with MAA for 2 h, cell culture media were analyzed for IL-6 levels. (n=3 each group). The values represent means ± SD. *P < 0.05, **P < 0.01.
To further study the roles of ALDH2 in the ethanol-mediated upregulation of inflammatory cytokines ex vivo, we used a precision-cut liver slices (PCLS) model.23 As illustrated in Fig. 2B, the in vitro incubation of PCLS with ethanol induced higher levels of IL-6 in PCLS from ALDH2−/− mice than were observed using PCLS from WT mice 24h, 48h, and 72h post-ethanol treatment. TNF-α mRNA levels were also higher in ALDH−/− PCLS than in WT PCLS 24h poster ethanol treatment.
The above data revealed that ALDH2−/− mice are more susceptible to an ethanol-induced liver inflammatory response such as IL-6 production. To define which cell types were responsible for IL-6 production, hepatocytes, hepatic stellate cells (HSCs), and Kupffer cells were isolated from chronic-binge ethanol-fed WT and ALDH2−/− mice, and IL-6 mRNA expression was analyzed. As illustrated in Fig. 2C, Kupffer cells and HSCs expressed high levels of IL-6, whereas hepatocytes expressed minimal levels. In WT mice, ethanol feeding upregulated the expression of IL-6 mRNA in Kupffer cells but not in HSCs. Such upregulation was much higher in ethanol-fed ALDH2−/− mice than in ethanol-fed WT mice.
To further define the mechanisms responsible for higher hepatic IL-6 levels in ethanol-fed ALDH2−/− mice than in ethanol-fed WT mice, we measured MAA adduct, which has been shown to stimulate Kupffer cells/macrophages to produce cytokines.24 As illustrated in Fig. 2D, chronic-binge ethanol feeding slightly elevated hepatic MAA levels in WT mice but markedly elevated MAA levels in ALDH2−/− mice. Hepatic MAA levels were approximately 5-fold higher in ethanol-fed ALDH2−/− mice compared to ethanol-fed WT mice. Interestingly, hepatic MAA levels were also higher in pair-fed ALDH2−/− mice than in pair-fed WT mice.
To investigate whether MAA induces IL-6 production, Kupffer cells were treated with MAA-human serum albumin (HSA) or MAA-HSA plus LPS. Kupffer cells secreted little IL-6 in response to HSA or MAA-HSA (Fig. 2E). Incubation with LPS significantly enhanced IL-6 production, which was further elevated after stimulation with a combination of LPS plus MAA-HSA (Fig. 2E).
Ethanol-fed ALDH2−/− mice have higher levels of hepatic STAT3 activation than ethanol-fed WT mice
STAT3 is a key molecule downstream of IL-6 and plays an important role in ameliorating fatty liver.19 Thus, we studied whether hepatic STAT3 is activated in ethanol-fed ALDH2−/− mice in which IL-6 is elevated, as shown above. As illustrated in Fig. 3A, chronic-binge ethanol feeding induced hepatic STAT3 activation in WT mice, and this activation was much higher in ethanol-fed ALDH2−/− mice. STAT3 activation has been shown to ameliorate fatty liver by attenuating sterol regulatory element-binding protein 1c (SREBP1c) gene transcription, consequently inhibiting fatty acid synthesis and fatty liver development during ethanol feeding.19 As shown in Fig. 3B, chronic-binge ethanol feeding upregulated hepatic mRNA levels of mature nuclear SREBP1c and its downstream target genes, acetyl-CoA carboxylase-1 (ACC1) and fatty acid synthase (FAS), in WT mice. The expression levels of these genes were much lower in ethanol-fed ALDH2−/− mice than in ethanol-fed WT mice. In addition, the expression levels of redox factor-1 (Ref-1) and manganese superoxide dismutase (MnSOD), two STAT3 downstream-target antioxidative genes,25, 26 were much greater in ethanol-treated ALDH2−/− mice than in WT mice (Fig. 3C).
Fig. 3. ALDH2−/− mice exhibit higher levels of hepatic STAT3 activation after chronic-binge ethanol feeding than do WT mice.
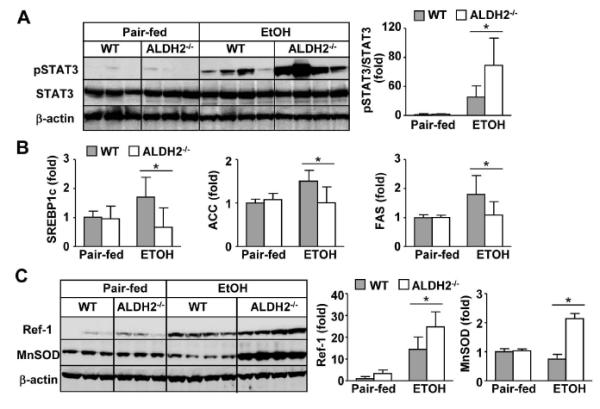
WT and ALDH2−/− mice were subjected to pair-fed or chronic-binge ethanol feeding. The mice were euthanized 9 h after alcohol or maltose gavage. Liver tissues were collected for Western blot or real-time PCR analyses. (A) Western blot analyses. (B) Real-time PCR analyses of fat metabolism-associated genes. (C) Western blot analyses of antioxidant proteins. The densities of STAT3, Ref-1 and MnSOD were quantified using densitometry. The values represent means ± SD. (n=4 in pair-fed WT or KO group, n=8 in ethanol-fed WT or KO group) *P < 0.05.
An additional deletion of hepatic STAT3 restores steatosis but suppresses inflammation in ethanol-fed ALDH2−/− mice
The above results suggest that ALDH2−/− mice have more elevated hepatic activation of STAT3 after chronic-binge ethanol feeding than WT mice. To test whether elevated pSTAT3 is responsible for the resistance of ALDH2−/− mice to ethanol-induced liver injury and steatosis, we made an additional deletion of hepatic STAT3 in ALDH2−/− mice to generate ALDH2−/−STAT3Hep−/− double KO mice. STAT3 deletion was confirmed by the Western blot analyses in Fig. 4A. In addition, chronic-binge ethanol feeding induced STAT3 activation in ALDH2−/− mice, but this increase was not observed in ALDH2−/−STAT3Hep−/− mice.
Fig. 4. An additional deletion of STAT3 in hepatocytes increases ethanol-induced serum ALT elevation and hepatic steatosis but suppresses inflammation in ALDH2−/− mice.
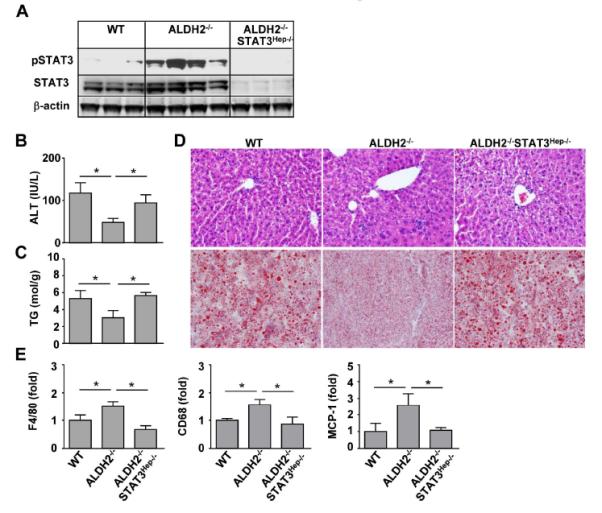
WT, ALDH2−/−, and ALDH2−/−STAT3Hep−/− mice were fed an ethanol diet for 10 days, followed by a single gavage of ethanol. The mice were euthanized 9 h after gavage. (A) Western blot analysis. (B) Serum ALT levels. (C) Hepatic triglyceride (TG) levels. (D) Representative hematoxylin and eosin (H&E) staining and Oil Red O staining of liver tissues. (E) The hepatic expression of cytokines was measured using real-time PCR analyses. The values in panels B, C, E represent means ± SD. (n=6 WT, n=4 ALDH2−/− or ALDH2−/−STAT3Hep−/−). *P < 0.05.
Compared with WT mice, ALDH2−/− mice had lower serum ALT and hepatic triglyceride levels after ethanol feeding, which were restored in ALDH2−/−STAT3Hep−/− mice (Figs. 4B-C). Hematoxylin and eosin (H&E) and Oil Red O staining also revealed more steatosis in the livers of ALDH2−/−STAT3Hep−/− mice than in ALDH2−/− mice (Fig. 4D). Finally, compared with WT mice, ALDH2−/− mice had increased inflammatory responses in the liver after ethanol feeding, such as higher levels of hepatic F4/80, CD68, and MCP-1 expression. This expression was significantly reduced in ALDH2−/−STAT3Hep−/− mice compared with ALDH2−/− mice (Fig. 4E).
ALDH2−/− mice do not develop liver fibrosis after chronic-binge ethanol feeding or 4-week chronic ethanol feeding
Because ethanol-fed ALDH2−/− mice had elevated hepatic acetaldehyde levels and because acetaldehyde is known to enhance HSC activation in vitro,9, 10, 27 we hypothesized that ethanol-fed ALDH2−/− mice may develop higher levels of liver fibrosis or fibrogenic responses than ethanol-fed WT mice. Surprisingly, no obvious liver fibrosis was observed in chronic-binge ethanol fed (Supporting Figs. 3A-D) or in 4-week chronic ethanol fed WT and ALDH2−/− mice (Supporting Figs. 4A-D).
ALDH2−/− mice exhibit accelerated liver inflammation and fibrosis in response to ethanol plus CCl4 treatment
To further investigate the role of ALDH2 in alcoholic liver fibrosis, WT and ALDH2−/− mice were treated with ethanol-fed plus CCl4 or pair-fed plus CCl4 for 8 weeks. Liver injury and fibrosis were then examined. As shown in Fig. 5A, in the pair-fed groups, CCl4 treatment induced comparable levels of serum ALT. In the ethanol groups, surprisingly, ALDH2−/− mice showed significantly lower levels of serum ALT than WT mice after ethanol plus CCl4 treatment, suggesting that ALDH2−/− mice are resistant to ethanol plus CCl4-induced elevation of serum ALT.
Fig. 5. ALDH2 deficiency accelerates liver inflammation after ethanol plus CCl4 administration.
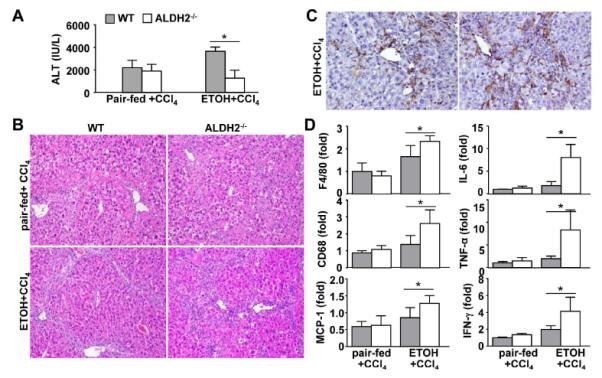
WT and ALDH2−/− mice were fed an ethanol diet or pair-fed, and these mice were co-administrated with CCl4 for 8 weeks. The mice were euthanized 24 hours post the last CCl4 injection. (A) Serum ALT levels. (B) Representative hematoxylin and eosin (H&E) staining (X100). (C) Representative immunohistochemical staining of F4/80 (X200). (D) The hepatic expression of cytokines was measured using real-time PCR analyses. The values represent means ± SD. (n=8 mice in each pair-fed or ethanol-fed WT or ALDH2−/− group) *P < 0.05.
The H&E staining analyses in Fig. 5B revealed that in the pair-fed plus CCl4 group, WT and ALDH2−/− mice had comparable degrees of liver injury and inflammation, whereas in the ethanol plus CCl4 group, ALDH2−/− mice had markedly higher levels of liver inflammation than WT mice. Immunohistochemistry analyses revealed that ALDH2−/− mice had more F4/80+ macrophages in the liver than WT mice after ethanol plus CCl4 treatment (Fig. 5C). Furthermore, real-time PCR analyses demonstrated that the expression levels of several inflammatory cell markers and genes were comparable in WT and ALDH2−/− mice after pair-fed plus CCl4 treatment but were much higher in ALDH2−/− mice than in WT mice after ethanol plus CCl4 treatment (Fig. 5D).
Liver fibrosis was further determined by performing Sirius red and α-SMA staining. As illustrated in Figs. 6A-C, in the pair-fed plus CCl4 group, WT and ALDH2−/− mice had comparable levels of Sirius red staining and α-SMA-positive staining. However, in the ethanol plus CCl4 group, ALDH2−/− mice had much greater Sirius red and α-SMA staining than WT mice. In agreement with these findings, the hepatic expression levels of α-SMA, TGF-β, Collagen α1(I), and TIMP-1 mRNA were comparable in pair-fed WT and ALDH2−/− mice. However, in the ethanol plus CCl4 group, the expression levels of these genes were much higher in ALDH2−/− mice than in WT mice (Fig. 6D).
Fig. 6. ALDH2−/− mice show higher degrees of hepatic fibrosis after 8-week ethanol plus CCl4 treatment than do WT mice.
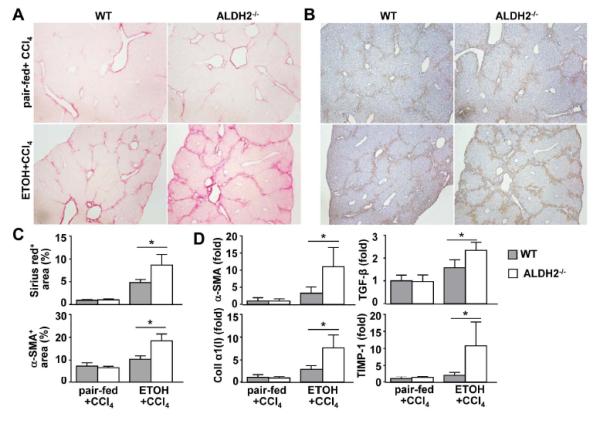
(A-D) WT and ALDH2−/− mice were treated with ethanol-fed plus CCl4 or pair-fed plus CCl4 for 8 weeks. (n=8 mice in each pair-fed or ethanol-fed WT or ALDH2−/− group). (A, B) Representative photographs of Sirius red staining (A) and immunohistochemical analysis with an anti-α-SMA antibody (B). (C) The Sirius red+ and α-SMA+ areas were quantified from panels A and B, respectively. (D) Real-time PCR analyses of hepatic fibrosis-associated genes. The values represent means ± SD. *P < 0.05.
To identify the mechanism by which ethanol plus CCl4 induces more fibrosis in ALDH2−/− mice than in WT mice, LX2 cells, a human HSC cell line, were treated with acetaldehyde, MAA, IL-6, acetaldehyde plus IL-6, or MAA plus IL-6. As shown in Supporting Fig. 5, acetaldehyde, MAA or IL-6 treatment up-regulated expression of α-SMA and collagen I. Co-treatment of IL-6 with acetaldehyde, or with MAA further increased expression of α-SMA but not collagen I. Activation of ERK1/2 was elevated after acetaldehyde, MAA, or IL-6 treatment, this level was further elevated after IL-6 plus acetaldehyde or MAA (Supporting Fig. 5). Combination of IL-6 with acetaldehyde, or with MAA did not additively or synergistically activate NF-κB, p38MAPK, or STAT3 in LX2 cells (Supporting Fig. 5).
Discussion
In this paper, our findings suggest that ethanol-fed ALDH2−/− mice exhibit acetaldehyde and MAA accumulation, which induce inflammation-associated hepatic IL-6/STAT3 activation and subsequently promote alcoholic liver inflammation and fibrosis. The activation of IL-6/STAT3 also plays a compensatory role in ameliorating steatosis and hepatocellular damage. All of these findings are summarized in Fig. 7.
Fig. 7. A model depicting the mechanisms underlying increased inflammation and fibrosis but reduced fatty liver and hepatocellular damage after ethanol feeding in ALDH2−/− mice.
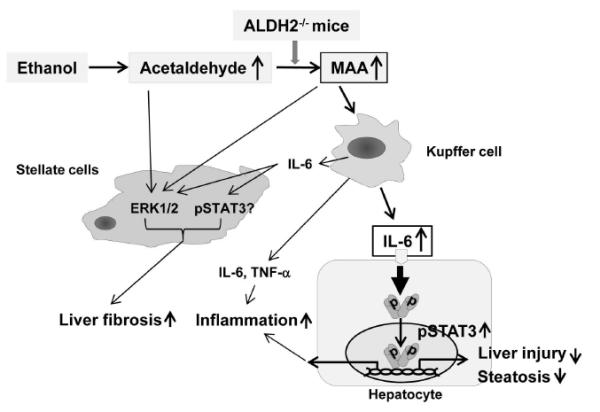
Alcohol consumption leads to MAA adduct accumulation in the livers of ALDH2−/− mice. MAA then stimulates Kupffer cells to produce proinflammatory cytokines, such as IL-6, leading to inflammation and subsequently promoting liver fibrosis. IL-6 also activates STAT3 in hepatocytes, followed by the upregulated expression of antioxidative stress genes and the downregulated expression of fatty acid synthesis genes, subsequently ameliorating hepatocellular damage and steatosis. In addition, acetaldehyde, MAA and IL-6 activate ERK1 and STAT3 in HSCs, thereby accelerating liver fibrosis in ALDH2−/− mice.
ALDH2−/− mice are more susceptible to ethanol-induced liver inflammation
As illustrated in Fig. 2 and supporting Fig. 2, compared with ethanol-fed WT mice, the number of macrophages and the hepatic expression of proinflammatory cytokines and chemokines were much greater in ethanol-fed ALDH2−/− mice. In addition, PCLS from ALDH2−/− mice produced higher levels of cytokines than did PCLS from WT mice after incubation with ethanol in vitro (Fig. 2B). A greater degree of liver inflammation was also observed after ethanol plus CCl4 treatment in ALDH2−/− mice than in WT mice (Fig. 5). Collectively, our findings suggest that ALDH2 deficiency promotes an inflammatory response during ethanol-induced liver injury. However, the mechanism by which ALDH2 deficiency stimulates a proinflammatory signal in the liver is not clear. During chronic alcohol consumption, MDA is increased and subsequently interacts with acetaldehyde to form the MAA hapten.10 Recent studies have shown that the treatment of cultured Kupffer cells with MAA adduct stimulates the secretion of cytokines and chemokines, including TNF-α, MCP-1, and macrophage inflammatory protein 2 (MIP-2).24 This finding led us to speculate that this adduct may play an important role in promoting liver inflammation in our model. Indeed, as shown in Figs. 2D-E, ethanol-fed ALDH2−/− mice displayed higher levels of hepatic MAA than WT mice, and treatment with MAA adduct stimulated IL-6 secretion by Kupffer cells. These findings suggest that compared with WT mice, ALDH2−/− mice produce higher levels of MAA adduct after ethanol feeding, which stimulates Kupffer cells to produce higher levels of proinflammatory cytokines, such as IL-6, and exacerbates liver inflammation.
STAT3 is the major downstream signaling molecule of IL-6, and activated STAT3 in hepatocytes has been shown to act as an anti-inflammatory cytokine by protecting against hepatocellular damage in many models of liver injury.28 However, hepatic STAT3 may also aggravate liver inflammation by promoting hepatocytes to secrete acute-phase proteins and chemokines in an alcoholic liver injury model 19 and in CCl4-induced hepatitis29 because the ablation of hepatic STAT3 reduced liver inflammation in those models. Enhanced hepatic STAT3 activation likely also contributes to exacerbated liver inflammation in ALDH2−/− mice after ethanol feeding because an additional deletion of hepatic STAT3 reduced the hepatic mRNA levels of several inflammatory markers and chemokines in ALDH2−/− mice (Fig. 4).
ALDH2−/− mice are resistant to ethanol-induced fatty liver and elevation of serum ALT
An unexpected finding in this study was that despite higher levels of hepatic acetaldehyde and inflammation, ALDH2−/− mice had lower levels of serum ALT and hepatic steatosis than WT mice after ethanol feeding (Fig. 1A) or ethanol plus CCl4 treatment (Fig. 5). Lower serum levels of ALT in ALDH2−/− mice than in WT mice were also observed in other models of alcoholic liver injury, such as feeding mice ethanol in drinking water.17 The resistance of ALDH2−/− mice to ethanol-induced fatty liver and the elevation of serum ALT was not due to changes in CYP2E1 and ADH1 expression and oxidative stress because ethanol-fed WT and ALDH2−/− mice had comparable levels of these parameters (Supporting Fig. 1). Given that the hepatoprotective effect of IL-6/STAT3 is well documented in a variety of liver injury models, including alcoholic fatty liver,30 elevated hepatic IL-6/STAT3 activation in ethanol-fed ALDH2−/− mice (Figs. 2A and 3A) likely contributes to reduced steatosis and serum ALT in these mice compared with WT mice. The finding that an additional deletion of hepatic STAT3 restores steatosis and serum ALT elevation in ethanol-fed ALDH2−/− mice supports this notion (Figs. 4B-D).
It has been shown that IL-6/STAT3 protects against alcoholic fatty liver and injury by downregulating the expression of lipogenic genes (e.g., SREBP1c) and upregulating the expression of antioxidative genes (e.g., Ref-1 and MnSOD) and anti-apoptotic genes (e.g., Bcl-2 and Bcl-xL) in the liver.25, 26 Our results revealed that SREBP1c expression was downregulated, whereas Ref-1 and MnSOD expression levels were upregulated in ethanol-fed ALDH2−/− mice compared with the corresponding WT mice, which correlate with the upregulated hepatic IL-6/STAT3 activation (Fig. 3). These findings suggest that during alcoholic liver injury, hepatic IL-6/STAT3 elevation in ALDH2−/− mice plays a compensatory role in preventing fatty liver and hepatic damage via the downregulation of SREBP1c and the upregulation of hepatoprotective genes. Although the anti-steatotic effects of IL-6/STAT3 are well-documented in vivo, in vitro treatment with IL-6 did not reduce steatosis in cultured steatotic hepatocytes.31 This suggests that in vivo IL-6/STAT3-mediated amelioration of fatty liver may require other co-factors.
ALDH2−/− mice are more susceptible to ethanol plus CCl4-induced fibrosis
Acetaldehyde has been shown to directly enhance HSC activation and the expression of collagens in vitro.9, 10, 27 Despite elevated acetaldehyde levels in the liver, ethanol-fed ALDH2−/− mice did not develop obvious fibrosis (Supporting Figs. 3-4). This finding suggests that the treatment duration (up to 10 days or 4 weeks) may be too short to see fibrosis with alcohol feeding alone or that other factors are required, in synergy with acetaldehyde, to induce liver fibrosis. Indeed, ethanol-fed ALDH2−/− mice developed a much higher degree of liver fibrosis than WT mice after CCl4 challenge (Fig. 6). It was reported that Kupffer cell- and HSC-derived IL-6 promotes HSC activation and proliferation via p38 MAPK and ERK1/2 activation.27, 32 Here we found that IL-6 treatment induced strong activation of ERK1/2 but weak activation of p38 MAPK; co-treatment of IL-6 and acetaldehyde or MAA further increased EKR1/2 activation and expression of αSMA in cultured HSCs (Supporting Fig. 5). Therefore, it is plausible that ethanol and CCl4 co-treatment induced much higher hepatic levels of IL-6 in ALDH2−/− mice than did ethanol or CCl4 treatment alone (Figs. 2 and 5) and that such high levels of IL-6, in synergy with acetaldehyde or MAA, promote HSC activation and liver fibrosis via the activation of ERK1/2 in ALDH2−/− mice (Fig. 6 and Supporting Fig. 5). IL-6 treatment also induced STAT3 activation in HSCs (Supporting Fig. 5); however, the roles of STAT3 in liver fibrogenesis remain controversial. It was reported that leptin- and IL-17-mediated activation of STAT3 in HSCs is implicated in promoting liver fibrosis;33, 34 whereas IL-22-mediated activation of STAT3 in HSCs is involved in inducing HSC senescence and ameliorating liver fibrosis.35 Further studies are needed to clarify the functions of IL-6/STAT3 activation in liver fibrogenesis.
In summary, compared with WT mice, ethanol-fed ALDH2−/− mice exhibit higher levels of hepatic acetaldehyde and MAA, which lead to hepatic IL-6/STAT3 activation. The activation of this signaling pathway in the early stage of ALD may be compensatory, ameliorating fatty liver and inhibiting liver injury, but prolonged activation in the later stage (fibrosis) could contribute to the progression of chronic ALD and liver cancer by promoting an inflammatory response. In contrast to high levels of acetaldehyde, as expected, acetate levels were lower in ethanol-fed ALDH2−/− mice compared with those in WT mice (Supporting Fig. 6 and reference36). Acetate has been shown to upregulate the expression of pro-inflammatory cytokines in macrophages,37, 38, and there are no data indicating that acetate directly causes hepatocyte damage and steatosis in hepatocytes. Thus, the lower levels of acetate in ethanol-fed ALDH2−/− mice are unlikely responsible for the higher levels of liver inflammation and lower levels of serum ALT and hepatic steatosis in these mice. Finally, it has been well documented that ethanol treatment inhibits Sirt1 gene expression in hepatocytes, followed by inhibiting AMPK activation and disrupting lipin-1 signaling, thereby contributing to the development of fatty liver.39, 40 However, the effects of acetaldehyde on these signaling pathways in hepatocytes have not been explored. Thus, it would be interesting to examine whether acetaldehyde also affects the Sirt1-AMPK-lipin pathways and contributes to the development of alcoholic liver injury in ALDH2−/− mice.
Acetaldehyde, alcoholic liver injury, steatosis, inflammation, and fibrosis: Clinical implications
Due to its electrophilic nature, acetaldehyde is able to bind and form adducts with proteins, lipids, and DNA, and subsequently impairs functions of proteins and lipids, thereby promoting hepatocyte damage and liver fibrosis.9, 10 Our current study suggests a novel mechanism for the pathogenesis of ALD that alcohol, via acetaldehyde and its associated adducts, directly promotes liver inflammation and fibrosis independent from causing hepatocyte injury. The inflammation-associated activation of IL-6/STAT3 even spares hepatocytes from death and steatosis. Therefore, alcoholics especially those who have high levels of acetaldehyde may develop obvious liver inflammation and fibrosis without significant elevated blood ALT and fatty liver. These findings delineated herein have important clinical significance because an inactive ALDH2*2 gene exists in up to 50% people of East Asian origin.11, 12 These individuals with the dominant inactive ALDH2*2 gene may not have obvious fatty livers and elevated blood ALT levels after moderate or even heavy drinking, but they may have liver inflammation and fibrosis, and should be carefully monitored.
Supplementary Material
Acknowledgments
This work was supported by the intramural program of the NIAAA, NIH (BG) and 1R24AA022057 (VV).
Abbreviations
- ACC1
acetyl-coenzyme A carboxylase
- ADH
alcohol dehydrogenase
- ALDH2
aldehyde dehydrogenase 2
- ALT
alanine transaminase
- AST
aspartate aminotransferase
- FAS
fatty acid synthase
- GSH
glutathione
- 4-HNE
4-hydroxynonenal
- HSC
hepatic stellate cell
- IL-6
interleukin-6
- MAA
malondialdehyde and acetaldehyde
- MCP-1
monocyte chemoattractant protein 1
- MDA
malondialdehyde
- MnSOD
mitochondrial manganese superoxide dismutase
- PCLS
precision-cut liver slices
- Ref-1
redox factor-1
- α-SMA
alpha-smooth muscle actin
- SREBP1c
sterol regulatory element-binding protein1c
- STAT3
signal transducer and activator of transcription3
- TNF-α
tumor necrosis factor-α
Footnotes
Dr. Hyo-Jung Kwon and Dr. Young-Suk Won contributed equally to this work.
No conflicts of interest exist for any of the authors.
References
- 1.Tsukamoto H, Lu SC. Current concepts in the pathogenesis of alcoholic liver injury. FASEB J. 2001;15:1335–49. doi: 10.1096/fj.00-0650rev. [DOI] [PubMed] [Google Scholar]
- 2.Lumeng L, Crabb DW. Alcoholic liver disease. Curr Opin Gastroenterol. 2001;17:211–20. doi: 10.1097/00001574-200105000-00004. [DOI] [PubMed] [Google Scholar]
- 3.Gao B, Bataller R. Alcoholic liver disease: pathogenesis and new therapeutic targets. Gastroenterology. 2011;141:1572–85. doi: 10.1053/j.gastro.2011.09.002. [DOI] [PMC free article] [PubMed] [Google Scholar]
- 4.Nagy LE. Molecular aspects of alcohol metabolism: transcription factors involved in early ethanol-induced liver injury. Annu Rev Nutr. 2004;24:55–78. doi: 10.1146/annurev.nutr.24.012003.132258. [DOI] [PubMed] [Google Scholar]
- 5.Crabb DW, Matsumoto M, Chang D, et al. Overview of the role of alcohol dehydrogenase and aldehyde dehydrogenase and their variants in the genesis of alcohol-related pathology. Proc Nutr Soc. 2004;63:49–63. doi: 10.1079/pns2003327. [DOI] [PubMed] [Google Scholar]
- 6.Dey A, Cederbaum AI. Alcohol and oxidative liver injury. Hepatology. 2006;43:S63–74. doi: 10.1002/hep.20957. [DOI] [PubMed] [Google Scholar]
- 7.Meier P, Seitz HK. Age, alcohol metabolism and liver disease. Curr Opin Clin Nutr Metab Care. 2008;11:21–6. doi: 10.1097/MCO.0b013e3282f30564. [DOI] [PubMed] [Google Scholar]
- 8.Zakhari S, Li TK. Determinants of alcohol use and abuse: Impact of quantity and frequency patterns on liver disease. Hepatology. 2007;46:2032–9. doi: 10.1002/hep.22010. [DOI] [PubMed] [Google Scholar]
- 9.Mello T, Ceni E, Surrenti C, et al. Alcohol induced hepatic fibrosis: role of acetaldehyde. Mol Aspects Med. 2008;29:17–21. doi: 10.1016/j.mam.2007.10.001. [DOI] [PubMed] [Google Scholar]
- 10.Setshedi M, Wands JR, Monte SM. Acetaldehyde adducts in alcoholic liver disease. Oxid Med Cell Longev. 2010;3:178–85. doi: 10.4161/oxim.3.3.3. [DOI] [PMC free article] [PubMed] [Google Scholar]
- 11.Chao YC, Wang LS, Hsieh TY, et al. Chinese alcoholic patients with esophageal cancer are genetically different from alcoholics with acute pancreatitis and liver cirrhosis. Am J Gastroenterol. 2000;95:2958–64. doi: 10.1111/j.1572-0241.2000.02328.x. [DOI] [PubMed] [Google Scholar]
- 12.Takeshita T, Morimoto K, Mao XQ, et al. Phenotypic differences in low Km aldehyde dehydrogenase in Japanese workers. Lancet. 1993;341:837–8. [PubMed] [Google Scholar]
- 13.Enomoto N, Takase S, Yasuhara M, et al. Acetaldehyde metabolism in different aldehyde dehydrogenase-2 genotypes. Alcohol Clin Exp Res. 1991;15:141–4. doi: 10.1111/j.1530-0277.1991.tb00532.x. [DOI] [PubMed] [Google Scholar]
- 14.You M, Fischer M, Deeg MA, et al. Ethanol induces fatty acid synthesis pathways by activation of sterol regulatory element-binding protein (SREBP) J Biol Chem. 2002;277:29342–7. doi: 10.1074/jbc.M202411200. [DOI] [PubMed] [Google Scholar]
- 15.Kitagawa K, Kawamoto T, Kunugita N, et al. Aldehyde dehydrogenase (ALDH) 2 associates with oxidation of methoxyacetaldehyde; in vitro analysis with liver subcellular fraction derived from human and Aldh2 gene targeting mouse. FEBS Lett. 2000;476:306–11. doi: 10.1016/s0014-5793(00)01710-5. [DOI] [PubMed] [Google Scholar]
- 16.Isse T, Matsuno K, Oyama T, et al. Aldehyde dehydrogenase 2 gene targeting mouse lacking enzyme activity shows high acetaldehyde level in blood, brain, and liver after ethanol gavages. Alcohol Clin Exp Res. 2005;29:1959–64. doi: 10.1097/01.alc.0000187161.07820.21. [DOI] [PubMed] [Google Scholar]
- 17.Matsumoto A, Kawamoto T, Mutoh F, et al. Effects of 5-week ethanol feeding on the liver of aldehyde dehydrogenase 2 knockout mice. Pharmacogenet Genomics. 2008;18:847–5. doi: 10.1097/FPC.0b013e328307a0a9. [DOI] [PubMed] [Google Scholar]
- 18.Kim YD, Eom SY, Ogawa M, et al. Ethanol-induced oxidative DNA damage and CYP2E1 expression in liver tissue of Aldh2 knockout mice. J Occup Health. 2007;49:363–9. doi: 10.1539/joh.49.363. [DOI] [PubMed] [Google Scholar]
- 19.Horiguchi N, Wang L, Mukhopadhyay P, et al. Cell type-dependent pro- and anti-inflammatory role of signal transducer and activator of transcription 3 in alcoholic liver injury. Gastroenterology. 2008;134:1148–58. doi: 10.1053/j.gastro.2008.01.016. [DOI] [PMC free article] [PubMed] [Google Scholar]
- 20.Bertola A, Mathews S, Ki SH, et al. Mouse model of chronic and binge ethanol feeding (the NIAAA model) Nat Protoc . 2013;8:627–37. doi: 10.1038/nprot.2013.032. [DOI] [PMC free article] [PubMed] [Google Scholar]
- 21.Arteel GE. Oxidants and antioxidants in alcohol-induced liver disease. Gastroenterology. 2003;124:778–90. doi: 10.1053/gast.2003.50087. [DOI] [PubMed] [Google Scholar]
- 22.Bertola A, Park O, Gao B. Chronic plus binge ethanol feeding synergistically induces neutrophil infiltration and liver injury: A critical role for E-selectin. Hepatology. 2013 doi: 10.1002/hep.26419. [DOI] [PMC free article] [PubMed] [Google Scholar]
- 23.Schaffert CS, Duryee MJ, Bennett RG, et al. Exposure of precision-cut rat liver slices to ethanol accelerates fibrogenesis. Am J Physiol Gastrointest Liver Physiol. 2010;299:G661–8. doi: 10.1152/ajpgi.00287.2009. [DOI] [PMC free article] [PubMed] [Google Scholar]
- 24.Duryee MJ, Klassen LW, Freeman TL, et al. Lipopolysaccharide is a cofactor for malondialdehyde-acetaldehyde adduct-mediated cytokine/chemokine release by rat sinusoidal liver endothelial and Kupffer cells. Alcohol Clin Exp Res. 2004;28:1931–8. doi: 10.1097/01.alc.0000148115.90045.c5. [DOI] [PubMed] [Google Scholar]
- 25.Haga S, Terui K, Zhang HQ, et al. Stat3 protects against Fas-induced liver injury by redox-dependent and -independent mechanisms. J Clin Invest. 2003;112:989–98. doi: 10.1172/JCI17970. [DOI] [PMC free article] [PubMed] [Google Scholar]
- 26.Yu HC, Qin HY, He F, et al. Canonical notch pathway protects hepatocytes from ischemia/reperfusion injury in mice by repressing reactive oxygen species production through JAK2/STAT3 signaling. Hepatology. 2011;54:979–88. doi: 10.1002/hep.24469. [DOI] [PubMed] [Google Scholar]
- 27.Liu Y, Brymora J, Zhang H, et al. Leptin and acetaldehyde synergistically promotes alphaSMA expression in hepatic stellate cells by an interleukin 6-dependent mechanism. Alcohol Clin Exp Res. 2011;35:921–8. doi: 10.1111/j.1530-0277.2010.01422.x. [DOI] [PubMed] [Google Scholar]
- 28.Gao B, Wang H, Lafdil F, et al. STAT proteins - key regulators of anti-viral responses, inflammation, and tumorigenesis in the liver. J Hepatol. 2012;57:430–41. doi: 10.1016/j.jhep.2012.01.029. [DOI] [PMC free article] [PubMed] [Google Scholar]
- 29.Horiguchi N, Lafdil F, Miller AM, et al. Dissociation between liver inflammation and hepatocellular damage induced by carbon tetrachloride in myeloid cell-specific signal transducer and activator of transcription 3 gene knockout mice. Hepatology. 2010;51:1724–34. doi: 10.1002/hep.23532. [DOI] [PMC free article] [PubMed] [Google Scholar]
- 30.Gao B. Hepatoprotective and anti-inflammatory cytokines in alcoholic liver disease. J Gastroenterol Hepatol. 2012;27(Suppl 2):89–93. doi: 10.1111/j.1440-1746.2011.07003.x. [DOI] [PMC free article] [PubMed] [Google Scholar]
- 31.Hong F, Radaeva S, Pan HN, et al. Interleukin 6 alleviates hepatic steatosis and ischemia/reperfusion injury in mice with fatty liver disease. Hepatology. 2004;40:933–41. doi: 10.1002/hep.20400. [DOI] [PubMed] [Google Scholar]
- 32.Nieto N. Oxidative-stress and IL-6 mediate the fibrogenic effects of [corrected] Kupffer cells on stellate cells. Hepatology. 2006;44:1487–501. doi: 10.1002/hep.21427. [DOI] [PubMed] [Google Scholar]
- 33.Handy JA, Fu PP, Kumar P, et al. Adiponectin inhibits leptin signalling via multiple mechanisms to exert protective effects against hepatic fibrosis. Biochem J. 2011;440:385–95. doi: 10.1042/BJ20102148. [DOI] [PMC free article] [PubMed] [Google Scholar]
- 34.Meng F, Wang K, Aoyama T, et al. Interleukin-17 signaling in inflammatory, Kupffer cells, and hepatic stellate cells exacerbates liver fibrosis in mice. Gastroenterology. 2012;143:765–76. doi: 10.1053/j.gastro.2012.05.049. e1-3. [DOI] [PMC free article] [PubMed] [Google Scholar]
- 35.Kong X, Feng D, Wang H, et al. Interleukin-22 induces hepatic stellate cell senescence and restricts liver fibrosis in mice. Hepatology. 2012;56:1150–9. doi: 10.1002/hep.25744. [DOI] [PMC free article] [PubMed] [Google Scholar]
- 36.Kiyoshi A, Weihuan W, Mostofa J, et al. Ethanol metabolism in ALDH2 knockout mice--blood acetate levels. Leg Med (Tokyo) 2009;11(Suppl 1):S413–5. doi: 10.1016/j.legalmed.2009.02.043. [DOI] [PubMed] [Google Scholar]
- 37.Shen Z, Ajmo JM, Rogers CQ, et al. Role of SIRT1 in regulation of LPS- or two ethanol metabolites-induced TNF-alpha production in cultured macrophage cell lines. Am J Physiol Gastrointest Liver Physiol. 2009;296:G1047–53. doi: 10.1152/ajpgi.00016.2009. [DOI] [PMC free article] [PubMed] [Google Scholar]
- 38.Kendrick SF, O'Boyle G, Mann J, et al. Acetate, the key modulator of inflammatory responses in acute alcoholic hepatitis. Hepatology. 2010;51:1988–97. doi: 10.1002/hep.23572. [DOI] [PubMed] [Google Scholar]
- 39.Yin H, Hu M, Liang X, et al. Deletion of SIRT1 from Hepatocytes in Mice Disrupts Lipin-1 Signaling and Aggravates Alcoholic Fatty liver. Gastroenterology. 2013 doi: 10.1053/j.gastro.2013.11.008. [DOI] [PMC free article] [PubMed] [Google Scholar]
- 40.Hu M, Yin H, Mitra MS, et al. Hepatic-specific lipin-1 deficiency exacerbates experimental alcohol-induced steatohepatitis in mice. Hepatology. 2013;58:1953–63. doi: 10.1002/hep.26589. [DOI] [PMC free article] [PubMed] [Google Scholar]
Associated Data
This section collects any data citations, data availability statements, or supplementary materials included in this article.