

Abstract
Determining the individual roles of the two dopamine D1-like receptors (D1R and D5R) on sodium transport in the human renal proximal tubule has been complicated by their structural and functional similarity. Here we used a novel D5R-selective antagonist (LE-PM436) and D1R or D5R-specific gene silencing to determine second messenger coupling pathways and heterologous receptor interaction between the two receptors. D1R and D5R co-localized in renal proximal tubule cells and physically interact, as determined by co-immunoprecipitation and FRET microscopy. Stimulation of renal proximal tubule cells with fenoldopam (D1R/D5R agonist) led to both adenylyl cyclase and phospholipase C (PLC) activation using real-time FRET biosensors ICUE3 and CYPHR, respectively. Fenoldopam increased cAMP accumulation and PLC activity and inhibited both NHE3 and NaKATPase activities. LE-PM436 and D5R siRNA blocked the fenoldopam-stimulated PLC pathway but not cAMP accumulation, while D1R siRNA blocked both fenoldopam-stimulated cAMP accumulation and PLC signaling. Either D1R or D5R siRNA, or LE-PM436 blocked the fenoldopam dependent inhibition of sodium transport. Further studies using the cAMP-selective D1R/D5R agonist SKF83822 and PLC-selective D1R/D5R agonist SKF83959 confirmed the cooperative influence of the two pathways on sodium transport. Thus, D1R and D5R interact in the inhibition of NHE3 and NaKATPase activity, the D1R primarily by cAMP, while the D1R/D5R heteromer modulates the D1R effect through a PLC pathway.
Introduction
Dopamine produced in the renal proximal tubule from circulating L-DOPA acts as a paracrine and autocrine hormone to regulate greater than 50% of sodium excretion in animals and humans on moderately high salt intake.1-3 Dopamine exerts its natriuretic effect by acting with cell surface receptors and intracellular pathways to stimulate intracellular adenylyl cyclase (AC) and phospholipase C (PLC) activities and inhibit sodium transport. There are 5 dopamine receptors expressed in renal proximal tubule cells (RPTCs): the D1-like (D1R and D5R) and the D2-like (D2R, D3R, D4R) receptors, that interact with other systems including the renin angiotensin system to regulate renal sodium excretion.4, 5 In mice, a deficiency in local production of dopamine results in hypertension and a decrease in longevity.6
The D5R is of particular interest because it has a 10-fold higher affinity for dopamine than D1R but has an 80% homology in the transmembrane domain and a 30% homology in the N and C termini.7 Both D1R and D5R are linked to GαS.7 The D1R, but not D5R, also couples to GO8 and GOlf9 while the D5R but not D1R, couples to GZ10 and Gα12/13.11 In the rat forebrain, D1-like receptors couple to both GαS and Gαq while in the rat hippocampus and amygdala, D1-like receptors couple only to Gαq.12 In contrast, in hippocampal and brain cortical and striatal tissues of D5R-/- mice, PLC is not activated in the brain following stimulation with dopamine, the non-selective D1R/D5R agonist SKF38393, or the PLC-selective D1R/D5R agonist SKF83959.13, 14 This suggests that in specific areas in the brain, D1R couples preferentially to AC and the D5R couples to PLC.15
Which D1-like receptor subtype is linked to Gαq and PLC in cells in which both D1-like receptors are expressed is not clear. While the D1R and D5R may have different anatomical distributions in the brain,16 both the renal D1R and D5R are found in specific nephron segments (proximal convoluted and straight tubules, thick ascending limb of Henle, distal convoluted tubule and cortical collecting duct), suggesting a possible interaction between these receptors.17 We have reported that in renal cortical membranes, D1-like receptors are linked to Gαq and that PLC activity can be stimulated by D1-like receptors independent of AC.18 Others have reported that the linkage of renal D1-like receptors to PLC may be observed to a greater extent in rats fed a high salt diet.19 We have previously shown that both D1R and D5R are expressed in RPTCs.20 However, little is known about their physical association and the relative contribution of each receptor on AC and PLC signaling in a single cell type. Studying the D1R and D5R in a single cell type is important because similarities and differences in signaling pathways may be tissue specific (vide supra).
Deletion of either D1R (D1R-/-)21 or D5R (D5R-/-)22 gene in mice results in elevation of blood pressure. Increased salt intake further increases the high blood pressure of D5R-/-mice.23, 24 The effect of salt intake on blood pressure in D1R-/- mice has not been reported. Since both the D1R and D5R are important in the control of blood pressure,3-5, 17, 24-26 in part by regulation of renal sodium transport, we further examined the AC and PLC pathways and their relationship to NHE3 and NaKATPase using agonists that have selectivity to D5R, AC, and PLC and silencing of D1R or D5R (see our model display of these pathways and agonists). These studies were performed using human RPTCs with normal D1R and AC coupling, since a fully functional D1R is necessary for D1R/D5R agonist-mediated inhibition of NHE3 and NaKATPase.27
Results
We demonstrated that the D1R and D5R were physically associated in the same macromolecular protein complex using a co-immunoprecipitation method (Figure 1). We further demonstrated that the amount of D5R protein pulled down using the D1R antibody was increased following fenoldopam (FEN, 1 μmol/L, 30-min) stimulation (P<0.001, N=6, one immunoblot is shown in Figure 1 inset). Further evidence of association is seen by reciprocal co-immunoprecipitation with D1R and D5R, and adequate washing is demonstrated by inclusion of the appropriate non-specific IgG antibody controls in the initial immunoprecipitation (Figure S1).
Figure 1. Co-Immunoprecipitation of D1R and D5R.
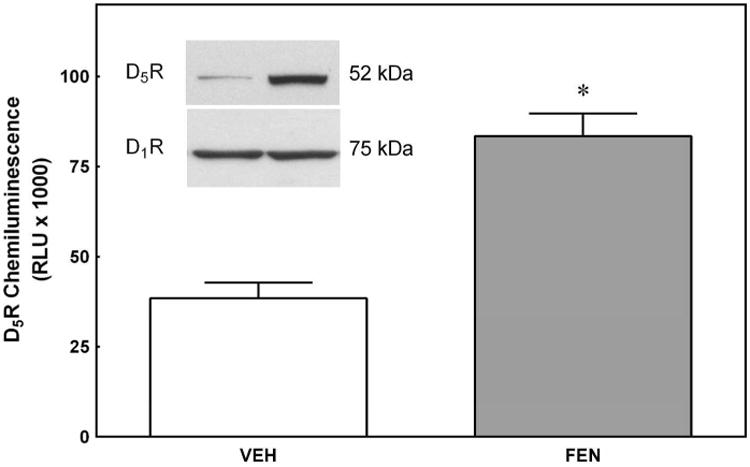
Immortalized human RPTCs were incubated with and without fenoldopam (FEN, D1R/D5R agonist, 1 μmol/L, 30 min) and the physical interaction between the D1R and D5R was determined by co-immunoprecipitation and western blotting. FEN induced an 111.7±9.4% increase in D1R and D5R protein-protein interaction using a rabbit anti-D1R immunoprecipitating antibody and a goat anti-D5R detection antibody (P<0.001, N=6 per group).
Confocal microscopy was used to determine if the two receptors co-localize in renal cortical proximal tubules. The confocal immunofluorescence images demonstrated that the D1R and D5R were both highly expressed in the proximal tubule and showed a similar sub-cellular localization, i.e., sub-apical position at the base of the microvilli (Figure S2). The composite images of both human and rat tubules demonstrated extensive co-localization in the sub-apical region. This sub-apical localization of the two receptors was verified by co-staining with a sub-apical marker α-adaptin (data not shown).
FRET analysis of these experiments was not possible because the two antibodies that work well on fixed tissue bind to either intracellular (D1R) or extracellular (D5R) epitopes that are on opposite sides of the phospholipid bilayer and are therefore outside the distance measurable by FRET. We therefore investigated their possible heterooligomerization using live-FRET microscopy. Figure S3 demonstrates live-cell sensitized emission-corrected FRET analysis of two different color-GFP fusion proteins of D1Rs and D5Rs heterologously expressed in HEK293 cells. A positive corrected FRET signal suggests that the two receptors are within 10 nm of each other. We verified these findings in lightly fixed non-permeabilized human RPTCs (Figure 2), using two different extracellular epitope-specific fluorescently-labeled antibodies that should bind to both epitopes either on the D1R or the D5R. These two antibodies should be found on the same side of the phospholipid bilayer and therefore can be used for FRET analysis. The photomicrographs in Figure 2 demonstrated a clear cell surface FRET signal. The addition of FEN (1μmol/L, 30-min) increased the FRET signal and the amount of D1R at the cell surface.
Figure 2. Fixed cell surface D1R / D5R FRET measurement in non-permeabilized human RPTCs.
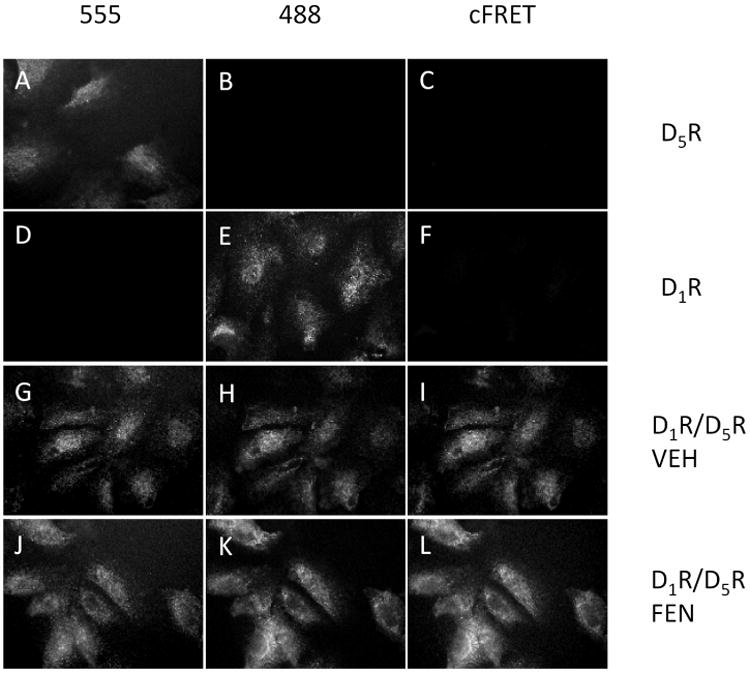
The first row of images indicates that when Alexa 555-labeled D5R antibody was added to the RPTCs, a clear signal was measured in the Alexa 555 channel (A), and there was no spectral bleedthrough into the Alexa 488 filter channel (B) and no measurable signal in the corrected FRET (cFRET) channel (C), as expected. The second row of images indicates that the same was true when the Alexa 488-labeled D1R antibody was added to RPTCs. There was a clear signal measured in the Alexa 488 channel (E), no spectral bleedthrough into the Alexa 555 channel (D) and no measurable signal in the cFRET channel (F). In the third row, RPTCs were first incubated with vehicle (VEH) and then with Alexa 555-labeled D5R and Alexa 488-labeled D1R antibodies. A clear signal was measured in the Alexa 555 (G) and Alexa 488 channels (H), and a clear cFRET signal was detected in the cFRET channel (I). In the bottom row, RPTCs were incubated with the D1R/D5R agonist fenoldopam (FEN, 1 μmol/L, 30 min) before fixing and staining with the two antibodies. An increase in the mean intensity of the Alexa 488 channel indicates that the D1R was recruited to the cell surface (K compared to H). Additionally there was an increase in cFRET signal upon addition of FEN (L compared to I). Images were collected using a 60× water immersion objective lens.
A new D5R antagonist (LE-PM436)28 was utilized to distinguish signaling of D5Rs from D1Rs. To validate its selectivity, we used HEK293 cells that were stably transfected with either D1R or D5R cDNA and expressed these receptors at normal physiological concentrations, measured at 3 pmoles/mg membrane protein.29 cAMP production was measured following SKF38393 (non-selective D1R/D5R receptor agonist, 1 μmol/L, 30-min) stimulation and blocked with LE300 (non-selective D1R/D5R receptor antagonist) and LE-PM436 (selective D5R antagonist) (Figure 3). The addition of LE300 (10 μmol/L) inhibited SKF-stimulated intracellular cAMP production in both D1R and D5R-expressing HEK293 cells, confirming that it is not selective to either D1R or D5R. LE-PM436 (1 nmol/L) inhibited SKF-stimulated cAMP production by 84.0 ±1.2% in D5R -expressing HEK293 cells, but did not inhibit the SKF-stimulated cAMP production in D1R-expressing HEK293 cells, confirming that LE-PM436 is a D5R-selective antagonist (P<0.001 vs SKF+VEH, N=8 per group). These studies also confirm the coupling of either D1R or D5R to AC, however the amount of cAMP produced by D5R-transfected HEK293 cells in response to SKF was 26.4 ±0.5% the amount measured from the D1R-transfected cells (N=18, P<0.001, data not shown), despite similar receptor expression (using Bodipy630 SKF83566 binding, N=12, data not shown). Basal cAMP levels were 1.04±0.08 pmoles/mg protein in D1R-expressing HEK293 cells, and 1.13±0.03 pmoles/mg protein in D5R-expressing HEK293 cells. Induced levels for D1R-expressing HEK293 cells were 15.52±1.07 pmoles/mg protein following SKF exposure (30-min, 1 μmol/L) and induced levels of D5R-expressing HEK293 cells were 4.01±0.08 pmoles/mg protein.
Figure 3. Selective Inhibition of D5R-transfected HEK293 cells with LE-PM436.
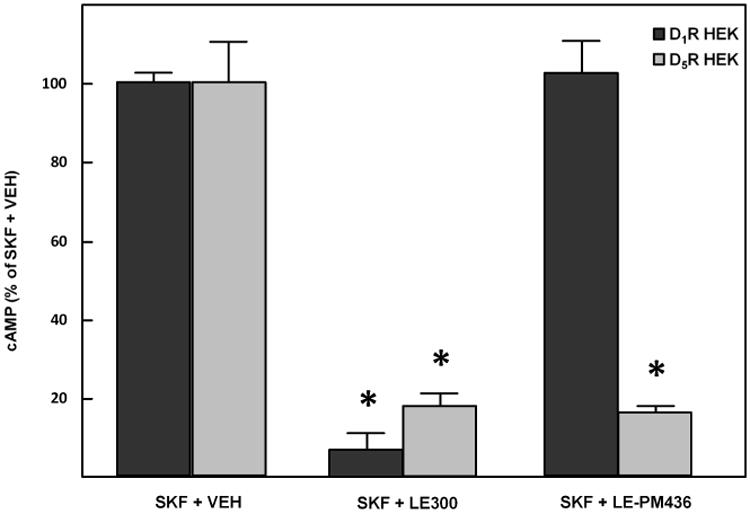
The D1R/D5R antagonist LE300 (10 μmol/L, 30 min) inhibited the stimulatory effect of SKF38393 (D1R/D5R agonist, 10 μmol/L, 30 min) on intracellular cAMP production in both D1R- and D5R- transfected HEK293 cells. LE-PM436 (1 nmol/L, 30 min) only inhibited SKF-induced cAMP production in the D5R-transfected HEK293 cells (84.0 ±1.2% decrease, *P<0.001 vs VEH, N=8 per group).
Intracellular calcium, cAMP, and PLC levels were measured in RPTCs in response to FEN with and without the antagonists LE300 (D1R and D5R), U73122 (PLC) and LE-PM436 (D5R) (Figure 4). The left Y-axis depicts the ICUE3 (measure of intracellular cAMP accumulation) and CYPHR (measure of intracellular PLC activation state), normalized to vehicle (VEH). The right Y-axis depicts the intracellular ratiometric Ca++ concentration measured by FURA-2. Stimulation with FEN (1 μmol/L, 20-min) increased the cAMP levels, PLC activity, and Ca++ levels in RPTCs (#P<0.001 vs VEH, N=6 for ICUE3/CYPHR, N=11 for FURA-2). The addition of the D1R/D5R antagonist LE300 (10 μmol/L, 20-min) blocked the FEN-mediated increase of all 3 variables (*P<0.001 vs FEN, N=6 for ICUE3/CYPHR, N=17 for FURA-2). Both the PLC inhibitor U73122 (10 μmol/L, 20 min) and the D5R-specific inhibitor LE-PM436 (1 nmol/L, 20-min) blocked the FEN-mediated PLC activation but did not affect cAMP levels (*P<0.001 vs FEN, N=3-14). The D1R/D5R receptor AC-specific activator SKF83822 (10 μmol/L, 20-min) caused an increase only in cAMP levels and not Ca++ levels or PLC activity (#P<0.001 vs VEH, N=3-17). By contrast, the PLC-activator SKF83959 (10 μmol/L, 20-min) increased PLC activity and Ca++ levels but not cAMP (#P<0.001 vs VEH, N=4-17) levels. When these two agonists (SKF83822 and SKF83959) were combined there was no additive effect (data not shown).
Figure 4. D1R and D5R Specific Signaling to AC or PLC.
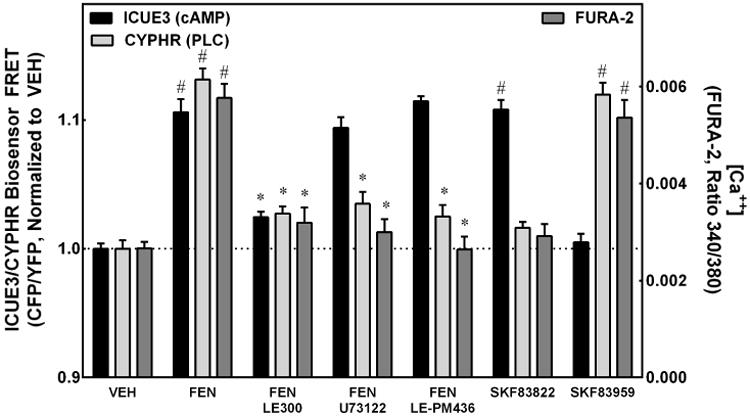
ICUE3 (measure of intracellular cAMP accumulation) and CYPHR (measure of intracellular PLC activation state) are depicted on the left Y-axis, normalized to vehicle (VEH). The right Y-axis depicts the intracellular Ca++ using FURA-2. Stimulation with the D1R/D5R agonist fenoldopam (FEN, 1 μmol/L, 20 min) increased intracellular Ca++ and cAMP levels and activated PLC (#P<0.001 vs VEH, N=6 for ICUE3/CYPHR, N=11 for FURA-2). Addition of the D1R/D5R antagonist LE300 (10 μmol/L, 20 min) blocked the FEN-mediated increase of all 3 variables (*P<0.001 vs FEN, N=6 for ICUE3/CYPHR, N=17 for FURA-2). The PLC inhibitor U73122 (10 μmol/L, 20 min) and the D5R-specific inhibitor LE-PM436 (1 nmol/L, 20 min) both blocked the FEN-mediated increase in intracellular Ca++ and PLC activity but did not affect cAMP levels (*P<0.001 vs FEN, N=3-14). The AC-specific activator SKF83822 (10 μmol/L, 20 min) caused an increase only in cAMP (#P<0.001 vs VEH, N=3-17) and the PLC-specific activator SKF83959 (10 μmol/L, 20 min) increased PLC activity and Ca++ levels (#P<0.001 vs VEH, N=4-17).
We next utilized siRNA technology. The efficacy of the siRNA is demonstrated in Figure S4, using immunofluorescence staining of transfected RPTCs. RPTCs that were transfected with D1R or D5R siRNA had a marked decrease in their respective expression levels compared to scrambled (SCR) RNA control, using the same timing and format as the sodium assays (P<0.001 vs SCR, N=4). Figure 5 shows that D1R siRNA blocked the FEN-stimulated increase in cAMP accumulation and PLC activity (*P<0.05 vs SCR, N=16 for ICUE3, N=4 for CYPHR). By contrast, the D5R siRNA blocked only the FEN-mediated increase in PLC activity (*P<0.05 vs SCR, N=4), while the combination of the D1R and D5R siRNAs blocked both signaling pathways (*P<0.05 vs SCR, N=14 for ICUE3, N=4 for CYPHR). These data indicate that in RPTCs, the D1R is coupled to both AC and PLC whereas the D5R is linked mainly to PLC. This is in contrast to the linkage of D5R to AC in HEK293 cells heterologously expressing D5R.
Figure 5. D1R vs. D5R siRNA Effects on AC and PLC pathways.
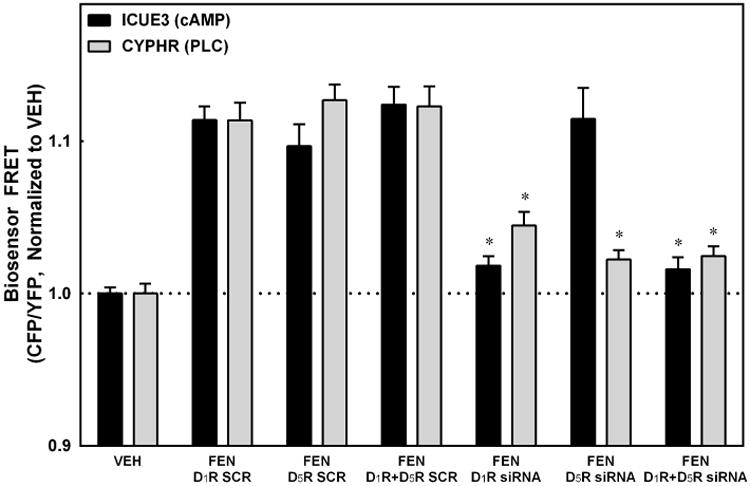
D1R siRNA blocked the fenoldopam (FEN, D1R/D5R agonist) -stimulated increases in cAMP level and PLC activity (*P<0.05 vs SCR, N=16 for ICUE3, N=4 for CYPHR). D5R siRNA blocked only the PLC effect (*P<0.05 vs SCR, N=4), and the combination of the D1R and D5R siRNAs blocked both pathways (*P<0.05 vs SCR, N=14 for ICUE3 and N=4 for CYPHR).
We next determined how selective D1R and/or D5R stimulation or reduction with siRNA would ultimately affect sodium influx via NHE3 or sodium efflux via NaKATPase (Figure 6). The D1R/D5R agonist FEN (1 μmol/L, 30-min) inhibited both NHE3-mediated sodium influx and NaKATPase-mediated sodium efflux in immortalized RPTCs (*P<0.0001 vs VEH, N=6, Figure 6, Panel A). The addition of U73122 (10 μmol/L), LE-PM436 (1 nmol/L), or LE300 (10 μmol/L), by themselves did not affect sodium influx or efflux (data not shown) but their co-incubation with FEN returned the sodium influx and efflux to VEH levels. The D1-like receptor AC-specific activator SKF83822 (10 μmol/L, 20-min) inhibited both NHE3 and NaKATPase (#P<0.001 vs VEH, N=6). By contrast, the PLC-activator SKF83959 (10 μmol/L, 20-min) did not inhibit either NHE3 or NaKATPase activity. This suggests that the primary inhibitory signaling pathway for NHE3 and NaKATPase is via AC. The combination of SKF83822 and SKF83959 inhibited both NHE3 and NaKATPase (*P<0.0001 vs VEH, N=6), and to a greater extent than SKF83822 alone. As shown in Figure 6 (Panel B), the FEN-mediated inhibition of sodium influx and efflux were reversed by siRNA specific to D1R, D5R, or both D1R and D5R (*P<0.05 vs SCR, **P<0.001 vs SCR, N=6). These data indicate that both the cAMP and PLC pathways are necessary for inhibition of sodium influx and efflux, involving both D1R and D5R.
Figure 6. Sodium Transport Assays.
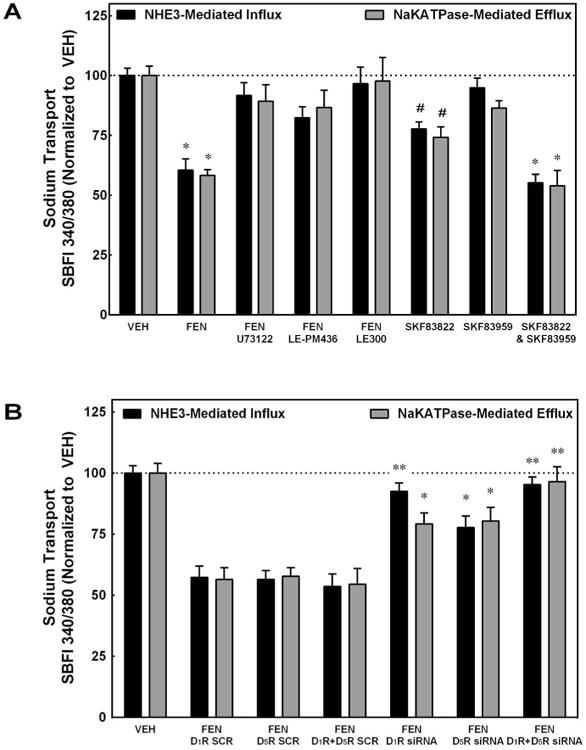
PANEL A: The D1R/D5R agonist fenoldopam (FEN, 1 μmol/L, 30 min) inhibited both NHE3-mediated sodium influx and NaKATPase-mediated sodium efflux in immortalized RPTCs (*P<0.0001 vs VEH, N=6). The co-addition of U73122 (PLC inhibitor, 10 μmol/L), LE-PM436 (D5R-specific inhibitor, 1 nmol/L), or LE300 (D1R/D5R antagonist, 10 μmol/L) returned the sodium influx and efflux to VEH levels. The AC-specific activator SKF83822 (10 μmol/L, 20 min) inhibited both NHE3 and NaKATPase (#P<0.001 vs VEH, N=6). The PLC-specific activator SKF83959 (10 μmol/L, 20 min) did not inhibit either NHE3 or NaKATPase but the combination of SKF83822 and SKF83959 inhibited both NHE3 and NaKATPase and to a greater extent than SKF83822 alone (*P<0.0001 vs VEH, N=6). PANEL B: The FEN-mediated inhibition of sodium efflux can be partially reversed by siRNA specific to D1R or D5R, or fully reversed by the combination of D1R and D5R siRNAs (*P<0.05 vs SCR, **P<0.001 vs SCR, N=6). D1R siRNA alone reversed sodium influx as effectively as the combination of the D1R and D5R siRNAs.
In order to control for the effects of the antagonists alone (U73122, LE-PM436 and LE300), each one was included in both the sodium influx and efflux assays and showed no effect in either assay (data not shown). Antisense oligos to the D1R or D5R20 recapitulated the effects we observed with the specific inhibitors of either D1R or D5R (data not shown).
Discussion
The interplay between the D1R and D5R, two closely related cell surface receptors that share the same endogenous agonist (dopamine), is important in understanding the role of dopamine in cell function. The D1R and D5R are expressed in different areas of the brain, which suggests that the D5R has a distinct role in neurotransmission when compared to the D1R.16 However, the direct interaction of endogenously expressed D1R and D5R has not been well studied. Dopamine receptors outside the central nervous system are often expressed within the same cells. For example, the D1R and D5R are both expressed in the tunica media of systemic arteries30 and both are expressed in almost all segments of the nephron where active sodium transport occurs.17 D1R and D5R heterologously co-expressed in HEK293 cells have been found to hetero-oligomerize.31
In our current studies, we demonstrated that the D1R and D5R were not only present in RPTCs, but they co-localized, co-immunoprecipitated, and directly physically interacted, as demonstrated by FRET microscopy. The co-localization of the D1R and D5R was seen in a compartment at the base of the microvilli in the proximal tubule in human and rat kidneys. Microvilli are key structures in the renal proximal tubule that serve to increase the luminal membrane surface area for protein and peptide uptake and catabolism and ion transport. Microvilli also serve as sensors for sampling and adjusting the concentration of various solutes within the glomerular filtrate in response to mechanotransduction.32 The D5R and D1R were found clustered in a tight band in the sub-microvilliary space, where they could be rapidly recruited to the plasma membrane in response to cell surface receptor stimulation. We demonstrated in the current report that the D1R/D5R agonist FEN caused recruitment of the D1R to the cell surface plasma membrane, corroborating our previous report using surface biotinylation and western blot analysis.33
We have reported that salt-sensitive hypertension in humans correlates with defective recruitment of D1R to the cell surface of urinary RPTCs when their intracellular sodium levels were increased.34 In contrast, we found that the D5R was not recruited to the cell surface but appears to have a constant cell membrane concentration not altered by agonist stimulation.35 We further found that this constant level of D5R at the cell membrane was lower in RPTCs whose D1R coupling to AC was defective.35 The D5R has not been demonstrated to stimulate cAMP accumulation in the kidney but has been shown to couple to AC in heterologous overexpression systems such as the HEK293 cells shown in this report. Overexpression of proteins can result in promiscuous associations and therefore, we studied D1R and D5R endogenously expressed in the same cell, i.e., RPTC. These studies are the first demonstration of the blocking of cellular D5R-coupled second messenger activity using a selective D5R antagonist. LE-PM436 and siRNA to the D5R demonstrated similar blocking effects in all experimental assays further confirming the selectivity of LE-PM436 to the D5R. However, LE-PM436 may have an important advantage over siRNA in studying the D5R because the long-term silencing of the D5R expression by siRNA cannot be readily reversed. Our current studies showed for the first time in RPTCs that endogenously express both D1R and D5R that the D5R preferentially stimulated PLC activity and increased intracellular Ca++, effects that were inhibited by the D5R selective antagonist LE-PM436. The independence of these pathways is highlighted by the data that demonstrated that SKF83822 stimulated AC but not PLC, while SKF83959 stimulated PLC but not AC. Also, neither SKF83822 nor SKF83959 inhibited the pathway that it does not stimulate. This distinction is important because there is a PKA and PKC cross-talk following D1R36 and D1-like receptor 37 stimulation. Indeed in the current study, PLC stimulation was blocked when the D1R was silenced. It has been shown that dopaminergic inhibition of NaKATPase via PLC and PKC is Na+ dependent.38
Previous reports have demonstrated that D1-like receptor stimulation inhibited various ion transporters and exchangers in the renal proximal tubule luminal membrane (NHE3, Na+Pi co-transporter, and the Cl-/HCO3- exchanger) and ion exchanger and sodium pump in the basolateral membrane (NaKATPase, and the Cl-/HCO3- exchanger).26 However, it is not known which D1-like receptor subtype, D1R or D5R, mediates these effects. In D5R deficient mice, distal tubular sodium transporters/channels (Na+K+2Cl-co-transporter, Na+Cl- co-transporter, and the α and γ subunits of the epithelial sodium channel) were increased,39 suggesting a tonic inhibition of the activity of these proteins via the D5R. In the current experiments, we showed that in addition to a functional D1R, D5R stimulation was also necessary for the inhibition of NHE3-mediated sodium influx and NaKATPase-mediated sodium efflux following D1R/D5R receptor stimulation. Taken together with our previous studies demonstrating that the D5R is responsible for the tonic down-regulation of the anti-natriuretic angiotensin II type 1 receptor (AT1R) in rat and human RPTCs, these data suggest that the D1R is the mediator, while the D5R as part of the D1R/D5R heteromer and PLC signaling acts as the modulator, of the inhibition of sodium transport. Our proposed model for these pathways and their roles in sodium transport (NHE3 and NaKATPase) regulation is shown in Figure 7.
Figure 7.
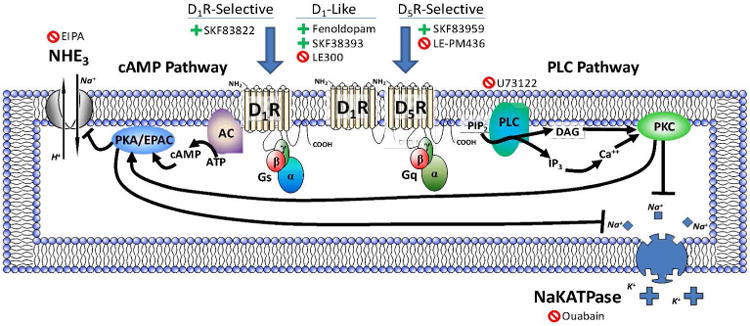
This model lists the D1R and D5R agonists and inhibitors and depicts our proposed pathways and heteromeric structure in relation to signaling and regulation of sodium transport in a human renal proximal tubule cell (RPTC). D1R signaling through adenylyl cyclase (AC) and cAMP and PKA or EPAC (exchange protein activated by cAMP) can inhibit both NHE3 and NaKATPase, while the heteromeric D1R/D5R complex signaling through PLC acts to positively modulate the D1R activity. In RPTCs, SKF83822, which stimulates adenylyl cyclase (AC), may be a D1R selective agonist while SKF83959, which stimulates phospholipase C (PLC), may be a D5R selective agonist and inhibited by LE-PM436, the newly described D5R-selective antagonist. Fenoldopam and SKF38393 stimulate both D1R and D5R while LE300 inhibits both D1R and D5R. U73122 inhibits PLC activity, ouabain inhibits NaKATPase activity and EIPA inhibits NHE3 activity.
Previous studies on the physiological effects of dopamine and synthetic dopamine agonists and antagonists have been confounded by the lack of a selective antagonist to either receptor. The recent availability of LE-PM436 will now enable the in vivo study of the selective roles of the renal D1R and D5R receptors. An overactive renal renin angiotensin system (RAS) and diminished function of the renal dopaminergic system has been associated with hypertension and salt-sensitivity in-vivo in mouse, rats, and humans.40 One class of anti-hypertensive pharmaceutical drugs that affect these systems and consequently blood pressure in all three species are AT1R blockers. One of the many beneficial effects of AT1R blockers may be mediated through the pathways described in this paper. Higher expression of angiotensinogen in high salt conditions, as well as numerous SNPs in the RAS system such as ACE, angiotensinogen or AT1R, could lead to overactive AT1R stimulation, downregulation of the D5R and subsequent loss of D5R-PLC specific natriuresis.41 Use of AT1R blockers under high salt conditions would allow the increased conversion of L-dopa to dopamine in the proximal tubule to stimulate both the D1R and D5R to aid in natriuresis and lower blood pressure since there would be diminished counter-regulation by the AT1R. The implications of this paper may also suggest reasons why AT1R blockers are not always effective; patients with proximal tubule D1R -AC uncoupling may have diminished high salt D5R-PLC induction of natriuresis. In animal models, the drug LE-PM436 would allow testing of these hypotheses in acute studies that otherwise would be difficult with siRNA or knockout models where gene compensation could alter the proper interpretation of the results.
Methods
RPTC Culture
RPTCs were obtained from normal tissue from nephrectomies in human subjects, under an institutional review board-approved protocol according to the Declaration of Helsinki, Title 45, Part 46, and U.S. Code of Federal Regulations. Cell lines were immortalized as previously described33, 42, 43 and demonstrated only proximal tubule-specific characteristics as extensively detailed in our previous publication.27 We have identified two distinct sub-populations of RPTCs, those that have a D1R with normal AC coupling, and those with defective D1R to AC coupling (uncoupled). We utilized only the normally-coupled RPTC lines i7448, i16, and i22 in the current studies, since a fully functional D1R is necessary in our sodium transport assays.27
HEK293 Cell Culture and Transfection
Human embryonic kidney (HEK293) cells were obtained from ATCC (Manassas, VA) and grown in DMEM high glucose with 10% FBS. They were stably transfected with human D1R and D5R as previously described23, 44 and these cells were used to confirm the specificity of LE-PM436 for the D5R. For transient transfection of GFP fusion constructs used in the live FRET analysis, the D1R and the D5R were PCR-amplified from cDNA clones obtained from the Missouri S&T cDNA Resource Center (www.cdna.org) and subcloned into the pEGFP-N1 vector (Clontech) that had the EGFP replaced with either CyPet for D5R or YPet for D1R.
Pharmacological Agents
The D1-like (D1R/D5R) receptor agonists, FEN and SKF38393, were used along with D1-like (D1R/D5R) receptor antagonist LE300 and the novel selective D5R antagonist LE-PM436. PLC inhibitor U73122, cAMP-specific activator SKF83822, and PLC-specific activator SKF83959 were also used. Details about these and the ouabain and EIPA used in the sodium transport assays (including source information) can be found in Table S1 in the Online Supplement.
Co-Immunoprecipitation of D1R and D5R
Co-immunoprecipitation of the two receptors was performed as previously described 33 using rabbit D1R antibody (1:50 dilution, sc-14001, Santa Cruz Biotechology). The detection step used goat polyclonal anti-D5R (1:100 dilution, sc-1440 Santa Cruz Biotechology), followed by a donkey anti-goat IR Dye 800 secondary antibody (1:15,000, LI-COR Biosciences). Non-specific rabbit IgG (Sigma) was used as a negative control immunoprecipitating antibody and no D5R-specific signal was detected. Lack of cross reactivity with the respective antibodies was verified using the stably transfected D1R-HEK293 and D5R-HEK293 cells. The FEN effect was measured after 30-min (1 μmol/L FEN).
Immunofluorescence
The basic immunofluorescent staining procedure has been reported.27 The D1R antibody used on fixed tissue was from Dr. Jose's laboratory.45 The 3rd extracellular loop-specific D1R antibody used for cell surface labeling was from Dr. Carey's laboratory.46,47 The 3rd extracellular loop-specific D5R antibody used in fixed tissue and for cell surface labeling was from Millipore (AB 9509). Details about both staining procedures are in the Online Supplement.
Sensitized Emission FRET Microscopy
Sensitized emission Fluorescent Resonance Energy Transfer (FRET) analysis of the physical association of D1R and D5R was performed using two different systems. One system utilized live-cell microscopy of HEK293 cells transiently transfected with D1R-YPet (yellow fluorescent protein) and D5R-CyPet (cyan fluorescent protein) fluorescent protein fusion constructs. The second set of experiments was performed on fixed non-permeablized RPTCs using extracellular epitope-specific and directly-fluorescently-labeled antibodies to the D1R and D5R using Alexa 488 and Alexa 555 dyes, respectively. Live-cell imaging was performed using a Bioptechs Delta T stage heating system and Bioptechs objective heater. Spectral bleedthrough calculations and corrected FRET (cFRET) imaging was performed according to the FRET Module of Slidebook 4.2. Verification of proper microscope setup and calculations was provided by using both positive (ICUE3 FRET biosensor for CyPet/YPet and ICUE-YR for 488/555) and negative controls (co-transfected CyPet and YPet non-fusion fluorescent proteins). Details about filters and FRET analysis are in the Online Supplement.
Fluorescent Biosensors for cAMP Accumulation (ICUE3) and PLC Activation (CYPHR)
cAMP accumulation and PLC activation were measured by intracellular real-time kinetic assays using the fluorescent biosensors ICUE3 and CYPHR, respectively. This involved transfecting RPTCs with a plasmid containing a novel fluorescence resonance energy transfer sensor for cAMP (ICUE3) or Addgene plasmid 14864 for PLC activation (CYPHR) according to the methods of Violin et al.48,49
The ICUE biosensor contains a cAMP binding domain of EPAC1, a known cAMP target in proximal tubule cells necessary for NHE3 inhibition.50 RPTCs were electroporated according to our previously optimized protocol.33 They were allowed to recover in culture media for 24-hr before imaging. Cells were treated with combinations of agonists and antagonists and imaged with confocal microscopy every 30 sec for 20-min. The final read was used to generate the data in Figures 4 and 5.
siRNA
100 nmol/L D1R siRNA (target sequence: 5′ CAUCUCAUCCUCUGUAAUA 3′), D1R scrambled control (5′ GCAUCUUUACACCACUUAU 3′), D5R siRNA (target sequence: 5′ CCCUUCUUCAUCCUUAACU 3′) or D5R scrambled control (5′ CUCCAUUCCCAUCUUCUAU 3′) was transfected for 24-hr into RPTCs by electroporation as previously published.33
NHE3-mediated Sodium Influx Assay
Details and specificity of this assay, where we use ouabain to inhibit NaKATPase and measure sodium accumulation in RPTCs, was previously published27 and is described in the Online Supplement. The figures were made using data collected at the 30-min time point.
NaKATPase-mediated Sodium Efflux Assay
The detailed method used to measure the rate of sodium efflux was previously published33 and is outlined in the Online Supplement. The figures were made using data collected at the 30-min time point.
Calcium Imaging
RPTCs were labeled with fura-2 AM (Invitrogen) using identical conditions established for the SBFI labeling as stated in the NHE3-mediated sodium influx assay. The fura-2 here simply replaces the SBFI used in the influx assay. The filter set and imaging parameters are also identical for the two assays. Data for this figure was collected at the 20-min time point.
cAMP Assay
cAMP accumulation was measured after 30-min of agonist stimulation (SKF38393, see Table S1) with IBMX (500 μmol/L) using a commercial ELISA kit (Cayman Chemical) as previously described.33 Antagonists LE-PM436 and LE300 (see Table S1) were added 10-min prior to the agonist incubation.
Statistical Analysis
The data are expressed as mean ± SE. Comparisons within and among groups were made by repeated measures or factorial ANOVA, respectively, followed by Holm-Sidak or Duncan's test. Student's t-test was used for two-group comparisons. P values of <0.05 were considered significant.
Supplementary Material
Figure S1. Increase in D1R and D5R Co-immunoprecipitation after D1-like receptor agonist stimulation with fenoldopam (FEN). Renal proximal tubule cell lysates were immunoprecipitated with either a rabbit polyclonal anti-D1R antibody or an equal amount of non-specific rabbit IgG (NSR IgG) and western blotted for D5R using a goat polyclonal antibody. The reciprocal immunoprecipitation, using a goat polyclonal antibody against the D5R or non-specific goat IgG (NSG IgG), and western blot using a D1R rabbit polyclonal antibody is also shown in the lower blot. Adequate washing is evidenced by lack of immunoreactivity in the non-specific IgG lanes. An increase in immunoreactivity in the FEN lane suggests an increase in association after agonist stimulation.
Figure S2. D1R and D5R Co-localization in Human and Rat Renal Proximal Tubules. Human (top row) and Sprague Dawley rat (bottom row) renal cortices were fixed and flash-frozen sections were used for immunofluorescent staining. The first column in blue (A and E) is an autofluorescent (AF) image used to delineate the transition between cytoplasm and brush border. The second column is the immunolocalization of the D1R primarily in a subapical position (B and F) at the base of the microvilli (green). The third column is the immunolocalization of the D5R also at a subapical area (C and G, red). The composite image shows the co-localization of the D1R and D5R precisely at the transition of cytoplasm and brush border (D and H, yellow). The white bar in D and H represents 10 microns.
Figure S3. Live-cell FRET Measurement of D1R -YPet and D5R -CyPet Fusion Proteins in Transiently Transfected HEK293 Cells. The first row of images indicates that when D5R-CyPet plasmid was transfected into HEK293 cells, a clear signal was measured in the CyPet channel (A); there was no spectral bleedthrough into the YPet channel (B) and there was no measurable signal in the corrected FRET (cFRET) channel (C), as expected. The second row of images indicates that the same was true for the D1R-YPet-transfected HEK293 cells. There was a clear signal measured in the YPet channel (E); there was no spectral bleedthrough into the CyPet channel (D) and no measurable signal in the cFRET channel (F). In the bottom row, when the HEK293 cells were co-transfected with D5R-CyPet and D1R-Ypet, a clear signal was measured in the CyPet (G, arrow) and YPet channels (H, arrow), and a clear cFRET signal was detected only in the co-transfected cell (I, arrow). Images were collected using a 100× oil immersion objective lens.
Figure S4. D1R and D5R Immunofluorescent Staining in RPTCs Transfected with D1R and D5R siRNA or Scrambled Control (SCR). Cells were transfected with either D1R or D5R specific siRNA (100 nmol/L) or SCR control and 48 hrs later were fixed and stained for either D1R or D5R. Both D1R and D5R siRNAs markedly decreased their respective expression levels compared to SCR control (P<0.001 vs SCR, N=4).
Table S1. Pharmacological Agents
Acknowledgments
Sources of Funding: This work was funded by National Institutes of Health grants HL023081, HL092196, HL074940, DK039308.
Footnotes
Supplementary information is available at Kidney International website.
Disclosure: The authors have no COI to disclose.
References
- 1.Siragy HM, Felder RA, Howell NL, et al. Evidence that intrarenal dopamine acts as a paracrine substance at the renal tubule. Am J Physiol. 1989;257:F469–477. doi: 10.1152/ajprenal.1989.257.3.F469. [DOI] [PubMed] [Google Scholar]
- 2.Pelayo JC, Fildes RD, Eisner GM, et al. Effects of dopamine blockade on renal sodium excretion. Am J Physiol. 1983;245:F247–253. doi: 10.1152/ajprenal.1983.245.2.F247. [DOI] [PubMed] [Google Scholar]
- 3.Jose PA, Eisner GM, Felder RA. Dopamine and the kidney: a role in hypertension? Curr Opin Nephrol Hypertens. 2003;12:189–194. doi: 10.1097/00041552-200303000-00010. [DOI] [PubMed] [Google Scholar]
- 4.Hussain T, Lokhandwala MF. Renal dopamine receptors and hypertension. Exp Biol Med (Maywood) 2003;228:134–142. doi: 10.1177/153537020322800202. [DOI] [PubMed] [Google Scholar]
- 5.Jose PA, Eisner GM, Felder RA. Renal dopamine receptors in health and hypertension. Pharmacol Ther. 1998;80:149–182. doi: 10.1016/s0163-7258(98)00027-8. [DOI] [PubMed] [Google Scholar]
- 6.Zhang MZ, Yao B, Wang S, et al. Intrarenal dopamine deficiency leads to hypertension and decreased longevity in mice. J Clin Invest. 2011;121:2845–2854. doi: 10.1172/JCI57324. [DOI] [PMC free article] [PubMed] [Google Scholar]
- 7.Sunahara RK, Guan HC, O'Dowd BF, et al. Cloning of the gene for a human dopamine D5 receptor with higher affinity for dopamine than D1. Nature. 1991;350:614–619. doi: 10.1038/350614a0. [DOI] [PubMed] [Google Scholar]
- 8.Kimura K, White BH, Sidhu A. Coupling of human D-1 dopamine receptors to different guanine nucleotide binding proteins. Evidence that D-1 dopamine receptors can couple to both Gs and G(o) J Biol Chem. 1995;270:14672–14678. doi: 10.1074/jbc.270.24.14672. [DOI] [PubMed] [Google Scholar]
- 9.Corvol JC, Studler JM, Schonn JS, et al. Galpha(olf) is necessary for coupling D1 and A2a receptors to adenylyl cyclase in the striatum. J Neurochem. 2001;76:1585–1588. doi: 10.1046/j.1471-4159.2001.00201.x. [DOI] [PubMed] [Google Scholar]
- 10.Sidhu A, Kimura K, Uh M, et al. Multiple coupling of human D5 dopamine receptors to guanine nucleotide binding proteins Gs and Gz. J Neurochem. 1998;70:2459–2467. doi: 10.1046/j.1471-4159.1998.70062459.x. [DOI] [PubMed] [Google Scholar]
- 11.Zheng S, Yu P, Zeng C, et al. Galpha12- and Galpha13-protein subunit linkage of D5 dopamine receptors in the nephron. Hypertension. 2003;41:604–610. doi: 10.1161/01.HYP.0000057422.75590.D7. [DOI] [PubMed] [Google Scholar]
- 12.Jin LQ, Wang HY, Friedman E. Stimulated D(1) dopamine receptors couple to multiple Galpha proteins in different brain regions. J Neurochem. 2001;78:981–990. doi: 10.1046/j.1471-4159.2001.00470.x. [DOI] [PubMed] [Google Scholar]
- 13.Jin LQ, Goswami S, Cai G, et al. SKF83959 selectively regulates phosphatidylinositol-linked D1 dopamine receptors in rat brain. J Neurochem. 2003;85:378–386. doi: 10.1046/j.1471-4159.2003.01698.x. [DOI] [PubMed] [Google Scholar]
- 14.Sahu A, Tyeryar KR, Vongtau HO, et al. D5 dopamine receptors are required for dopaminergic activation of phospholipase C. Mol Pharmacol. 2009;75:447–453. doi: 10.1124/mol.108.053017. [DOI] [PMC free article] [PubMed] [Google Scholar]
- 15.Undieh AS. Pharmacology of signaling induced by dopamine D(1)-like receptor activation. Pharmacol Ther. 2010;128:37–60. doi: 10.1016/j.pharmthera.2010.05.003. [DOI] [PMC free article] [PubMed] [Google Scholar]
- 16.Ciliax BJ, Nash N, Heilman C, et al. Dopamine D(5) receptor immunolocalization in rat and monkey brain. Synapse. 2000;37:125–145. doi: 10.1002/1098-2396(200008)37:2<125::AID-SYN7>3.0.CO;2-7. [DOI] [PubMed] [Google Scholar]
- 17.Zeng C, Armando I, Luo Y, et al. Dysregulation of dopamine-dependent mechanisms as a determinant of hypertension: studies in dopamine receptor knockout mice. Am J Physiol Heart Circ Physiol. 2008;294:H551–569. doi: 10.1152/ajpheart.01036.2007. [DOI] [PMC free article] [PubMed] [Google Scholar]
- 18.Felder CC, Jose PA, Axelrod J. The dopamine-1 agonist, SKF 82526, stimulates phospholipase-C activity independent of adenylate cyclase. J Pharmacol Exp Ther. 1989;248:171–175. [PubMed] [Google Scholar]
- 19.Vyas SJ, Jadhav AL, Eichberg J, et al. Dopamine receptor-mediated activation of phospholipase C is associated with natriuresis during high salt intake. Am J Physiol. 1992;262:F494–498. doi: 10.1152/ajprenal.1992.262.3.F494. [DOI] [PubMed] [Google Scholar]
- 20.Gildea JJ, Wang X, Jose PA, et al. Differential D1 and D5 receptor regulation and degradation of the angiotensin type 1 receptor. Hypertension. 2008;51:360–366. doi: 10.1161/HYPERTENSIONAHA.107.100099. [DOI] [PubMed] [Google Scholar]
- 21.Albrecht FE, Drago J, Felder RA, et al. Role of the D1A dopamine receptor in the pathogenesis of genetic hypertension. J Clin Invest. 1996;97:2283–2288. doi: 10.1172/JCI118670. [DOI] [PMC free article] [PubMed] [Google Scholar]
- 22.Hollon TR, Bek MJ, Lachowicz JE, et al. Mice lacking D5 dopamine receptors have increased sympathetic tone and are hypertensive. J Neurosci. 2002;22:10801–10810. doi: 10.1523/JNEUROSCI.22-24-10801.2002. [DOI] [PMC free article] [PubMed] [Google Scholar]
- 23.Yang Z, Asico LD, Yu P, et al. D5 dopamine receptor regulation of reactive oxygen species production, NADPH oxidase, and blood pressure. Am J Physiol Regul Integr Comp Physiol. 2006;290:R96–R104. doi: 10.1152/ajpregu.00434.2005. [DOI] [PubMed] [Google Scholar]
- 24.Yang Z, Sibley DR, Jose PA. D5 dopamine receptor knockout mice and hypertension. J Recept Signal Transduct Res. 2004;24:149–164. doi: 10.1081/rrs-200029971. [DOI] [PubMed] [Google Scholar]
- 25.Yang Z, Asico LD, Yu P, et al. D5 dopamine receptor regulation of reactive oxygen species production, NADPH oxidase, and blood pressure. American Journal of Physiology - Regulatory Integrative & Comparative Physiology. 2006;290:R96–R104. doi: 10.1152/ajpregu.00434.2005. [DOI] [PubMed] [Google Scholar]
- 26.Zeng C, Yang Z, Asico LD, et al. Regulation of blood pressure by D5 dopamine receptors. Cardiovasc Hematol Agents Med Chem. 2007;5:241–248. doi: 10.2174/187152507781058708. [DOI] [PubMed] [Google Scholar]
- 27.Gildea JJ, Shah I, Weiss R, et al. HK-2 human renal proximal tubule cells as a model for G protein-coupled receptor kinase type 4-mediated dopamine 1 receptor uncoupling. Hypertension. 2010;56:505–511. doi: 10.1161/HYPERTENSIONAHA.110.152256. [DOI] [PMC free article] [PubMed] [Google Scholar]
- 28.Mohr P, Decker M, Enzensperger C, et al. Dopamine/serotonin receptor ligands. 12(1): SAR studies on hexahydro-dibenz[d,g]azecines lead to 4-chloro-7-methyl-5,6,7,8,9,14-hexahydrodibenz[d,g]azecin-3-ol, the first picomolar D5-selective dopamine-receptor antagonist. J Med Chem. 2006;49:2110–2116. doi: 10.1021/jm051237e. [DOI] [PubMed] [Google Scholar]
- 29.Yu P, Yang Z, Jones JE, et al. D1 dopamine receptor signaling involves caveolin-2 in HEK-293 cells. Kidney international. 2004;66:2167–2180. doi: 10.1111/j.1523-1755.2004.66007.x. [DOI] [PubMed] [Google Scholar]
- 30.Amenta F, Ricci A, Tayebati SK, et al. The peripheral dopaminergic system: morphological analysis, functional and clinical applications. Ital J Anat Embryol. 2002;107:145–167. [PubMed] [Google Scholar]
- 31.O'Dowd BF, Ji X, Alijaniaram M, et al. Dopamine receptor oligomerization visualized in living cells. J Biol Chem. 2005;280:37225–37235. doi: 10.1074/jbc.M504562200. [DOI] [PubMed] [Google Scholar]
- 32.Weinbaum S, Duan Y, Satlin LM, et al. Mechanotransduction in the renal tubule. Am J Physiol Renal Physiol. 2010;299:F1220–1236. doi: 10.1152/ajprenal.00453.2010. [DOI] [PMC free article] [PubMed] [Google Scholar]
- 33.Gildea JJ, Israel JA, Johnson AK, et al. Caveolin-1 and dopamine-mediated internalization of NaKATPase in human renal proximal tubule cells. Hypertension. 2009;54:1070–1076. doi: 10.1161/HYPERTENSIONAHA.109.134338. [DOI] [PMC free article] [PubMed] [Google Scholar]
- 34.Gildea JJ, Lahiff DT, Van Sciver RE, et al. A linear relationship between the ex-vivo sodium mediated expression of two sodium regulatory pathways as a surrogate marker of salt sensitivity of blood pressure in exfoliated human renal proximal tubule cells: the virtual renal biopsy. Clin Chim Acta. 2013;421:236–242. doi: 10.1016/j.cca.2013.02.021. [DOI] [PMC free article] [PubMed] [Google Scholar]
- 35.Gildea JJ, Wang X, Shah N, et al. Dopamine and Angiotensin type 2 receptors cooperatively inhibit sodium transport in human renal proximal tubule cells. Hypertension. 2012;60:396–403. doi: 10.1161/HYPERTENSIONAHA.112.194175. [DOI] [PMC free article] [PubMed] [Google Scholar]
- 36.Yu P, Han W, Villar VA, et al. Dopamine D1 receptor-mediated inhibition of NADPH oxidase activity in human kidney cells occurs via protein kinase A-protein kinase C cross talk. Free Radic Biol Med. 2011;50:832–840. doi: 10.1016/j.freeradbiomed.2010.12.027. [DOI] [PMC free article] [PubMed] [Google Scholar]
- 37.Gomes P, Soares-da-Silva P. Role of cAMP-PKA-PLC signaling cascade on dopamine-induced PKC-mediated inhibition of renal Na(+)-K(+)-ATPase activity. Am J Physiol Renal Physiol. 2002;282:F1084–1096. doi: 10.1152/ajprenal.00318.2001. [DOI] [PubMed] [Google Scholar]
- 38.Efendiev R, Budu CE, Cinelli AR, et al. Intracellular Na+ regulates dopamine and angiotensin II receptors availability at the plasma membrane and their cellular responses in renal epithelia. J Biol Chem. 2003;278:28719–28726. doi: 10.1074/jbc.M303741200. [DOI] [PubMed] [Google Scholar]
- 39.Wang X, Luo Y, Escano CS, et al. Upregulation of renal sodium transporters in D5 dopamine receptor-deficient mice. Hypertension. 2010;55:1431–1437. doi: 10.1161/HYPERTENSIONAHA.109.148643. [DOI] [PMC free article] [PubMed] [Google Scholar]
- 40.Armando I, Villar VA, Jose PA. Dopamine and renal function and blood pressure regulation. Compr Physiol. 2011;1:1075–1117. doi: 10.1002/cphy.c100032. [DOI] [PMC free article] [PubMed] [Google Scholar]
- 41.Gildea JJ. Dopamine and angiotensin as renal counterregulatory systems controlling sodium balance. Curr Opin Nephrol Hypertens. 2009;18:28–32. doi: 10.1097/MNH.0b013e32831a9e0b. [DOI] [PMC free article] [PubMed] [Google Scholar]
- 42.Felder RA, Sanada H, Xu J, et al. G protein-coupled receptor kinase 4 gene variants in human essential hypertension. Proc Natl Acad Sci USA. 2002;99:3872–3877. doi: 10.1073/pnas.062694599. [DOI] [PMC free article] [PubMed] [Google Scholar]
- 43.Sanada H, Jose PA, Hazen-Martin D, et al. Dopamine-1 receptor coupling defect in renal proximal tubule cells in hypertension. Hypertension. 1999;33:1036–1042. doi: 10.1161/01.hyp.33.4.1036. [DOI] [PubMed] [Google Scholar]
- 44.Yu P, Yang Z, Jones JE, et al. D1 dopamine receptor signaling involves caveolin-2 in HEK-293 cells. Kidney Int. 2004;66:2167–2180. doi: 10.1111/j.1523-1755.2004.66007.x. [DOI] [PubMed] [Google Scholar]
- 45.Xu J, Li XX, Albrecht FE, et al. Dopamine(1) receptor, G(salpha), and Na(+)-H(+) exchanger interactions in the kidney in hypertension. Hypertension. 2000;36:395–399. doi: 10.1161/01.hyp.36.3.395. [DOI] [PubMed] [Google Scholar]
- 46.O'Connell DP, Botkin SJ, Ramos SI, et al. Localization of dopamine D1A receptor protein in rat kidneys. Am J Physiol. 1995;268:F1185–1197. doi: 10.1152/ajprenal.1995.268.6.F1185. [DOI] [PubMed] [Google Scholar]
- 47.Brismar H, Asghar M, Carey RM, et al. Dopamine-induced recruitment of dopamine D1 receptors to the plasma membrane. Proc Natl Acad Sci U S A. 1998;95:5573–5578. doi: 10.1073/pnas.95.10.5573. [DOI] [PMC free article] [PubMed] [Google Scholar]
- 48.Violin JD, Zhang J, Tsien RY, et al. A genetically encoded fluorescent reporter reveals oscillatory phosphorylation by protein kinase C. J Cell Biol. 2003;161:899–909. doi: 10.1083/jcb.200302125. [DOI] [PMC free article] [PubMed] [Google Scholar]
- 49.Violin JD, DiPilato LM, Yildirim N, et al. beta2-adrenergic receptor signaling and desensitization elucidated by quantitative modeling of real time cAMP dynamics. J Biol Chem. 2008;283:2949–2961. doi: 10.1074/jbc.M707009200. [DOI] [PubMed] [Google Scholar]
- 50.Honegger KJ, Capuano P, Winter C, et al. Regulation of sodium-proton exchanger isoform 3 (NHE3) by PKA and exchange protein directly activated by cAMP (EPAC) Proc Natl Acad Sci U S A. 2006;103:803–808. doi: 10.1073/pnas.0503562103. [DOI] [PMC free article] [PubMed] [Google Scholar]
Associated Data
This section collects any data citations, data availability statements, or supplementary materials included in this article.
Supplementary Materials
Figure S1. Increase in D1R and D5R Co-immunoprecipitation after D1-like receptor agonist stimulation with fenoldopam (FEN). Renal proximal tubule cell lysates were immunoprecipitated with either a rabbit polyclonal anti-D1R antibody or an equal amount of non-specific rabbit IgG (NSR IgG) and western blotted for D5R using a goat polyclonal antibody. The reciprocal immunoprecipitation, using a goat polyclonal antibody against the D5R or non-specific goat IgG (NSG IgG), and western blot using a D1R rabbit polyclonal antibody is also shown in the lower blot. Adequate washing is evidenced by lack of immunoreactivity in the non-specific IgG lanes. An increase in immunoreactivity in the FEN lane suggests an increase in association after agonist stimulation.
Figure S2. D1R and D5R Co-localization in Human and Rat Renal Proximal Tubules. Human (top row) and Sprague Dawley rat (bottom row) renal cortices were fixed and flash-frozen sections were used for immunofluorescent staining. The first column in blue (A and E) is an autofluorescent (AF) image used to delineate the transition between cytoplasm and brush border. The second column is the immunolocalization of the D1R primarily in a subapical position (B and F) at the base of the microvilli (green). The third column is the immunolocalization of the D5R also at a subapical area (C and G, red). The composite image shows the co-localization of the D1R and D5R precisely at the transition of cytoplasm and brush border (D and H, yellow). The white bar in D and H represents 10 microns.
Figure S3. Live-cell FRET Measurement of D1R -YPet and D5R -CyPet Fusion Proteins in Transiently Transfected HEK293 Cells. The first row of images indicates that when D5R-CyPet plasmid was transfected into HEK293 cells, a clear signal was measured in the CyPet channel (A); there was no spectral bleedthrough into the YPet channel (B) and there was no measurable signal in the corrected FRET (cFRET) channel (C), as expected. The second row of images indicates that the same was true for the D1R-YPet-transfected HEK293 cells. There was a clear signal measured in the YPet channel (E); there was no spectral bleedthrough into the CyPet channel (D) and no measurable signal in the cFRET channel (F). In the bottom row, when the HEK293 cells were co-transfected with D5R-CyPet and D1R-Ypet, a clear signal was measured in the CyPet (G, arrow) and YPet channels (H, arrow), and a clear cFRET signal was detected only in the co-transfected cell (I, arrow). Images were collected using a 100× oil immersion objective lens.
Figure S4. D1R and D5R Immunofluorescent Staining in RPTCs Transfected with D1R and D5R siRNA or Scrambled Control (SCR). Cells were transfected with either D1R or D5R specific siRNA (100 nmol/L) or SCR control and 48 hrs later were fixed and stained for either D1R or D5R. Both D1R and D5R siRNAs markedly decreased their respective expression levels compared to SCR control (P<0.001 vs SCR, N=4).
Table S1. Pharmacological Agents