Abstract
The observation of viral plaques is the standard method for determining viral titer and understanding the behaviors of viruses. Here, we report the application of a wide field-of-view (FOV), time-lapse, on-chip imaging platform, termed the ePetri, for plaque analysis of murine norovirus 1 (MNV-1). The ePetri offers the ability to dynamically track plaques at the individual cell death event level over a wide FOV of 6 mm × 4 mm. As demonstration, we captured high-resolution time-lapse images of MNV-1-infected cells at 30 min intervals. We implemented a customized image-processing program containing a density-based clustering algorithm to analyze the spatial-temporal distribution of cell death events to identify plaques at their earliest stages. By using the results in a viral titer count format, we showed that our approach gives results that are comparable to conventional plaque assays. We further showed that the extra information collected by the ePetri can be used to monitor the dynamics of plaque formation and growth. Finally, we performed a demonstration experiment to show the relevance of such an experimental format for viral inhibitor study. We believe the ePetri is a simple and compact solution for the automation of viral plaque assays, plaque behavior analysis, and antiviral drug discovery and study.
Keywords: plaque assay, time-lapse on-chip imaging, clustering algorithm
Introduction
The analysis of viral plaques is the standard method for determining virus concentration and understanding their proliferation and spread behaviors.1, 2 A plaque is a region of host cells undergoing cytopathic effects (CPEs). Plaque growth is initiated when a virus particle attaches to a host cell, penetrates the cell membrane, replicates, induces CPE, and releases a new generation of viruses, which then diffuse to neighboring host cells to repeat the process.3 Because each plaque originates from a single virus particle, the number of plaques can be counted to determine the virus titer in a sample. This method is termed a plaque assay, and is widely used for viral quantification.1, 4 The area and shape of the plaques, together with the speed of plaque growth, can be used to study viral behavior.5 Viral plaques can also be used for the screening of antiviral drugs.6
Since the establishment of the first plaque assay,4 little has changed over the decades. Viral plaques are still grown in conventional Petri dishes or multi-well plates. Plaques are counted by the naked eye; therefore, several days are required for sufficient growth of the plaques.1 This manual counting process is labor-intensive and time-consuming. The plates also have to be taken out of the incubator for observation, which is inconvenient and may disturb virus distribution. In addition, the cells need to be stained with dyes such as neutral red or crystal violet to enhance contrast for the plaque readout, preventing continuous monitoring of plaque growth dynamics.
In recent years, studies have used standard microscopes for time-lapse imaging of viral plaques in order to investigate the behaviors of different viruses. Wodarz et al. monitored the spatial dynamics of recombinant adenovirus type-5 proliferation using a fluorescence microscope.7 However, they had a large imaging interval (24 h), and had to capture several images for each plaque and stitch them together due to the small field-of-view (FOV) of the microscope. Doceul et al. studied the rapid plaque growth of Vaccinia virus using a microscope integrated with a stage incubator that collected time-lapse images at much shorter intervals (1 h);2 however, they were also restricted by a 10× objective FOV, so a limited number of plaques were recorded for statistical build-up. In summary, standard microscopes are high-cost with limited FOVs; therefore, they are not ideal platforms for viral plaque analysis.
Commercialized systems such as the aCOLyte 3 and ProtoCOL 3 from Synbiosis were developed for wide FOV colony counting. They used light-emitting diodes (LEDs) for illumination, a charge-coupled device (CCD) camera with a lens for imaging, and integrated software capable of automated plaque counting from Petri dishes or multi-well plates. However, they have limited resolution (e.g., ProtoCOL 3 can accurately measure features down to 0.1 mm) and cannot support the observation of single cell death events. They do not provide a cell culture environment and are not designed for continuous plaque growth monitoring. Similar to the conventional manual plaque counting method, the sample usually has to be stained with dyes to provide better contrast for the automatic plaque counting software. A technology that combines the resolution of a microscope with the large FOV of a commercialized colony counting system, and supports time-lapse imaging is strongly needed.
We recently developed a wide-FOV, on-chip imaging method termed ePetri and have demonstrated its compact, wide-FOV imaging capability in longitudinal monitoring of cell culture and stem cell differentiation.8 This technique is based on the use of a super-resolution algorithm9 in combination with proximal cell imaging by growing the cells directly on the sensor chip to perform high-resolution and wide-FOV imaging. If the resolution of the image is restricted by the detector pixel size, we can enhance it by capturing a sequence of sub-pixel-shifted, low-resolution (LR) images and combining them to reconstruct a high-resolution (HR) image. The ePetri device has demonstrated the ability to image at 700-nm resolution with a FOV of 6 mm × 4 mm without using any optical lenses.
In this study, we developed the ePetri device for use with viral plaque assays, as well as for monitoring the dynamics of viral plaque formation and development. We chose murine norovirus 1 (MNV-1) as our model virus and RAW 264.7 as the host cell line. During the on-chip plaque growth we obtained a 24-mm2 FOV and time-lapse HR images at 30 min intervals. We then built an image-processing program for plaque recognition and tracking. We observed that cells undergoing CPE would detach from the substrate, becoming spherical, which focuses more light onto the sensor surface, causing them to appear much brighter than healthy cells. Taking advantage of this effect, we were able to segment dying cells from healthy cells using a simple thresholding method. We also noticed that a plaque is a cluster of high-density cell death events, so we incorporated a well-established, density-based clustering algorithm10 to detect the plaques. To our knowledge, this is the first time a clustering algorithm has been used for viral plaque detection. The last step of the program distinguishes between connected plaques by tracking their growth history. Using this program we conducted a plaque assay, tracked plaque growth, and studied viral inhibitors.
In the next section, we will describe the ePetri device setup in detail and explain the imaging approach. Next we will explain our customized plaque recognition program. We will demonstrate the plaque counting performance of our system in comparison with conventional plaque assays. Then, we will show the dynamic monitoring of plaque formation and growth. Finally, we will describe the demonstration use of our system to investigate the responses of viral plaque growth to two different viral inhibitors: 2′-C-methylcytidine (2CMC) and neuraminidase.
Results
Imaging principles and system setup
When the sample is on the surface of a complementary metal-oxide semiconductor (CMOS) image sensor, it can directly record a shadow image of the sample. However, due to the pixel size of the image sensor (2.2 μm in our experiment), the resolution is limited to approximately twice the pixel size (according to the Nyquist criterion). To improve the pixel-limited resolution, we applied a super-resolution algorithm described in our previous work.8, 9 Briefly, we placed the sample 1 μm above the image sensor surface (determined by the sensor’s passivation layer), then tilted the illumination angle to induce a sub-pixel shift of the sample shadow on the image sensor, and captured a series of LR images at each angle. Next, we calculated the amount of the shift by estimating the height of the sample above the pixels. Finally, we interpolated the LR images into a larger matrix according to their corresponding shift amounts, to reconstruct a HR image.
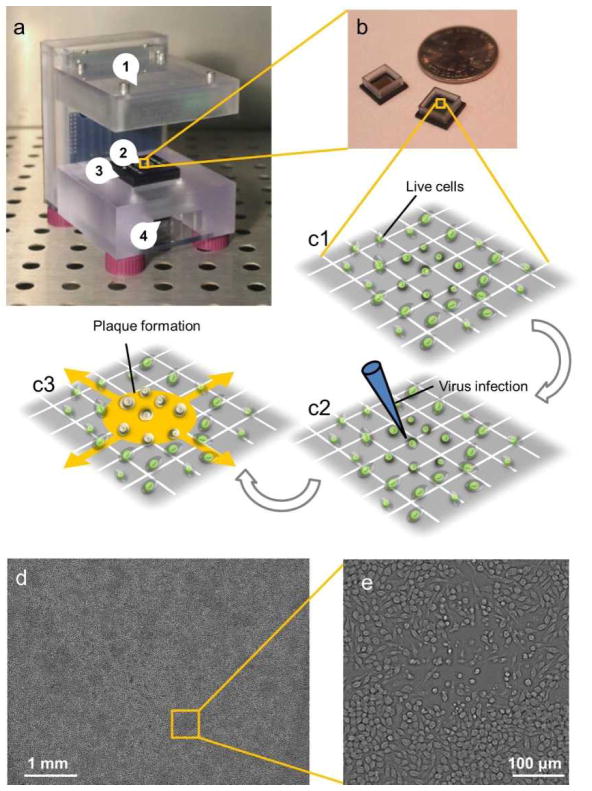
The ePetri device is depicted in Figure 1a. It consists of (1) an illuminator, (2) a CMOS sensor chip with a reservoir (also shown in Figure 1b), (3) a camera board, and (4) a thermoelectric cooler (TEC) with a fan. RAW 264.7 cells were cultured on the sensor (Figure 1c1), and infected with MNV-1 (Figure 1c2); subsequently, the sensor chip was mounted onto the camera board. As viral plaques appeared and expanded (Figure 1c3), time-lapse LR images were recorded: at each frame, the LED array illuminated the sample from different angles, creating a sequence of LR images. The TEC and fan were used to protect the cells and viruses from the heat generated by the sensor circuit. During the imaging process, the system was placed inside a standard 37°C CO2 incubator. A laptop running a customized MATLAB program was used to control the LED array, the TEC, and the fan, as well as collecting the LR images at 30-min intervals. After imaging, another customized MATLAB super-resolution program processed the LR images and produced a HR image for each imaging interval. A representative, full-FOV HR image is shown in Figure 1d with a typical growing plaque (zoomed inset shown in Figure 1e). A time-lapse HR image sequence of a growing plaque compared with the LR images directly captured by the sensor is shown in Movie S1.
Figure 1.
The ePetri device setup. (a) The ePetri device prototype. (b) Image sensor with reservoir. (c1–c3) Viral infection and plaque growth on the image sensor. (d) A representative, full field-of-view, high-resolution image with (e) a typical growing plaque zoomed in.
Plaque recognition by image processing
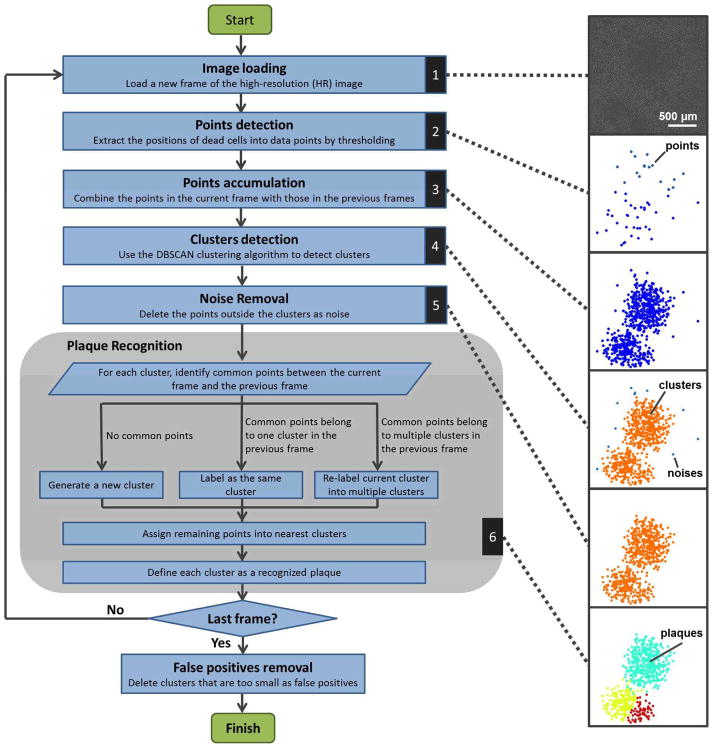
We designed an image-processing program to automatically detect plaques from time-lapse HR image sequences. This algorithm is able to detect newly generated plaques, track the growth of each individual plaque, and distinguish different plaques after they contact each other. Each frame was processed based on the time-lapse HR image sequence using the results of the previous frames. The program consists of six major steps, as illustrated by the flowchart and representative pictures in Figure 2. The dynamic results of these steps are shown in Movie S2. The six steps are described in detail as follows:
Figure 2.
The plaque recognition algorithm structure.
1. Image loading
A new frame from the HR image sequence is loaded into the program.
2. Points detection
A brightness threshold is set for the image (typically 2.2 times the mean value of the whole image), converting the HR image into a binary (0–1) image with only the profiles of the dying cells. The center-of-mass is extracted from each profile to generate the dying cell positions into our data points.
3. Points accumulation
The detected points in step 2 are combined with the plaque detection results from the previous frame.
4. Clusters detection
Considering that a plaque is a cluster of dead cells with high density, we apply a density-based clustering algorithm to the data points generated in step 3. The DBSCAN algorithm is used.10 This detects clusters by gauging the spatial density of the points. Briefly, each point is evaluated by two thresholds. The first threshold is Eps, which is the required neighborhood distance between this point and its surrounding points. The second threshold is MinPnts, which represents the required number of other points within the Eps neighborhood. If there are > MinPnts points within the Eps neighborhood, then this point and all the other points within the Eps neighborhood are considered elements of the same cluster. In this way, the algorithm evaluates all the points and labels them according to the clusters they belong to. The typical values used in our experiments were Eps=150 μm and MinPnts=5.
5. Noise removal
After step 4, the points that do not belong to any clusters are considered noise and are removed from the current frame.
6. Plaque Recognition
The plaque recognition step consists of several sub-steps. First, each current cluster is compared with the previously recognized plaques. If it does not have any common points with previous plaques, it will be considered a new cluster (this means a new plaque has generated). If it has common points with only one previous plaque, it will be labeled the same cluster as the previous one (this means a single plaque is growing). If it has common points with multiple previous plaques, these corresponding common points will be labeled separately according to each previous plaque (this means multiple plaques are starting to contact each other). Second, each un-labeled point in the current cluster is assigned to its nearest labeled cluster. After labeling all the points in the current clusters, each cluster was defined as a recognized plaque.
After the last frame is finished, the recognized plaques with insufficient points (typically <20 points) are considered false positives and are removed.
We built a customized MATLAB program for this algorithm. For verification, we manually examined 72 plaques in five ePetri plaque assay experiments and compared them with the results of our program. The plaque recognition accuracy of our program was 93±7% (there were 3±5% plaques unrecognized, and 2±3% falsely unseparated).
ePetri plaque assay
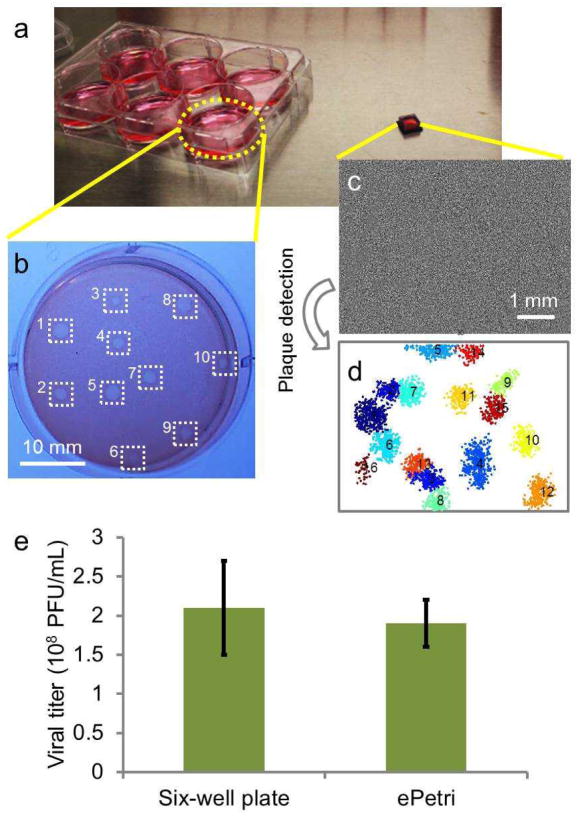
To compare the performance of our ePetri plaque assay method and the conventional multi-well plate plaque assay, we grew plaques on both six-well plates and CMOS image sensors (relative scale shown in Figure 3a). The RAW 264.7 cells were cultured to ~70% confluence for both groups. The same MNV-1 sample was used with different dilutions for each method (1:107 dilution for the conventional plaque assay, and 1:105 dilution for the ePetri plaque assay). For the conventional plaque assay, cells were stained with neutral red 48 h after infection and the plaques were counted by the naked eye (Figure 2b). For the ePetri group, the HR images were taken at 30 min intervals until 32 h after infection (Figure 2c) and our plaque recognition program was used to automatically count the number of plaques in the last frame (Figure 2d). The plaque titer given by the conventional plaque assay and ePetri plaque assay were 2.1±0.6 ×10⁸ PFU/ml (SEM, N=4) and 1.9±0.3 ×10⁸ PFU/ml (SEM, N=4) respectively, without significant differences, according to the Student’s t-test (P=0.13). It is worth noting that we demonstrated a shorter readout time (32 h) compared with the conventional plaque assay (48 h as established in the standard protocol1), due to the ability of the ePetri plaque assay to recognize plaques from their early stages. We will show this in the next section.
Figure 3.
Plaque assay experiment. (a) A six-well plate for the conventional plaque assay, compared with a CMOS image sensor for the ePetri plaque assay. (b) A representative image of the conventional plaque assay. Manually counted plaques were labeled with white squares. (c) A representative image of the ePetri plaque assay (d) with the plaques automatically detected. (e) The calculated viral titer of the conventional plaque assay compared with that of the ePetri plaque assay.
Longitudinal observation of plaque growth
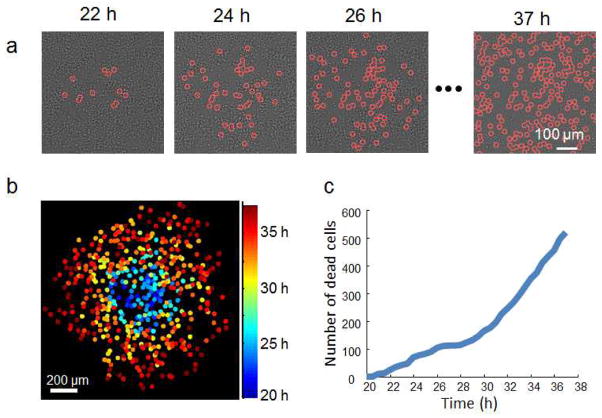
In addition to plaque recognition, the ePetri plaque assay method automatically captures a longitudinal sequence of cell death events on the entire sensor chip. This means that we can also use the data to investigate plaque growth dynamics from their earliest stages. As a demonstration example, we tracked the growth pattern of a single plaque (Figure 4). Figure 4a shows the time-lapse images of a growing plaque with individual cell death events labeled. Figure 4b shows the same plaque with each cell death event colored according to its occurrence. Based on this data, we also generated statistics of cell death numbers over time (Figure 4c).
Figure 4.
Longitudinal observation of the plaque growth. (a) Time-lapse HR images of a growing plaque with individual cell death events labeled. (b) The same plaque with each cell death event colored according to its occurrence. (c) Number of cell deaths over time in the plaque.
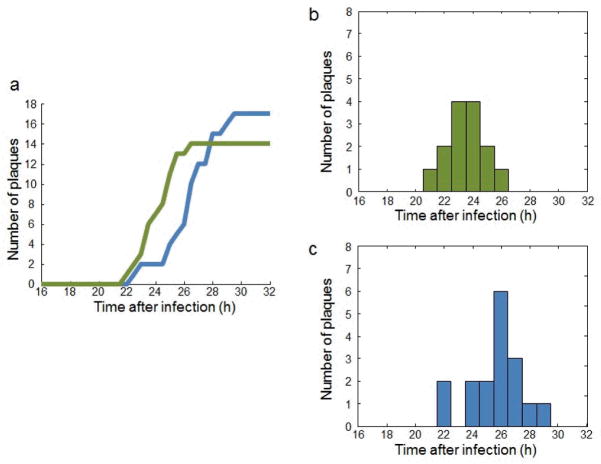
Our plaque detection algorithm also gives us the time at which a new plaque appears. As a demonstration example, we defined the time of generation of a new plaque as the time at which it was picked up by our clustering algorithm, and conducted two experiments to monitor plaque formation events over time (Figure 5a). From the histogram of the two experiments (Figure 5b–c), we observed that the peak of plaque formation happened 24–26 h after MNV-1 infection, and the time between the formation of early plaques and late plaques was approximately 6 h.
Figure 5.
Dynamics of plaque formation. (a) Plaque formation events over time for two independent experiments. (b–c) The histograms showing plaque formation distribution in (b) the first experiment (green curve in a) and (c) the second experiment (blue curve in a).
Demonstration study of viral inhibitor treatment
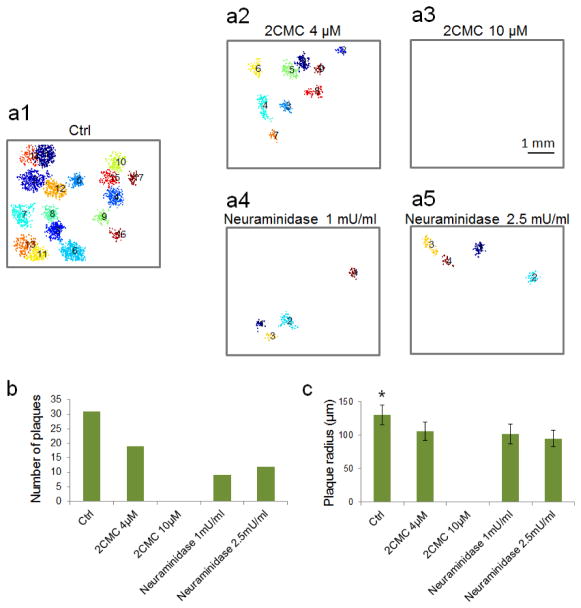
We demonstrated the ePetri device in a viral inhibitor study. We selected two previously discovered MNV-1 inhibitors. The first inhibitor is 2′-C-methylcytidine (2CMC), which blocks the RNA replication pathway.11 The second one is neuraminidase, which cleaves terminal sialic acids on the surface of host cells, preventing viral attachment to cells.12, 13 We included one control group without inhibitors (Figure 6a1). We used two different concentrations for the 2CMC treatment group (4 μM and 10 μM) and the neuraminidase treatment group (1 mU/ml and 2.5 mU/ml). Each treatment was repeated once, and a 1:(2×10⁴) dilution of a MNV-1 sample was used for all the groups. We monitored each group for 32 h after virus infection. To increase the throughput, we ran 2–3 ePetri devices in parallel each time. Representative final plaque recognition results for each group are shown in Figure 6a. We then investigated the effects of the two inhibitors on the total number of plaques (Figure 6b). In the case of 2CMC, the plaque number decreased by 40% at a concentration of 4 μM, and no plaques appeared when the concentration increased to 10 μM. In the case of neuraminidase, the plaque number decreased by 60% at a concentration of 1 mU/ml, but no further decrease was observed at 2.5 mU/ml. Further increase in neuraminidase concentration had negative effects on cell growth. Finally, we also examined plaque size by defining the radius of a circle with the same area as the plaque, calculated the mean and standard deviation of the radius data for each group, and statistically analyzed the data between the groups using one-way ANOVA followed by Tukey’s HSD test (Figure 6c). For the 2CMC group, the plaque radius at 4 μM (106±14 μm, N=19) was significantly smaller than that of the control group (130±15 μm, N=31) with P<0.001, and reduced to 0 μm (no plaques) at 10 μM. For the neuraminidase group, the plaque radius was also significantly smaller than the control group at 1 mU/ml (102±15 μm, N=9) with P<0.001, but did not significantly drop when the dose was increased to 2.5 mU/ml (95±12 μm, N=12), with P=0.677. The results suggest that 2CMC is capable of completely inhibiting viral proliferation, whereas neuraminidase is not. In this study, we added neuraminidase after viral infection as a proof of concept. However, as previously studied,12 the treatment of neuraminidase before viral infection can have a better inhibitory effect. We will use our ePetri device to investigate this timing of neuraminidase treatment in our future work.
Figure 6.
Study of viral inhibitor treatments. (a1–a5) Representative images showing the plaque recognition results of (a1) the control group, the 2CMC group at concentrations of (a2) 4 μM, and (a3) 10 μM, and the neuraminidase group at concentrations of (a4) 1 mU/ml and (a5) 2.5 mU/ml, 32 h after MNV-1 infection. (b) Number of plaques for all the five groups. (c) Means and standard deviations of the plaque radiuses for all the five groups (* P<0.05).
Discussion
The ePetri device has several intrinsic advantages for plaque analysis. First, its wide FOV supports the observation of multiple plaques at the same time. Second, its sub-micron resolution enables much earlier identification of a plaque site than conventional means, as well as observation of individual cell death events within each plaque. Third, the imaging process can be operated automatically and continuously inside the incubator. This not only saves labor and avoids disturbing the sample, but also allows the monitoring of the plaque growth process. Fourth, the ePetri device is engineered using mass-producible electronic components without optical lenses, making it a low-cost imaging solution. Finally, the ePetri device is compact in size (10 × 10 × 10 cm3 for our current prototype) and allows multiple devices to be run in parallel inside the same incubator, increasing imaging throughput.
In this study, we selected MNV-1 as our virus model due to its high significance. Norovirus (NoV) is the top pathogen causing foodborne illness in the United States and is responsible for more than 23 million infections per year.14 So far, little is known about the infection mechanisms of human NoVs and there is no specific treatment for human NoV infection because it cannot grow in tissue culture systems. Discovered in 2003, MNV-1 is the only member of NoVs that can successfully grow in tissue culture.15 We believe that the ePetri approach can provide more insight into the mechanisms of NoV infection, as well as those of other viruses that are conventionally studied by plaque assays.
We used thresholding to detect virus-induced cell death events in our algorithm. Occasionally, some random cell deaths or temporary cell detachment events (such as cell division) were also picked up by the thresholding. These data points are considered noise for plaque detection. These noise points are randomly generated and sparsely distributed around the whole imaging area. Conversely, the cell deaths inside virus plaques have much higher density; therefore, we were able to extract them from the noise by applying the density-based clustering algorithm.
We measured the virus concentration of the same sample using both the ePetri plaque assay and the conventional plaque assay in a 6-well plate. We were able to read out the results using the ePetri plaque assay at 32 h after infection, whereas we read out the conventional plaque assay by the naked eye 48 h after infection, following standard protocols.1 The ePetri plaque assay provides high resolution in detecting single cell death events; therefore, we were able to recognize plaques when they were still small in size, reducing the wait time for the plaque assay.
We determined the formation time of a plaque by looking at when a cluster was recognized by our algorithm. The experiment shows that the peak of plaque formation occurred at 24–26 h after infection, and the time between the formation of early plaques and late plaques was ~6 h. This verifies that the 32-h monitoring time was enough to cover the formation events of all the plaques. The ~6 h difference between the early and late plaques may suggest the heterogeneous nature of our virus sample. This contains rich information on viral behavior and is worth further investigation. One future experiment might involve retrieving the virus from a single plaque and testing whether plaque formation time can be synchronized. Another would be to work on different virus strains and study the variation in their plaque formation time.
Generally, there are five steps in a virus life cycle: attachment to the host cell membrane, entry into the cell, genome replication, protein synthesis, and virus release.16 In this study, we demonstrated the application of our system on the evaluation of antiviral drugs by choosing two already established virus inhibitors: neuraminidase and 2CMC, which inhibit the membrane attachment and RNA replication, respectively, of MNV-1. In recent years, many other antiviral drugs targeting different steps of the virus life cycle have also been studied. For example, dynasore and nocodazole were reported to inhibit virus entry.17 WP1130, ribavirin, and simvastatin were reported to suppress virus replication.18–20 Cycloheximide and type I/II interferons inhibit virus protein synthesis.21, 22 Oseltamivir and zanamivir inhibit virus release from host cells.16 The ePetri is a potential powerful tool for studying all these drugs and their effects on plaque formation and plaque growth dynamics.
The conventional plaque assay has several inherent limitations. First, it is time-consuming because plaque growth is a slow process and can take several days. Second, many viruses do not kill host cells and consequently do not form plaques; therefore, it is not possible to study them using the plaque assay. To overcome these limitations, a variation of the plaque assay called the fluorescent focus assay (FFA) was developed.23 A FFA is similar to a plaque assay except that it uses fluorescently-labeled antibodies targeting viral antigens to measure host cell infection; therefore, it can give information on viral spread even before a plaque is formed. In addition, such an assay can directly visualize viruses, so that plaque observation is not needed. We have recently developed a wide FOV on-chip fluorescence microscope that supports high-resolution fluorescence imaging, and have already demonstrated its use in time-lapse imaging of GFP-labeled HeLa cells as well as in the study of anti-cancer drugs.24, 25 We believe this fluorescence ePetri device will be well-suited for the study of FFA in our future work.
Conclusion
In this work we applied the ePetri device to viral plaque analysis. Time-lapse, high-resolution images were obtained by the ePetri device at 30-min intervals. A density-based clustering algorithm, DBSCAN, was introduced into a customized program for plaque recognition. This plaque recognition program was then used for the plaque assay and longitudinal monitoring of plaque formation and growth. We further explored potential applications of our device by studying the two viral inhibitors, 2CMC and neuraminidase, and observed a difference in their inhibition on plaque growth. We expect that the ePetri device can be used for many applications such as the study of virus behavior and the discovery of new antiviral drugs.
Experimental section
Conventional plaque assay
Conventional plaque assays were conducted by the following standard protocols.1 Briefly, RAW 264.7 cells (~70% confluency) cultured in DMEM were inoculated with various dilutions of the MNV-1 sample in six-well plates with each dilution added in two wells (0.5 ml per well). After 1.5 h incubation for MNV-1 attachment, the media was removed and a 37°C low melting point agarose solution (1.5% in DMEM, 3 ml per well) was added. The plates were placed into a 37°C CO2 incubator for 48 h, then stained with 0.02% neutral red solution for 1 h. Visible plaques were counted by the naked eye. The number of plaques in both wells at each dilution were added and multiplied by the dilution factor. This gives the number of plaque forming units (PFUs) in a 1-ml volume. For example, consider two wells at 1:107 dilution, if one well has 10 plaques and the other well has 5 plaques, the viral titer is 10×107+5×107=15×107 PFU/ml.
The ePetri device for plaque analysis
The ePetri device was designed based on our previous work8 and provided by ePetri Inc. We used MT9P031 (2.2 μm pixel, Aptina) for the image sensors and removed their microlens layers by treating them in oxygen plasma for 10 min at 80 W. The homemade square plastic reservoir was glued to the image sensor using polydimethylsiloxane (PDMS).
The protocol for viral plaque growth on the image sensor is similar as that used in the conventional plaque assay. Briefly, image sensors were pre-treated with trypsin for surface cleaning and better cell adhesion. The DMEM solution containing ~105 RAW 264.7 cells was filled into each sensor’s reservoir. After cells grew to ~70% confluence, the media was changed to the diluted MNV-1 solution (typically 20 μl) and a coverslip was placed on top of the medium. After 1.5 h incubation for MNV-1 attachment, the coverslip and virus solution were removed, and the 37°C low-melting point agarose solution (1.5% in DMEM, 150 μl) was added. A thin layer of DMEM was overlaid on top of the agarose to prevent evaporation. Sensor chips were mounted onto the ePetri devices with a customized PDMS cap placed above the image sensor to prevent further evaporation. The systems were placed into the 37 °C CO2 incubator for continuous imaging (30 min intervals).
The viral titer for the ePetri plaque assay was calculated in a similar manner to the conventional plaque assay. However, because the reservoir’s area (7.25×7.25 mm2) was 2.15 times of the sensor’s imaging area (5.70×4.28 mm2), the measured virus concentration was multiplied by this factor during calculations. For example, consider we use 20 μl MNV-1 solution at 1:105 dilution, if we count 15 plaques, then the viral titer is 15÷0.02×105×2.15=16×107 PFU/ml.
For the experiments in the viral inhibitor study, the protocol remained the same, except that the drug (2CMC/neuraminidase) was added to the low-melting point agarose solution before it was overlaid onto the cells.
Acknowledgments
We would like to acknowledge Dr. Herbert W. Virgin (Washington University in St. Louis) for generously providing MNV-1. We are grateful for the insightful discussions and suggestions from Dr. Fernando Rodriguez (CReSA Research Centre for Animal Health, Cerdanyola del Vallès, Spain). We thank Mr. Xiaoze Ou, Dr. Phil Willems and Mr. Daniel Tran for helping with the software and hardware setup of the ePetri device. This project is funded by National Institute of Health under Grant No. 1R01AI096226-01.
References
- 1.Gonzalez-Hernandez MB, Bragazzi Cunha J, Wobus CE. J Vis Exp. 2012:e4297. doi: 10.3791/4297. [DOI] [PMC free article] [PubMed] [Google Scholar]
- 2.Doceul V, Hollinshead M, van der Linden L, Smith GL. Science. 2010;327:873–876. doi: 10.1126/science.1183173. [DOI] [PMC free article] [PubMed] [Google Scholar]
- 3.Yin J, McCaskill JS. Biophys J. 1992;61:1540–1549. doi: 10.1016/S0006-3495(92)81958-6. [DOI] [PMC free article] [PubMed] [Google Scholar]
- 4.Dulbecco R. Proc Natl Acad Sci USA. 1952;38:747–752. doi: 10.1073/pnas.38.8.747. [DOI] [PMC free article] [PubMed] [Google Scholar]
- 5.Lee Y, Yin J. Nat Biotechnol. 1996;14:491–493. doi: 10.1038/nbt0496-491. [DOI] [PubMed] [Google Scholar]
- 6.Matrosovich M, Matrosovich T, Garten W, Klenk HD. Virol J. 2006;3:63. doi: 10.1186/1743-422X-3-63. [DOI] [PMC free article] [PubMed] [Google Scholar]
- 7.Wodarz D, Hofacre A, Lau JW, Sun Z, Fan H, Komarova NL. PLoS Comput Biol. 2012;8:e1002547. doi: 10.1371/journal.pcbi.1002547. [DOI] [PMC free article] [PubMed] [Google Scholar]
- 8.Zheng G, Lee SA, Antebi Y, Elowitz MB, Yang C. Proc Natl Acad Sci USA. 2011;108:16889–16894. doi: 10.1073/pnas.1110681108. [DOI] [PMC free article] [PubMed] [Google Scholar]
- 9.Park SC, Park MK, Kang MG. IEEE Signal Proc Mag. 2003;20:21–36. [Google Scholar]
- 10.Ester M, Kriegel H, Sander J, Xu X. Proceedings of 2nd International Conference on Knowledge Discovery and Data Mining (KDD-96); Menlo Park, Calif. 1996. [Google Scholar]
- 11.Rocha-Pereira J, Jochmans D, Dallmeier K, Leyssen P, Cunha R, Costa I, Nascimento MS, Neyts J. Biochem Bioph Res Co. 2012;427:796–800. doi: 10.1016/j.bbrc.2012.10.003. [DOI] [PubMed] [Google Scholar]
- 12.Perry JW, Wobus CE. J Virol. 2010;84:6163–6176. doi: 10.1128/JVI.00331-10. [DOI] [PMC free article] [PubMed] [Google Scholar]
- 13.Taube S, Perry JW, Yetming K, Patel SP, Auble H, Shu L, Nawar HF, Lee CH, Connell TD, Shayman JA, Wobus CE. J Virol. 2009;83:4092–4101. doi: 10.1128/JVI.02245-08. [DOI] [PMC free article] [PubMed] [Google Scholar]
- 14.Hyde JL, Sosnovtsev SV, Green KY, Wobus C, Virgin HW, Mackenzie JM. J Virol. 2009;83:9709–9719. doi: 10.1128/JVI.00600-09. [DOI] [PMC free article] [PubMed] [Google Scholar]
- 15.Karst SM, Wobus CE, Lay M, Davidson J, Virgin HW. Science. 2003;299:1575–1578. doi: 10.1126/science.1077905. [DOI] [PubMed] [Google Scholar]
- 16.Magden J, Kaariainen L, Ahola T. Appl Microbiol Biotechnol. 2005;66:612–621. doi: 10.1007/s00253-004-1783-3. [DOI] [PMC free article] [PubMed] [Google Scholar]
- 17.Gerondopoulos A, Jackson T, Monaghan P, Doyle N, Roberts LO. J Gen Virol. 2010;91:1428–1438. doi: 10.1099/vir.0.016717-0. [DOI] [PubMed] [Google Scholar]
- 18.Perry JW, Ahmed M, Chang KO, Donato NJ, Showalter HD, Wobus CE. PLoS Pathog. 2012;8:e1002783. doi: 10.1371/journal.ppat.1002783. [DOI] [PMC free article] [PubMed] [Google Scholar]
- 19.Chang KO, George DW. J Virol. 2007;81:12111–12118. doi: 10.1128/JVI.00560-07. [DOI] [PMC free article] [PubMed] [Google Scholar]
- 20.Chang KO. J Virol. 2009;83:8587–8595. doi: 10.1128/JVI.00005-09. [DOI] [PMC free article] [PubMed] [Google Scholar]
- 21.Bok K, Prikhodko VG, Green KY, Sosnovtsev SV. J Virol. 2009;83:3647–3656. doi: 10.1128/JVI.02028-08. [DOI] [PMC free article] [PubMed] [Google Scholar]
- 22.Changotra H, Jia Y, Moore TN, Liu G, Kahan SM, Sosnovtsev SV, Karst SM. J Virol. 2009;83:5683–5692. doi: 10.1128/JVI.00231-09. [DOI] [PMC free article] [PubMed] [Google Scholar]
- 23.Payne AF, Binduga-Gajewska I, Kauffman EB, Kramer LD. J Virol Methods. 2006;134:183–189. doi: 10.1016/j.jviromet.2006.01.003. [DOI] [PubMed] [Google Scholar]
- 24.Pang S, Han C, Kato M, Sternberg PW, Yang C. Opt Lett. 2012;37:5018–5020. doi: 10.1364/OL.37.005018. [DOI] [PMC free article] [PubMed] [Google Scholar]
- 25.Han C, Pang S, Bower DV, Yiu P, Yang C. Anal Chem. 2013;85:2356–2360. doi: 10.1021/ac303356v. [DOI] [PMC free article] [PubMed] [Google Scholar]


