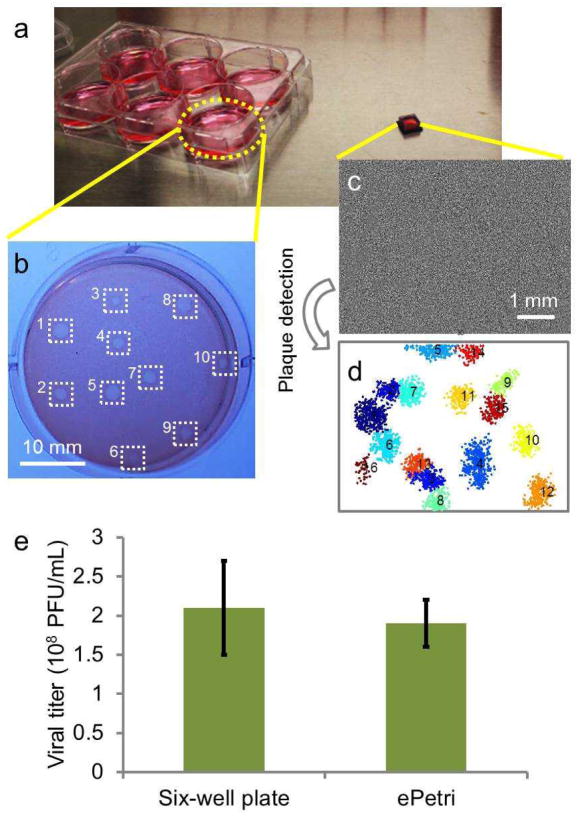
Figure 3.
Plaque assay experiment. (a) A six-well plate for the conventional plaque assay, compared with a CMOS image sensor for the ePetri plaque assay. (b) A representative image of the conventional plaque assay. Manually counted plaques were labeled with white squares. (c) A representative image of the ePetri plaque assay (d) with the plaques automatically detected. (e) The calculated viral titer of the conventional plaque assay compared with that of the ePetri plaque assay.

