

Abstract
The cerebral cortex is composed of subregions whose functional specialization is largely determined by their incoming and outgoing connections with each other. In the present study, we asked which cortical regions can exert the greatest influence over other regions and the cortical network as a whole. Previous research on this question has relied on coarse anatomy (mapping large fiber pathways) or functional connectivity (mapping inter-regional statistical dependencies in ongoing activity). Here we combined direct electrical stimulation with recordings from the cortical surface to provide a novel insight into directed, inter-regional influence within the cerebral cortex of awake humans. These networks of directed interaction were reproducible across strength thresholds and across subjects. Directed network properties included (1) a decrease in the reciprocity of connections with distance; (2) major projector nodes (sources of influence) were found in peri-Rolandic cortex and posterior, basal and polar regions of the temporal lobe; and (3) major receiver nodes (receivers of influence) were found in anterolateral frontal, superior parietal, and superior temporal regions. Connectivity maps derived from electrical stimulation and from resting electrocorticography (ECoG) correlations showed similar spatial distributions for the same source node. However, higher-level network topology analysis revealed differences between electrical stimulation and ECoG that were partially related to the reciprocity of connections. Together, these findings inform our understanding of large-scale corticocortical influence as well as the interpretation of functional connectivity networks.
Keywords: ECoG, effective connectivity, functional connectivity, graph theory, stimulation
Introduction
Methodological advances in functional magnetic resonance imaging (fMRI; Fox and Raichle, 2007; Biswal et al., 2010), electrocorticography (ECoG; Kramer et al., 2010; Chu et al., 2012), MEG (Bassett et al., 2006), and MRI-based tractography (Hagmann et al., 2008) have renewed interest in large-scale mapping of brain networks and their functional architecture. This has been fueled by the analysis of high-dimensional data, with graph theoretic tools a prominent example (Bullmore and Sporns, 2009). Within a graph (or network) framework, brain regions are treated as nodes and their connections as edges between nodes. Such studies of brain networks have provided new insight into the interactions that underlie cortical information processing and the pathophysiology of neuropsychiatric disease (Bassett et al., 2008; Buckner et al., 2009; Honey et al., 2009).
The direction of information flow is a facet of this research that has been difficult to ascertain. This is because connectivity measures in humans, including resting fMRI and diffusion tensor imaging to measure functional and anatomical connectivity, respectively, cannot resolve the direction of corticocortical or subcortical interactions. Anatomical tracer studies can elucidate fine-grained directional connections in experimental animals (Felleman and Van Essen, 1991) but are more difficult in humans (Burkhalter and Bernardo, 1989). A number of noninterventional methods, such as Granger causality and dynamic causal modeling, can demonstrate causal interactions by statistical inference (Oya et al., 2007; Yan and He, 2011), but may be difficult to confidently interpret (Smith et al., 2011).
Direct cortical stimulation provides an interventional method to test causal relations (or “effective connections”) between brain regions. Electrical stimulation at one location on the neocortex can trigger an electrical response at a remote location in proportion to the strength of the effective connection between the two locations. These corticocortical evoked potentials (CCEPs) can predict resting fMRI interactions (Keller et al., 2011) and examine functional (Matsumoto et al., 2004; Conner et al., 2011) and pathological cortical networks (Valentín et al., 2005).
Pathways connecting cortical regions consist of distinct feedforward and feedback connections within systems such as the visual cortex with an established functional hierarchy (Felleman and Van Essen, 1991). Although bidirectional anatomical connections provide the potential for communication in both directions, bidirectional communication may often be nonsymmetric. Furthermore, these communications and their directionality may be task- and state-dependent. In fact, little is known about the large-scale reciprocity of functional connections. Mapping directed connections using an interventional technique can thus provide a new insight into interpreting large-scale brain networks.
Here, we introduce a method of deriving robust effective connectivity networks with high spatiotemporal resolution. By applying graph theoretic measures, we identify motor and language systems to be highly central and project influence, whereas superior parietal, superior temporal, and anterolateral frontal regions receive influence. Finally, we report differences in the reciprocity of effective connections that may account for distinct topologies observed between functional and effective connectivity maps. These findings provide insight into the large-scale information processing architecture of the human cortex and deepen our understanding of networks derived from measures of functional connectivity.
Materials and Methods
Subject selection.
Fifteen subjects (11 female, aged 31.9 years; range 17–60) with medically intractable epilepsy at the North Shore LIJ Comprehensive Epilepsy Centers participated. Patient characteristics are described in Table 1. All subjects provided informed consent as monitored by the local Institutional Review Board and in accordance with the ethical standards of the Declaration of Helsinki. The decision to implant, the electrode targets, and the duration of implantation was made entirely on clinical grounds without reference to this investigation.
Table 1.
Patient characteristics
| Patient ID | Gender | Age (years) | Implanted hemisphere | Seizure localization |
|---|---|---|---|---|
| S1 | F | 22 | L | Left occipital |
| S2 | M | 21 | R | Right temporal |
| S3 | F | 36 | L/R | Left frontotemporal |
| S4 | F | 48 | R | Right MTL |
| S5 | F | 17 | R | Left MTL |
| S6 | F | 23 | L | Left MTL |
| S7 | F | 38 | L | Left frontal |
| S8 | M | 31 | R | Right MTL |
| S9 | F | 55 | L | Left MTL |
| S10 | M | 22 | R | Right MTL |
| S11 | F | 25 | R | Right MTL |
| S12 | F | 30 | R | Right F-T |
| S13 | F | 25 | L | Left MTL |
| S14 | M | 60 | L | Left MTL |
| S15 | F | 26 | L | Right F-T |
Seizure localization and MRI findings were determined by neurologists and neuroradiologists blinded to the study. MTL, Medial temporal lobe; F-T, Frontotemporal.
Electrode implantation and recording.
Patients were implanted with intracranial subdural grids, strips, and/or depth electrodes (Integra Lifesciences) for 5–10 d. Monitoring occurred until sufficient data were collected to identify the seizure focus, at which time the electrodes were removed and, if appropriate, the seizure focus was resected. Continuous intracranial video EEG monitoring was performed using standard recording systems (XLTEK EMU 128 LTM System, Natus Medical), sampled at 2 KHz and bandpass filtered (0.1–1 kHz). A strip electrode screwed into the frontal bone near the bregma was used as common mode ground. Acquired data were notch filtered (60 Hz) and rereferenced by subtracting the common average to remove non-neuronal activity (Kanwisher et al., 1997). Electrodes involved in the seizure onset zone, as determined by an epileptologist blinded to the study, were removed from the analysis of the majority of this study, with exception in the test for excitability (see Fig. 4).
Figure 4.

Relationship of seizure onset zone to CCEP networks measures. Relationship between the degree, indegree, and outdegree at electrodes in the seizure onset zone compared with those outside the seizure onset zone. Error bars represent SEM; *p < 0.05.
Electrode registration.
The electrode registration process has been described previously (Keller et al., 2011). Briefly, to localize each electrode anatomically, subdural electrodes were identified on the postimplantation CT with BioImagesuite (Duncan et al., 2004) and were coregistered first with the postimplantation structural MRI and subsequently with the preimplantation MRI to account for possible brain shift caused by electrode implantation and surgery (Mehta and Klein, 2010). Following coregistration, electrodes were snapped to the closest point on the reconstructed pial surface (Dale et al., 1999) of the preimplantation MRI in MATLAB (Dykstra et al., 2012). Intraoperative photographs were used to corroborate this registration method based on the identification of major anatomical features. Automated cortical parcellations were used to relate electrode data to anatomical regions (Fischl et al., 2004).
Functional stimulation mapping.
To localize eloquent cortex for clinical purposes, electrical stimulation mapping (ESM) was performed according to standard clinical protocol (bipolar stimulation, 2–5 s duration, 3–15 mA, 100 us/phase, 20–50 Hz). Language regions were identified when stimulation resulted in a language deficit (expressive, receptive, naming, or reading). Motor regions were identified when stimulation resulted in contraction of isolated muscle groups.
CCEPs.
CCEP mapping was performed with bipolar stimulation of each pair of adjacent electrodes with single pulses of electrical current (10 mA, biphasic, 100 μs/phase, 20 trials per electrode pair) using a Grass S12 cortical stimulator (Grass Technologies). Interstimulation interval was 1 or 2 s (5 and10 patients, respectively). Differences in interstimulation interval had no effect on evoked potentials. The current magnitude of 10 mA was chosen, as this was the maximum current that did not induce epileptiform discharges in areas outside of the seizure onset zone. Stimulation was performed extraoperatively once seizures had been recorded and antiepileptic medications had been resumed; this was typically 7–10 d after the electrode implantation surgery. Patients were awake and at rest at the time of CCEP recording.
CCEPs in human cortex generally consist of an early sharp response (10–50 ms poststimulation) and a later slow-wave (50–250 ms). These responses have previously been referred to as N1 and N2, respectively, due to the existence of negative voltage deflections during these time periods (Matsumoto et al., 2004). However, as the deflections observed during these time periods are highly variable in both polarity and latency, and as negative deflections are often followed by positive deflections and vice versa, we chose to examine the magnitude of the response of evoked potentials regardless of polarity. Therefore, we refer to the early and late responses as A1 and A2 (A for absolute magnitude). In support of this change, a previous study demonstrates a similar spatial correlation between CCEP and resting fMRI when using the N1 or P1 response (Keller et al., 2011).
For each stimulation and response site, mean evoked potentials (from 20 repetitions) were converted to a Z-score based on the peak amplitude response relative to the prestimulus baseline (−500 to −5 ms) for the early (A1) and the late (A2) response. The first 10 ms following stimulation was excluded from analysis because of stimulation artifact. Evoked potentials that did not switch polarity following the stimulation artifact were also rejected as these were most often seen when the amplifier failed to return from saturation. Responses within 1.5 cm of the stimulation site were removed to reduce the contribution of volume conduction. We would like to emphasize that the Z-score is calculated based on the evoked potential at each site and is independent of responses at other sites.
To determine the threshold for significant evoked responses, receiver operating characteristic (ROC) curves were previously generated by comparing CCEP amplitude responses to behavioral effects during functional stimulation mapping (Keller et al., 2011). A Z-score of 6 was determined to elicit the optimal sensitivity and specificity of CCEP responses between expressive and receptive speech regions anatomically connected through the arcuate fasciculus, a well characterized pathway for speech processing. Therefore, subsequent analyses of these networks were performed at this threshold. However, other thresholds were examined to ensure that these findings were not threshold-specific. To account for the fact that two regions are simultaneously stimulated (bipolar stimulation), each pair of stimulated electrodes was treated as a single cortical region. As a result, when recording responses at these two regions, CCEPs at each site were first converted to Z-scores and then averaged before determining whether the response exceeded threshold. Following the calculation of CCEPs for the A1 and A2 responses, we compared the spatial overlap between responses in each time period. Across all subjects, 78.8% (±6.7% SE) of significant A2 responses were accompanied by significant A1 responses, whereas 57.6% (8.3% SE) of significant A1 responses were accompanied by significant A2 responses. For all subsequent analyses and figures, the A1 response is used because we believe it represents the initial afferent volley, and thus a more direct measure of connectivity between two regions. However, it is important to note both the overlap as well as some differences between A1 and A2 responses as quantified above.
Although our ability to thoroughly investigate the parameter range was limited by clinical time constraints, we obtained data from a single subject for varying stimulation amplitudes (5, 7, and 10 mA; see Fig. 3A). Although the precise CCEP waveform shape varied across stimulation amplitudes, the set of statistically responsive electrodes did not. Instead, regions that exhibited strong CCEPs at a low current simply increased in amplitude for a stronger current (Fig. 3B; r = 0.68, p < 0.001). This implies that our parameters provided a spatial response map that is representative over a range of stimulation parameters.
Figure 3.

Effect of stimulation intensity and threshold on CCEP networks. A, Spatial distribution of CCEPs elicited from stimulation of different intensities. CCEPs from three regions (dotted black boxes) are expanded on the right. B, Relationship of CCEP strength for 5 and 10 mA current intensities. C, Relationship of CCEP threshold to network density (k). As threshold increases, the network becomes sparser and density decreases. D, Effect of CCEP threshold on outdegree measures. E, Effect of distance on outdegree. A null model based on CCEP responses that are inversely proportional to distance from the stimulation site compared with empirical data from Subject 7. Warm colors denote regions with high outdegree (as expressed by Z-score after normalizing outdegree measures across all sites).
Analysis of directed networks.
Graph theoretic measures were used to characterize network topology. To apply these graph theoretic measures, we first converted the pattern of CCEPs into a matrix representation (Fig. 1). Each row in the matrix corresponds to one stimulation site (“node” in the network), and each column to a site at which stimulation responses were measured. The (i,j) entry in the matrix represents the evoked responses measured at node j upon stimulating at site i; this is the strength of the connection between node i and node j. To ensure a connected matrix, the corresponding rows and columns were removed for all sites that were untested or that produced an artifactual response. As a bipolar configuration was used to stimulate the cortex, for each pair of electrodes that were stimulated, the average of adjacent CCEP responses was calculated to ensure that stimulated and recorded responses were spatially consistent. The weighted, asymmetric matrix of CCEPs was then converted to a binary, asymmetric matrix by thresholding based on the ROC analysis described above and further characterized using a variety of network measures implemented in MATLAB (MathWorks) in the Brain Connectivity Toolbox (Rubinov and Sporns, 2010). Graph theory measures used to characterize each region in the network included: outdegree, the total number of significant CCEPs observed when the region of interest is stimulated; indegree, the total number of times stimulation of any region evokes a significant CCEP at the region of interest; degree centrality, the number of total suprathreshold evoked responses (indegree + outdegree); flow, the difference between the amount of outgoing and incoming connections (outdegree − indegree); reciprocity index (B), the proportion of time a recurrent suprathreshold CCEP is present when one suprathreshold CCEP is observed in either direction; path length, the number of shortest connections (suprathreshold CCEPs) needed to travel from one region to another (a measure of long-range connectivity); and clustering coefficient, the proportion of a region's neighbors which exhibit suprathreshold CCEPs (a measure of short-range connectivity). As the total number of connections is identical for each stimulation site, calculation of the total number or percentage of connections will yield equivalent results. Whole brain networks are described by density (k), the number of connections in the matrix divided by the total number of possible connections; and small worldness, the extent to which a network has a higher clustering coefficient and shorter path length when compared with a random network with an equal number of overall connections. Networks with high clustering coefficient are thought to exhibit high local efficiency information processing, while those with a short path length represents efficient global processing as it takes fewer steps to travel from one node to the next. Measures derived from CCEPs will be referred to as “causal” (causal degree, causal indegree, causal outdegree, causal flow) as each edge in the matrix represents the directional influence of one node on another (Seth et al., 2005).
Figure 1.

Workflow. A, Corticocortical evoked potentials from one stimulation site. Single trial (gray) and average (black) CCEPs are plotted for an 8 × 8 grid of electrodes implanted on the cortical surface. Note the large evoked responses at the top of the diagram far from the stimulation site with small responses at the center of the grid closer to the stimulation site. Clear boxes denote bad electrode channels that were removed from analysis. B, CCEPs at each electrode are separated into an A1 and A2 response. The A1 response is shown in the connectivity matrices and on the brain surfaces. Significant electrode responses from one stimulation site are plotted on the pial surface for visualization with blue arrows connecting the stimulation site to response sites with significant CCEPs. C, CCEP directed networks. Evoked responses are converted to Z-scores and represented by color intensity. One row corresponds to all electrode responses from one stimulation site. The resulting weighted connectivity matrix is then thresholded and the binary matrix (all significant stimulation-evoked responses) is plotted as a directed network on the pial surface.
Modeling reciprocity.
Identifying reciprocated and nonreciprocated influence can help in identifying the channels of information flow across the network. However, some amount of reciprocity is expected, even in a randomly connected network, and this baseline level of reciprocity rate depends on the network density. Therefore, to determine whether the proportion of reciprocal effective connections differ from chance, we constructed a model based on the empirical network density. We first categorized stimulation-response electrode pairs according to their Euclidean distance (“short-range” pairs <5.0 cm; “long-range” pairs >5.0 cm). If p represents the total number of stimulation–response pairs which exhibits at least one suprathreshold CCEP connection, and q represents the total number of pairs made up of reciprocated bidirectional connections, then the probability that a random connection is reciprocated (i.e., part of a bidirectional pair) is as follows:
B = reciprocity index = q/p.
B = 0 indicates that none of the significant CCEP connections are part of a reciprocal pair and B = 1 represents that all significant CCEP connections are part of a reciprocal pair. In this notation, p + q represents the total number of directed edges. For each of 1000 simulations, a network was populated such that p + q edges (i.e., significant connections) were randomly assigned between the total number of nodes (i.e., stimulating–recording pairs). For each stimulation site, the number of significant connections for the simulation was made equal to that of the experimental data. Then, the reciprocity index for the model was calculated and results were compared with experimental CCEP networks for each subject. This analysis was performed separately for short-range and long-range connections. Additionally, to determine the effect CCEP threshold has on reciprocity, this analysis was repeated for less and more stringent significance thresholds (z = 2, 4, 6, 8, 10, 12, 14).
Reciprocity: regional analysis.
Because performing reciprocity analysis on individual electrodes is likely to underestimate long-range connectivity, we also used a regional-based approach. Each electrode was assigned to nearest anatomical parcellation as described earlier (see Electrode registration; Fischl et al., 2004). A significant connection between two anatomical regions was defined in the following manner. Significance between CCEP stimulation–responses between anatomical regions was defined as follows. Each group of CCEP stimulation–responses between anatomical regions was averaged to create the mean CCEP regional response. A distribution of all mean CCEP regional responses were computed, and a group CCEP regional response threshold was defined as >2 SD from this distribution. In this manner, the threshold for significance of the mean CCEP regional response was calculated to be z = 5.42. This threshold was used to create binary regional-based connectivity matrices. Finally, the mean reciprocity for short-range (<5 cm) and long-range (>5 cm) anatomical regions was calculated. For the parcellation-based analyses, the same distance criterion was used such that if the Euclidean distance between the center of parcellations was calculated to be >5 cm, it was defined as a long-range connection. A control analysis similar to that used in the electrode-based analysis was computed. The resultant electrode-based null connectivity matrix was then grouped by regions in a similar manner as described above for the experimental data.
Resting ECoG.
The resting ECoG protocol was described previously (Keller et al., 2013). ECoG was acquired for 3–6 min while subjects were asked to rest quietly. Interictal discharge-free periods (276.1 ± 71.2 s SD) were selected for analysis. Recording sessions were conducted >2 h before or after an ictal event to avoid preictal or postictal changes that may alter cortical connectivity, and before electrical stimulation mapping. Channels with high amplitude noise (SD > 250 uV) as well as electrode sites corresponding to the seizure onset zone were excluded (mean 5.6 ± 3.2% of all channels). The remaining channels were notch-filtered to remove power line noise and rereferenced by subtracting the common average. Data were bandpass filtered between 70 and150 Hz (fourth-order Butterworth filter with zero phase shift), full-wave rectified, and Hilbert transformed to obtain the envelope of the signal (high gamma power, HGP; Ossandón et al., 2011; Keller et al., 2013). Slow fluctuations (0.1–1 Hz) of HGP were then extracted (fourth-order zero phase shift bandpass Butterworth filter). It is important to emphasize that HGP is used here as a proxy to analyze low-frequency fluctuations of the gamma envelope. Although the gamma band, which provides the closest approximation to neuronal firing (Mukamel et al., 2005; Manning et al., 2009) is the direct measurement, it is the low (<1 Hz) frequency fluctuations of the gamma band that reflect the most reproducible measures of cortical dynamics (Nir et al., 2008; Honey et al., 2012). Finally, the correlation coefficient of HGP fluctuations between each pair of electrodes was computed, and the resulting coefficients were normalized using Fisher's r-to-z transformation.
Comparing effective and functional connectivity maps.
CCEPs measure the brain's response to externally applied electrical stimulation. However, how do these interareal effective interactions compare with correlation in spontaneous cortical activity? We attempted to answer this question by recording ECoG signals while the patient is at rest (see Materials and Methods). Functional connectivity between electrodes i and j was measured as the correlation coefficient of the ECoG power time courses recorded in those electrodes at rest. The functional connectivity matrix was binarized by thresholding to leave only the strongest 5% of correlations. As correlation does not provide information on directionality, degree (rather than indegree, outdegree, or net flow) was calculated for each node in the functional connectivity matrices. To compare ECoG and CCEP profiles, for the set of electrodes in which bipolar stimulation was applied during CCEP mapping, we averaged the ECoG measures across these two sites.
Functional connectivity can differ from effective connectivity in the strength of interactions between two particular sites as well as the overall topology, or connectedness. To compare effective and functional connectivity, we examined the relationship between ECoG and CCEP network measures by computing the single-site and global normalized connectivity profiles for each modality. Single-site connectivity refers to a single row in the connectivity matrix, and single-site correspondence of CCEP and ECoG measures implies the spatial correspondence of these network measures. On the other hand, global connectivity profile represents overall connectedness of a given site and reflects the total number of observed connections regardless of their spatial correspondence.
The correspondence between modalities of single-site connectivity profiles was assessed by calculating the spatial correlation between the connectivity of each ROI (seed electrode for ECoG calculations; stimulation electrode for CCEPs) and all other electrodes (ECoG correlation with seed electrode, evoked response for CCEPs). These correlation values were then averaged across all ROIs and across subjects. To compare the global connectivity profiles across modalities, we used a group surface-based analysis. For each patient, the z-normalized network measure was plotted after convolution with a 3D Gaussian smoothing kernel (FWHM 50 mm; Miller et al., 2007; Dykstra et al., 2012). Smoothed network measure maps for each subject were then transformed to the group-averaged cortical surface. Group surface maps of ECoG degree and CCEP degree, indegree, outdegree, and net flow were then compared. As a further analysis, for each cortical parcellation, graph theory measures at electrodes found within a region were averaged together and the correlation coefficient was calculated for each parcellation-based ECoG and CCEP network measure. To determine whether these ECoG findings were specific for high-gamma, we repeated this analysis of the ECoG looking at the correlation coefficient between the raw, unfiltered voltages at sites of interest. Qualitatively similar results were obtained with respect to correspondence of ECoG and CCEP (see Fig. 8A,B).
Figure 8.

Distinct global connectivity profiles for effective and functional connections. A, Group degree centrality values for resting ECoG (functional) network connectivity using HGP and wideband voltage. Each subject's network measures undergo z-transformation, spatially smoothing, and averaging across subjects. B, Quantification of ECoG network topology maps derived from HGP and wideband voltage. C, Group analysis of CCEP (effective) network connectivity measures of causal outdegree, indegree, degree, and flow. r values below each map represent the parcellation-based correlation between that measure and degree centrality in the resting ECoG network, as quantified in D. Each data point in the scatter plot represents the average network value across each parcellation in the group maps.
Results
We examined directed networks derived from electrically evoked potentials recorded from subdural electrodes in 15 subjects undergoing intracranial monitoring for surgical evaluation of epilepsy (clinical information and demographics are presented in Table 1). In total, 1384 cortical sites were probed. The workflow for this analysis is depicted in Figure 1 (see Materials and Methods). Briefly, single-pulse stimulation elicited evoked potentials (CCEPs) that were converted to Z-scores based on the response amplitude of the early (<50 ms, A1) segment of the CCEP. Each stimulation and associated responses represent one row in the connectivity matrix. This weighted connectivity matrix was thresholded and graph theoretical measures were calculated to quantify network topology, directionality, and reciprocity.
Directed networks derived from CCEPs are reproducible and exhibit small world topology
Following the construction of CCEP directed networks, we examined network topology and determined its sensitivity to distance and network density. Degree was calculated as a function of distance from the stimulation site and response amplitude. CCEP networks were composed of abundant short-range connections and few long-range connections (Fig. 2B). The relationship between network density (k) and significance threshold of the evoked potential (z = 0.5−14) is depicted in Figure 2C. At high-response thresholds, the density of the network decreases as expected. We next determined whether CCEP networks exhibit small-world topology, a feature of human brain networks characterized by a higher-clustering coefficient and shorter path length compared with random networks (Sporns and Honey, 2006; Achard and Bullmore, 2007; Bassett et al., 2008). For each response threshold, clustering coefficient and path length were normalized to 100 random networks with equivalent total indegree and outdegree as the CCEP network. CCEP directed networks exhibited small world properties in the range of z = 6–14, with a mean clustering coefficient of 2.0 in this range of thresholds (Fig. 2C). This measure is in general agreement with reports from other human brain networks (Achard and Bullmore, 2007; Bassett et al., 2008; Yan and He, 2011).
Figure 2.
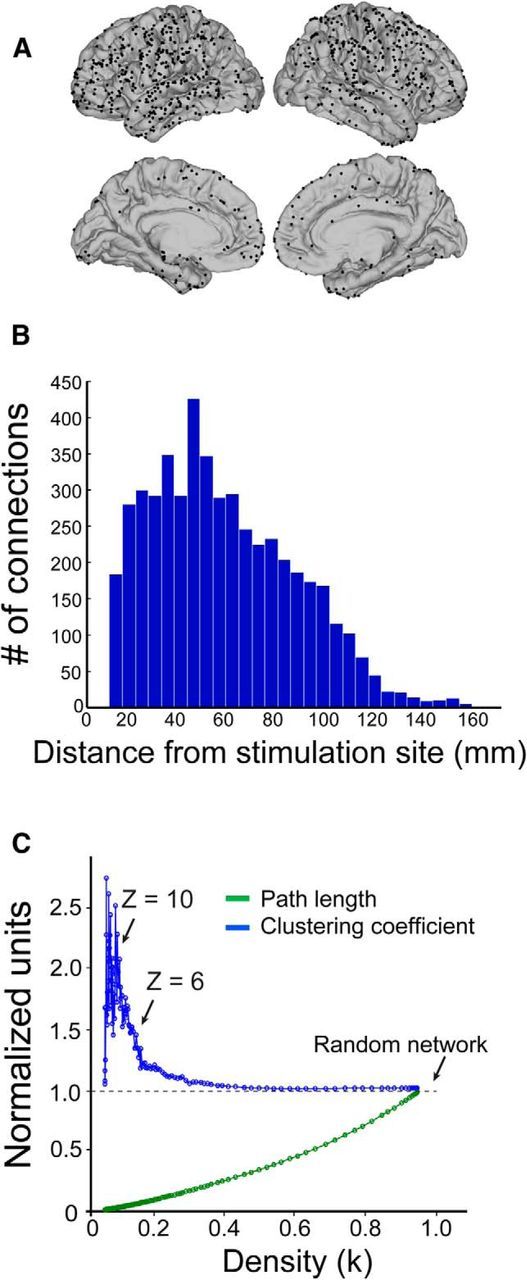
CCEP networks exhibit small-world characteristics. A, Location of all electrodes plotted on the average cortical surface. B, Degree distribution across all stimulation sites. CCEP directed networks consist of abundant short-range and sparse long-range connections. C, Path length and clustering coefficient as a function of network density. CCEP networks are normalized to 100 random networks with equivalent indegree and outdegree.
We next examined how network properties varied as a function of the threshold used to binarize the CCEP network. At each node, outdegree measures at a threshold of z = 6 were plotted against those at z = 10 (Fig. 3D). A linear relationship (r = 0.96, p < 0.01) was observed, supporting the notion that CCEP networks are largely density insensitive in the threshold range that exhibit small world topology. Then, we investigated the extent to which network properties derived from CCEPs are influenced by distance between the stimulating and recording electrode. One would predict that electrodes close to the stimulation site would exhibit larger evoked potentials, and thus electrodes with the most neighbors (i.e., at the center of the grid) exhibit the highest number of significant connections. To estimate the effects of this distance bias, we generated simulated data from a model in which CCEP amplitude was inversely proportional to the distance from the stimulation site (Fig. 3E). As expected, the nodes with highest degree under this model were located in the center of the grid. The distance effect does not resemble the empirical data, however, and in particular it cannot explain how regions with the highest degree empirically were located at the corner of the grid, with few proximal electrodes (Fig. 3E). Thus, distance alone does not account for the network topographies we report.
Network analysis of CCEPs reveals projectors and integrators of neocortical circuits
To examine the topological organization of the cortex, we calculated network measures including causal indegree, outdegree, degree, and net flow at each electrode. Analysis from a single subject demonstrates the transformation from the suprathreshold CCEP response profile at a single stimulation site (Fig. 5A,B) to the cortical representation of network measures (Fig. 5C). In this subject, regions of high outdegree and degree centrality are localized to sensorimotor regions, whereas temporal lobe nodes exhibit high indegree. Causal flow (outdegree − indegree) was in this subject, outward at sensorimotor cortex and inwards in the temporal lobe (Fig. 5C). Examples from six subjects illustrate consistently high outdegree measures in para-central cortex (Fig. 6). Indegree, which exhibited a less consistent topography across subjects, is discussed below.
Figure 5.

Graph theory measures in one subject. Examples of nodes with high causal (A) outdegree and (B) indegree. For each brain, only suprathreshold CCEPs are plotted and represented with a line connecting the stimulating electrode to the response site. C, Network measures across all stimulation sites. Network measures are represented at each node with a heat map according to its z-thresholded network measure.
Figure 6.

Causal outdegree measures across subjects. Note the strong outdegree around the central sulcus. Warm colors represent regions with strong outdegree.
To provide a subject-averaged measure of the key projectors and integrator nodes, network measures were averaged across cortical regions. After determining the cortical area where each electrode was implanted based on the cortical parcellation procedure (see Materials and Methods), we calculated the mean network measures across all electrodes in each region (Fig. 7). The precentral gyrus, the postcentral gyrus, lingual gyrus, and the temporal pole exhibited the highest causal outdegree, and casual outflow. The rostral and caudal middle frontal gyrus and superior and inferior regions of parietal cortex exhibited the highest indegree, and also exhibited net inflow of influence.
Figure 7.

Functional and anatomical network analysis across subjects. Causal outdegree, indegree, degree, and flow for each subject are normalized and averaged. The bar graph on the left of each network measure compares the relationship between anatomical regions and Z-score normalized connectivity across subjects. Mean network measures from electrodes found within cortical regions defined by an automated parcellation. Regions with <4 electrodes were discarded from the analysis. Each area was compared with the region with the most positive connectivity (leftmost bar) in each category. The bar graph on the right represents the relationship between corticocortical connectivity and functional regions (as defined by ESM) across subjects. Number of electrodes used for ESM analysis: N = 94 (motor response), 37 (language response). Error bars represent SEM; *p < 0.05, **p < 0.01, unpaired t test.
Relationship to excitability
It is important to minimize the possibility that the reported regional differences in causal influence are not driven by differences in the excitability of the neural tissues beneath the stimulated electrodes. We aimed to rule out this possibility in two ways. First, we examined the relationship between network measures and local excitability, where local excitability was estimated using the CCEP profile of nearby electrodes. Second, we examined the indegree and outdegree of seizure onset zones, which are known to exhibit increased excitability (Valentín et al., 2005; Enatsu et al., 2012).
First, to investigate excitability via local CCEP connectivity, we computed the (1) mean magnitude of local (<15 mm) CCEP responses upon stimulation of each site and (2) the network measure (degree, indegree, outdegree) associated with that site. Within all individual subjects, and for both the A1 and A2 poststimulation interval, no significant relationship existed between the mean local connectivity around each stimulation site and the node degree (rA1 degree, local = 0.03; rA2 degree, local = 0.04), outdegree (rA1 outdegree, local = 0.06; rA2 outdegree, local = 0.07), and indegree (rA1 indegree, local = 0.04; rA2 indegree, local = 0.02).
Second, to relate intrinsically excitable tissue within the seizure onset zone to network measures, we characterized the CCEP indegree and outdegee within the seizure onset zones identified within each individual subject. Seizure onset zone regions exhibited higher indegree than regions not involved in the seizure onset (Fig. 4; p < 0.05). No significant differences were observed between seizure onset zone regions and outdegree. Similar results were observed when using the non-z-transformed and the z-transformed CCEP amplitudes (results reported were based on non-z-transformed amplitudes).
Relating network measures to functional traits of cortical subsystems
We next asked how underlying cortical function and anatomy relates to the strength of evoked potentials in that region. We defined a region to be involved in a certain function if high-frequency ESM of that region elicited a behavioral response (e.g., speech arrest, hand motor response). Electrodes that elicited motor responses during ESM exhibited significantly higher causal indegree, outdegree, degree centrality, and net outflow compared with electrodes not involved in movement (p < 0.01, two-tailed t test). Electrodes involved in language (expressive or receptive speech) exhibited significantly higher causal indegree, degree centrality, and causal outflow compared with electrodes not involved in these functions (Fig. 7).
Distinct functional and effective connectivity profiles
How do directed, effective connectivity measures compare to undirected, functional connectivity measures? To investigate this, we compared the single-site and global connectivity profiles of CCEPs (effective connectivity) and ECoG (functional connectivity). The single-site connectivity profiles are the set of connections between a given electrode pair and all others, while the global connectivity profiles reflect overall connectedness regardless of spatial distribution (see Materials and Methods). Across all ROIs and patients, the mean correspondence between local connectivity profiles (or the spatial correspondence of network measures) for ECoG and CCEP networks were r = 0.38 (range r = 0.25–0.52 across patients) for the A1 timeframe and r = 0.36 (range r = 0.23–0.54) for the A2 timeframe. However, because these correlations are computed on local connectivity profiles, they normalize the mean connectivity of each node, and do not indicate whether global network features (such as degree) are shared across the ECoG and CCEP networks.
Therefore, we next investigated the relationship between global connectivity profiles of CCEP and ECoG networks by creating group-based surface maps (see Materials and Methods). ECoG network analysis revealed high degree centrality in the anterior temporal, prefrontal, and superior parietal regions (Fig. 8A). CCEP network analysis revealed regions of strong causal degree, outdegree, and outflow localized to precentral and postcentral gyrus, supplementary motor area, and posterior MTG and ITG (Fig. 8C). High causal indegree was observed in precentral and postcentral, parietal, and prefrontal regions, and causal inflow was localized to prefrontal, parietal, and anterior STG (Fig. 6B). Compared with resting ECoG degree, CCEP outdegree, degree, and flow exhibited a strong negative correlation (Fig. 8D; rccep outdegree, ecog degree = −0.60; rccep degree, ecog degree = −0.57; rccep net flow, ecog degree = −0.46; p < 0.001; parcellation-based comparison), whereas CCEP indegree exhibited a weaker albeit significant negative correlation with the resting ECoG degree map (r = −0.24). CCEP measures demonstrated a weaker, but similar, relationship when ECoG degree was defined by a simple correlation of the raw unfiltered voltage (Fig. 8B; recog HGP degree, ecog raw degree = 0.59; rccep outdegree, ecog degree = −0.38; rccep degree, ecog degree = −0.24; rccep net flow, ecog degree = −0.46; rccep indegree, ecog degree = 0.14). CCEP measures also demonstrated a similar relationship when ECoG degree was calculated using faster frequencies (>1 Hz) within the HGP signal (rccep outdegree, ecog degree = −0.32; rccep degree, ecog degree = −0.15; rccep net flow, ecog degree = −0.45; rccep indegree, ecog degree = 0.24). Slower frequencies (<0.1 Hz) within the HGP range were not examined for reasons discussed previously (Keller et al., 2013). Similar findings were also observed using CCEP values within the A2 timeframe (data not shown). In summary, whereas single-site connectivity profiles of ECoG and CCEP maps were relatively strongly correlated, the global connectivity profiles of ECoG and CCEP maps were negatively correlated.
CCEP networks exhibit low functional reciprocity between cortical regions
What could explain the differences in global connectivity between effective and functional networks? We hypothesized (resting) functional connections seen with ECoG were most likely to correspond to (stimulation-driven) effective connections seen with CCEP when the effective connections were reciprocal. To test this hypothesis, we first had to characterize the proportion of bidirectional interactions (reciprocity index, B) across nodes and subjects in our CCEP data.
In each subject, the level of reciprocity varied widely across nodes (Fig. 9A,B). Across all subjects and nodes, the mean reciprocity (Bmean) was 9.4% (range, B = 0.0–50.2%, 11.1% SD). In both the empirical CCEP data as well as the simulated CCEP data examining reciprocal interactions, reciprocity decreased as distance from the stimulation site increased (Fig. 9C,D). Short-range (<5 cm) reciprocity was found to be significantly higher than predicted by the control analysis (see Materials and Methods) across all subjects in the A1 timeframe (Fig. 9C; CCEPmean = 24.1%, modelmean = 10.8%, p < 0.001, two-tailed t test), whereas long-range connections did not exhibit a significant change in reciprocity compared with the control analysis (Fig. 9D; CCEPmean = 9.1%, modelmean = 9.7%). The A2 timeframe demonstrated similar findings (data not shown). To ensure that the cutoff for defining significance did not affect these results, we recalculated reciprocity using three levels of threshold. As expected, reciprocity increased for lower thresholds CCEPz = 6 = 24.1% (±5.2 SE); CCEPz = 4 = 29.5% (±4.6 SE); CCEPz = 2 = 46.2% (±4.8% SE) for short-range connections and CCEPz = 6 = 9.1% (±3.1% SE); CCEPz = 4 = 12.1% (±4.9% SE); CCEPz = 2 = 29.7% (±6.1% SE) for long-range connections. For each threshold, short-range reciprocity was significantly higher than expected from a random network model, while long-range reciprocity was not. For the regional-based reciprocity analysis, reciprocity was higher than for the electrode-based approach, with CCEP regional-based reciprocity at 73.1% and 42.3% for short- and long-range connections, respectively (Fig. 9C,D). Both short- and long-range connectivity did not exhibit higher reciprocity than expected given the degree distribution of the network.
Figure 9.

Corticocortical interareal reciprocity is higher than expected. Examples of nodes with (A) high- and (B) low-reciprocity. Blue lines denote causal outputs (stimulation at central site evoked a significant response at other sites) and red lines causal input (stimulation evoked a significant response at center node). Average CCEPs recorded from response site are overlaid. C, D, Reciprocity measurements comparing empirical and simulated data across subjects. Pairwise regions were categorized as short- (< 5 cm) and long-range (> 5 cm separation distance) connections and CCEP data were compared with control conditions. Analysis was performed for (C) each electrode and (D) grouped electrodes in a region-based analysis.
Reciprocity of stimulation-evoked responses predicts the strength of spontaneous interareal correlations
Having mapped the reciprocity of CCEP effective connections, we investigated its relationship with interareal resting ECoG functional connectivity. One might hypothesize that specific reciprocal connections are sites of important functional interaction, which may be reflected in stronger functional connectivity (i.e., dynamical correlation) between regions. Figure 10A illustrates CCEP input maps (examining the evoked response measured at the center node when stimulating other regions) as well as CCEP output maps (examining the CCEP response measured when stimulating the center node) and ECoG functional connectivity maps for a range of electrodes. Across subjects, regions of strong ECoG correlation demonstrated larger CCEP responses than those regions of weak ECoG correlation (Fig. 10B, top; p < 0.001). Note in Figure 8A longer-range stimulation-evoked responses (unidirectional connections) occasionally corresponded to a strong ECoG correlation (black arrowhead), but edges with reciprocal CCEP connectivity (overlap between CCEP inputs and outputs) were more likely to exhibit ECoG correlation (white arrowheads). To quantify this, we mapped the strength of the resting ECoG connectivity as a function of the type of CCEP connection (bidirectional significant connection, unidirectional significant connection, no significant connection). Across subjects, for short distances (<5 cm), bidirectional CCEPs mapped to regions of the strongest ECoG correlations, followed by unidirectional responses, with regions of subthreshold CCEP responses corresponding to the weakest ECoG correlation values (Fig. 10C, top; p < 0.01 corrected for after multiple comparisons). This trend was consistent in 12/15 subjects before normalization (p = 0.02, paired t test). In contrast, for long-range connections (>5 cm), the strength of ECoG correlations did not vary as a function of the reciprocity or the presence of CCEP connections (Fig. 10B,C; bottom). For the regional-based analysis, long-range bidirectional CCEPs between parcellations exhibited stronger resting ECoG connectivity compared with unidirectional and no significant CCEPs. However, no significant difference was observed for short-range connections (Fig. 10D).
Figure 10.

Reciprocal effective connections underlie strong interareal functional connectivity. A, Examples of networks with distinct CCEP inputs and outputs. Note that the resting ECoG correlations are strongest in regions of CCEP bidirectionality (white arrowheads) and weaker at regions of unidirectional CCEPs (black arrowheads). B, Strong ECoG correlations predict strong CCEP connectivity. ECoG correlations are thresholded at the 95th percentile to determine significance. Top, The ECoG correlations for short-range (< 5 cm) connections. Bottom, The ECoG correlations for long-range (> 5 cm) connections. C, D, The mean ECoG correlation between regions of bidirectional significant CCEPs, unidirectional CCEPs, and no significant CCEPs for short-range (top) and long-range (bottom) connections. Each subject's data are normalized to the average ECoG correlation in the bidirectional group. Analysis is performed for (C) each pair of electrodes, as well as (D) each set of regions. All bar graphs represent group analysis. Error bars denote SEM; *p < 0.05, **p < 0.01, ***p < 0.001.
Discussion
This study provides important insights into the directedness of networks in human cortex using direct stimulation and recording. Our findings can be summarized as follows: (1) peri-Rolandic cortex and frontal and temporal regions that were identified to have language or motor function with electrical stimulation mapping, exhibited the highest causal outdegree, centrality, and projected influence whereas the superior parietal, lateral temporal, and lateral prefrontal regions exhibited strong causal indegree and received influence; (2) maps of effective and functional connectivity demonstrated positively correlated single-site connectivity profiles but negatively correlated overall topology; and (3) functional corticocortical reciprocity across all regions was low, decreased with distance, and at short distances reciprocal connections were associated with strong interareal interactions at rest.
Language and sensorimotor networks: central cortical hubs?
It has long been known that the motor cortex projects a copy of internally generated movement to other sensory systems to estimate the intrinsic response and measure the influence from external stimuli. Although the behavioral effect of this “corollary discharge” or “efference copy” is well described, the neural representation of these projections are not well characterized in humans (Poulet and Hedwig, 2007). This would likely manifest in outgoing projections from motor cortex to a diverse array of cortical and subcortical regions. We observed sensorimotor regions exhibiting abundant connections to other cortical regions in language, somatosensory, auditory, and visual cortex. It is possible this observation may represent the neural correlate of the corollary discharge; however, further work coupling electrophysiology with behavioral studies is necessary to experimentally validate this finding. Nevertheless, the high centrality of motor cortex demonstrates that internal motor representation appears to be a ubiquitous feature of functional networks.
It is not likely that differences in the topology of networks across cortical regions can be attributed to the intrinsic excitability of the stimulated region. First, no relationship between the strength of neighboring CCEPs and outdegree measures was observed, supporting the notion that changes in excitability do not underlie differences in network measures. Second, seizures arise from the imbalance of excitation and inhibition that can result in high intrinsic excitability within the seizure onset zone (Valentín et al., 2005). Therefore, if CCEPs reflect the intrinsic excitability of a given region, stimulation of the seizure onset zone should result in stronger and more abundant CCEPs at other regions. To the contrary, we found slightly higher indegree but no difference in outdegree in the seizure onset zone. Together, these findings suggest that regions of high outdegree including sensorimotor and posterior temporal regions does not reflect differences in excitability and instead are likely the major cortical projectors of the brain.
Asymmetry in large-scale networks
Although it is well established that the majority of synaptic connections in the brain are reciprocal in nature (Felleman and Van Essen, 1991), an asymmetric global connectivity would allow the efficient processing, integration, and storage of incoming sensory stimuli. We observed a high degree of asymmetry (low reciprocity) among large-scale cortical circuits. As expected, this level of reciprocity was higher at lower significance thresholds. Tracer studies largely focus on local connectivity within a given sensory region, which tends to be strongly interconnected with feedforward and feedback connections (Felleman and Van Essen, 1991). It is important to note that the presence of a reciprocal anatomical connection does not necessarily indicate a reciprocal functional or effective connection. Previous examination of the directionality of the anterior and posterior language cortices revealed that although stimulation of either language region resulted in CCEPs at the other language region, an asymmetry was observed, wherein stimulation of anterior language regions elicited stronger CCEPs in posterior language regions than anterior CCEPs elicited from stimulation of posterior regions (Matsumoto et al., 2004). Quantification of CCEP reciprocity in a single sensory system has reported reciprocal connections 75–95% of time within the sensorimotor network, but decreased to 25–50% when evaluating reciprocity at specific electrodes (Matsumoto et al., 2007). These reciprocity values are in line with those in the current study, especially considering that reciprocity was calculated across multiple functional systems. As previous tracer and CCEP studies examined shorter-range connectivity often focusing on a single sensory system, it is not surprising that we observed this higher level of functional asymmetry across networks.
Compared with our model, the frequency of short-range suprathreshold CCEPs was found to be higher than expected for both timeframes of the CCEP but no different for long-range interactions. The short-range observations are in line with these networks exhibiting small-world topology (Bassett and Bullmore, 2006; Sporns and Honey, 2006). It is important to note that this asymmetry between regions may not only reflect differences in direct synaptic pathways. For example, stimulation of site A may elicit evoked responses at site B through direct corticocortical pathways, whereas stimulation of site B may elicit an evoked response at site A through a cortical or subcortical intermediate region. It is also important to note that some of the reciprocal connections in the brain may be missed due to the electrode grid spacing for each patient. Nevertheless, under either interpretation, the present results constitute causal evidence of large-scale asymmetric propagation across the brain.
Reciprocity influences interareal functional connectivity
Although corticocortical interactions are largely asymmetric, their reciprocal nature appears to be associated with the strength of spontaneous interareal interactions. Network topology from effective connectivity networks (high centrality at peri-Rolandic cortex in CCEP) differed from observations in functional connectivity networks (low centrality in sensorimotor cortex and high centrality in parietal, anterior temporal, and prefrontal regions in resting ECoG) in the same subjects. The topology of functional connectivity derived from resting ECoG networks support previous literature on resting fMRI and diffusion tensor imaging which report low centrality in primary sensory regions and high centrality in the default mode network (Hagmann et al., 2008; Buckner et al., 2009; Zuo et al., 2012). The corroboration of functional connectivity maps in these subjects with the literature reinforces the notion that electrode sampling bias does not confound our results. However, within-subject differences between effective and functional connectivity were unexpected. Quantification of the local and global connectivity profile of both modalities demonstrated positive correspondence between the local connectivity profiles and negative correspondence between the global connectivity profiles.
We believe that these techniques measuring slightly different neuronal processes account for the discrepancy between local and global connectivity profiles and may shed light on the neural substrates underlying resting state functional connectivity. It is first important to note that although findings presented here as well as previous studies both demonstrated a positive correspondence between CCEPs and resting state measures in local connectivity profiles (Keller et al., 2011), the strength and spatial spread of CCEPs explained only ∼20% of the functional connectivity profile, suggesting that CCEPs and functional connectivity represent slightly different neuronal processes. The motor network can serve as an example to explain these discrepancies between modalities. Stimulation of the motor cortex results in strong evoked potentials both in regions exhibiting strong resting ECoG correlations but also at more distant sites exhibiting low resting ECoG correlations. These connectivity profiles result in a positive (but not very high) correspondence between modalities. In this example, a high outdegree in motor cortex for CCEPs and a low resting ECoG degree would result in a negative correspondence in global connectivity profiles. In this fashion, we believe that CCEPs may probe the complete set of available anatomical connections, whereas resting functional connectivity highlights the subset used during specific brain states. Evaluating the relationship between CCEP and resting ECoG topology during different brain states would directly test this hypothesis. Another explanation for the discrepancy between local and global connectivity profiles is that the calculation of the local connectivity profile does not account for differences in CCEP reciprocity and instead only evaluates unidirectional responses. We demonstrated that regions underlying reciprocal effective connections exhibit stronger functional connections, suggesting that reciprocal connectivity in the brain may underlie the strength of functional interactions.
Implications and limitations
CCEP networks described here provide extensive coverage of the lateral and inferior human cortex. Although this method cannot provide whole brain coverage compared with fMRI or diffusion tensor imaging, it does exhibit three notable advantages: (1) the ability to resolve direction of flow, (2) the direct recording of neural activity on the cortical surface, and (3) high spatiotemporal resolution. Although each subject did not provide whole brain coverage, group analysis allowed the sampling of the majority of cortical regions on the lateral, medial, and inferior cortex.
Although these subjects provide access to a direct measure of neural activity in awake humans, it is difficult to interpolate findings about brain networks from these patients to the general population. However, the heterogeneous etiology and localization of seizures in the patient population, removal of electrodes in the seizure onset zone for this analysis, and the consistency of findings across subjects support the notion that these results may be interpolated with some level of confidence. Future studies will help elucidate the neural mechanism underlying CCEPs. Additionally, experiments enhancing our understanding of how behavioral states modulate functional and effective connectivity will aid in the interpretation of findings presented here.
Footnotes
This work was funded the National Institute of Neurological Disorders and Stroke (F31NS080357-01 and T32-GM007288 to C.J.K.) and the Epilepsy Foundation of America (EFA189045 to C.J.K.), Page and Otto Marx Jr Foundation (A.D.M.), and OTKA K81357 and KTIA NAP-13 (I.U.). We thank G. Klein, M. Argyelan, and A. Dykstra for help with developing methodology to coregister electrode location with anatomical information. We also thank the patients that participated in this study, as well as the nursing and physician staff North Shore LIJ.
The authors declare no competing financial interests.
References
- Achard S, Bullmore E. Efficiency and cost of economical brain functional networks. PLoS Comput Biol. 2007;3:e17. doi: 10.1371/journal.pcbi.0030017. [DOI] [PMC free article] [PubMed] [Google Scholar]
- Bassett DS, Bullmore E. Small-world brain networks. Neuroscientist. 2006;12:512–523. doi: 10.1177/1073858406293182. [DOI] [PubMed] [Google Scholar]
- Bassett DS, Meyer-Lindenberg A, Achard S, Duke T, Bullmore E. Adaptive reconfiguration of fractal small-world human brain functional networks. Proc Natl Acad Sci U S A. 2006;103:19518–19523. doi: 10.1073/pnas.0606005103. [DOI] [PMC free article] [PubMed] [Google Scholar]
- Bassett DS, Bullmore E, Verchinski BA, Mattay VS, Weinberger DR, Meyer-Lindenberg A. Hierarchical organization of human cortical networks in health and schizophrenia. J Neurosci. 2008;28:9239–9248. doi: 10.1523/JNEUROSCI.1929-08.2008. [DOI] [PMC free article] [PubMed] [Google Scholar]
- Biswal BB, Mennes M, Zuo XN, Gohel S, Kelly C, Smith SM, Beckmann CF, Adelstein JS, Buckner RL, Colcombe S, Dogonowski AM, Ernst M, Fair D, Hampson M, Hoptman MJ, Hyde JS, Kiviniemi VJ, Kötter R, Li SJ, Lin CP, et al. Toward discovery science of human brain function. Proc Natl Acad Sci U S A. 2010;107:4734–4739. doi: 10.1073/pnas.0911855107. [DOI] [PMC free article] [PubMed] [Google Scholar]
- Buckner RL, Sepulcre J, Talukdar T, Krienen FM, Liu H, Hedden T, Andrews-Hanna JR, Sperling RA, Johnson KA. Cortical hubs revealed by intrinsic functional connectivity: mapping, assessment of stability, and relation to Alzheimer's disease. J Neurosci. 2009;29:1860–1873. doi: 10.1523/JNEUROSCI.5062-08.2009. [DOI] [PMC free article] [PubMed] [Google Scholar]
- Bullmore E, Sporns O. Complex brain networks: graph theoretical analysis of structural and functional systems. Nat Rev Neurosci. 2009;10:186–198. doi: 10.1038/nrn2575. [DOI] [PubMed] [Google Scholar]
- Burkhalter A, Bernardo KL. Organization of corticocortical connections in human visual cortex. Proc Natl Acad Sci U S A. 1989;86:1071–1075. doi: 10.1073/pnas.86.3.1071. [DOI] [PMC free article] [PubMed] [Google Scholar]
- Chu CJ, Kramer MA, Pathmanathan J, Bianchi MT, Westover MB, Wizon L, Cash SS. Emergence of stable functional networks in long-term human electroencephalography. J Neurosci. 2012;32:2703–2713. doi: 10.1523/JNEUROSCI.5669-11.2012. [DOI] [PMC free article] [PubMed] [Google Scholar]
- Conner CR, Ellmore TM, DiSano MA, Pieters TA, Potter AW, Tandon N. Anatomic and electro-physiologic connectivity of the language system: a combined DTI-CCEP study. Comput Biol Med. 2011;41:1100–1109. doi: 10.1016/j.compbiomed.2011.07.008. [DOI] [PMC free article] [PubMed] [Google Scholar]
- Dale AM, Fischl B, Sereno MI. Cortical surface-based analysis: I. Segmentation and surface reconstruction. Neuroimage. 1999;9:179–194. doi: 10.1006/nimg.1998.0395. [DOI] [PubMed] [Google Scholar]
- Duncan JS, Papademetris X, Yang J, Jackowski M, Zeng X, Staib LH. Geometric strategies for neuroanatomic analysis from MRI. Neuroimage. 2004;23:S34–S45. doi: 10.1016/j.neuroimage.2004.07.027. [DOI] [PMC free article] [PubMed] [Google Scholar]
- Dykstra AR, Chan AM, Quinn BT, Zepeda R, Keller CJ, Cormier J, Madsen JR, Eskandar EN, Cash SS. Individualized localization and cortical surface-based registration of intracranial electrodes. Neuroimage. 2012;59:3563–3570. doi: 10.1016/j.neuroimage.2011.11.046. [DOI] [PMC free article] [PubMed] [Google Scholar]
- Enatsu R, Piao Z, O'Connor T, Horning K, Mosher J, Burgess R, Bingaman W, Nair D. Cortical excitability varies upon ictal onset patterns in neocortical epilepsy: a cortico-cortical evoked potential study. Clin Neurophysiol. 2012;123:252–260. doi: 10.1016/j.clinph.2011.06.030. [DOI] [PubMed] [Google Scholar]
- Felleman DJ, Van Essen DC. Distributed hierarchical processing in the primate cerebral cortex. Cereb Cortex. 1991;1:1–47. doi: 10.1093/cercor/1.1.1. [DOI] [PubMed] [Google Scholar]
- Fischl B, van der Kouwe A, Destrieux C, Halgren E, Ségonne F, Salat DH, Busa E, Seidman LJ, Goldstein J, Kennedy D, Caviness V, Makris N, Rosen B, Dale AM. Automatically parcellating the human cerebral cortex. Cereb Cortex. 2004;14:11–22. doi: 10.1093/cercor/bhg087. [DOI] [PubMed] [Google Scholar]
- Fox MD, Raichle ME. Spontaneous fluctuations in brain activity observed with functional magnetic resonance imaging. Nat Rev Neurosci. 2007;8:700–711. doi: 10.1038/nrn2201. [DOI] [PubMed] [Google Scholar]
- Hagmann P, Cammoun L, Gigandet X, Meuli R, Honey CJ, Wedeen VJ, Sporns O. Mapping the structural core of human cerebral cortex. PLoS Biol. 2008;6:e159. doi: 10.1371/journal.pbio.0060159. [DOI] [PMC free article] [PubMed] [Google Scholar]
- Honey CJ, Sporns O, Cammoun L, Gigandet X, Thiran JP, Meuli R, Hagmann P. Predicting human resting-state functional connectivity from structural connectivity. Proc Natl Acad Sci U S A. 2009;106:2035–2040. doi: 10.1073/pnas.0811168106. [DOI] [PMC free article] [PubMed] [Google Scholar]
- Honey CJ, Thesen T, Donner TH, Silbert LJ, Carlson CE, Devinsky O, Doyle WK, Rubin N, Heeger DJ, Hasson U. Slow cortical dynamics and the accumulation of information over long timescales. Neuron. 2012;76:423–434. doi: 10.1016/j.neuron.2012.08.011. [DOI] [PMC free article] [PubMed] [Google Scholar]
- Kanwisher N, McDermott J, Chun MM. The fusiform face area: a module in human extrastriate cortex specialized for face perception. J Neurosci. 1997;17:4302–4311. doi: 10.1523/JNEUROSCI.17-11-04302.1997. [DOI] [PMC free article] [PubMed] [Google Scholar]
- Keller CJ, Bickel S, Entz L, Ulbert I, Milham MP, Kelly C, Mehta AD. Intrinsic functional architecture predicts electrically evoked responses in the human brain. Proc Natl Acad Sci U S A. 2011;108:10308–10313. doi: 10.1073/pnas.1019750108. [DOI] [PMC free article] [PubMed] [Google Scholar]
- Keller CJ, Bickel S, Honey CJ, Groppe DM, Entz L, Craddock RC, Lado FA, Kelly C, Milham M, Mehta AD. Neurophysiological investigation of spontaneous correlated and anticorrelated fluctuations of the BOLD signal. J Neurosci. 2013;33:6333–6342. doi: 10.1523/JNEUROSCI.4837-12.2013. [DOI] [PMC free article] [PubMed] [Google Scholar]
- Kramer MA, Eden UT, Kolaczyk ED, Zepeda R, Eskandar EN, Cash SS. Coalescence and fragmentation of cortical networks during focal seizures. J Neurosci. 2010;30:10076–10085. doi: 10.1523/JNEUROSCI.6309-09.2010. [DOI] [PMC free article] [PubMed] [Google Scholar]
- Manning JR, Jacobs J, Fried I, Kahana MJ. Broadband shifts in local field potential power spectra are correlated with single-neuron spiking in humans. J Neurosci. 2009;29:13613–13620. doi: 10.1523/JNEUROSCI.2041-09.2009. [DOI] [PMC free article] [PubMed] [Google Scholar]
- Matsumoto R, Nair DR, LaPresto E, Najm I, Bingaman W, Shibasaki H, Lüders HO. Functional connectivity in the human language system: a cortico-cortical evoked potential study. Brain. 2004;127:2316–2330. doi: 10.1093/brain/awh246. [DOI] [PubMed] [Google Scholar]
- Matsumoto R, Nair DR, LaPresto E, Bingaman W, Shibasaki H, Lüders HO. Functional connectivity in human cortical motor system: a cortico-cortical evoked potential study. Brain. 2007;130:181–197. doi: 10.1093/brain/awl257. [DOI] [PubMed] [Google Scholar]
- Mehta AD, Klein G. Clinical utility of functional magnetic resonance imaging for brain mapping in epilepsy surgery. Epilepsy Res. 2010;89:126–132. doi: 10.1016/j.eplepsyres.2009.12.001. [DOI] [PubMed] [Google Scholar]
- Miller KJ, Makeig S, Hebb AO, Rao RP, denNijs M, Ojemann JG. Cortical electrode localization from X-rays and simple mapping for electrocorticographic research: the “location on cortex” (LOC) package for MATLAB. J Neurosci Methods. 2007;162:303–308. doi: 10.1016/j.jneumeth.2007.01.019. [DOI] [PubMed] [Google Scholar]
- Mukamel R, Gelbard H, Arieli A, Hasson U, Fried I, Malach R. Coupling between neuronal firing, field potentials, and FMRI in human auditory cortex. Science. 2005;309:951–954. doi: 10.1126/science.1110913. [DOI] [PubMed] [Google Scholar]
- Nir Y, Mukamel R, Dinstein I, Privman E, Harel M, Fisch L, Gelbard-Sagiv H, Kipervasser S, Andelman F, Neufeld MY, Kramer U, Arieli A, Fried I, Malach R. Interhemispheric correlations of slow spontaneous neuronal fluctuations revealed in human sensory cortex. Nat Neurosci. 2008;11:1100–1108. doi: 10.1038/nn.2177. [DOI] [PMC free article] [PubMed] [Google Scholar]
- Ossandón T, Jerbi K, Vidal JR, Bayle DJ, Henaff MA, Jung J, Minotti L, Bertrand O, Kahane P, Lachaux JP. Transient suppression of broadband gamma power in the default-mode network is correlated with task complexity and subject performance. J Neurosci. 2011;31:14521–14530. doi: 10.1523/JNEUROSCI.2483-11.2011. [DOI] [PMC free article] [PubMed] [Google Scholar]
- Oya H, Poon PW, Brugge JF, Reale RA, Kawasaki H, Volkov IO, Howard MA., 3rd Functional connections between auditory cortical fields in humans revealed by Granger causality analysis of intra-cranial evoked potentials to sounds: comparison of two methods. Bio Systems. 2007;89:198–207. doi: 10.1016/j.biosystems.2006.05.018. [DOI] [PubMed] [Google Scholar]
- Poulet JF, Hedwig B. New insights into corollary discharges mediated by identified neural pathways. Trends Neurosci. 2007;30:14–21. doi: 10.1016/j.tins.2006.11.005. [DOI] [PubMed] [Google Scholar]
- Rubinov M, Sporns O. Complex network measures of brain connectivity: uses and interpretations. Neuroimage. 2010;52:1059–1069. doi: 10.1016/j.neuroimage.2009.10.003. [DOI] [PubMed] [Google Scholar]
- Seth AK. Causal connectivity analysis of evolved neural networks during behavior. Network. 2005;16:35–54. doi: 10.1080/09548980500238756. [DOI] [PubMed] [Google Scholar]
- Smith SM, Miller KL, Salimi-Khorshidi G, Webster M, Beckmann CF, Nichols TE, Ramsey JD, Woolrich MW. Network modelling methods for FMRI. Neuroimage. 2011;54:875–891. doi: 10.1016/j.neuroimage.2010.08.063. [DOI] [PubMed] [Google Scholar]
- Sporns O, Honey CJ. Small worlds inside big brains. Proc Natl Acad Sci U S A. 2006;103:19219–19220. doi: 10.1073/pnas.0609523103. [DOI] [PMC free article] [PubMed] [Google Scholar]
- Valentín A, Alarcón G, Honavar M, García Seoane JJ, Selway RP, Polkey CE, Binnie CD. Single pulse electrical stimulation for identification of structural abnormalities and prediction of seizure outcome after epilepsy surgery: a prospective study. Lancet Neurol. 2005;4:718–726. doi: 10.1016/S1474-4422(05)70200-3. [DOI] [PubMed] [Google Scholar]
- Yan C, He Y. Driving and driven architectures of directed small-world human brain functional networks. PloS One. 2011;6:e23460. doi: 10.1371/journal.pone.0023460. [DOI] [PMC free article] [PubMed] [Google Scholar]
- Zuo XN, Ehmke R, Mennes M, Imperati D, Castellanos FX, Sporns O, Milham MP. Network centrality in the human functional connectome. Cereb Cortex. 2012;22:1862–1875. doi: 10.1093/cercor/bhr269. [DOI] [PubMed] [Google Scholar]