


Abstract
The organization of the human dystrophin gene into loop domains has been studied using two different experimental approaches: excision of DNA loops mediated by nuclear matrix-bound topoisomerase II and in situ hybridization of different probes with histone-depleted nuclei (nuclear halos). Our objective was to examine if the DNA loops mapped by this biochemical approach coincide with loops visualized by microscopy. The results obtained using both approaches were in good agreement. Eight loops separated by attachment regions of different length were mapped in the upstream part (up to exon 54) of the gene by topoisomerase II-mediated excision. One of these loops was then directly visualized by in situ hybridization of the corresponding bacmid clone with nuclear halos. This is the first direct demonstration that a DNA domain mapped as a loop using a biochemical approach corresponds to a loop visible on cytological preparations. The validity of this result and of the whole map of loop domains was confirmed by in situ hybridization using probes derived from other attachment regions or loops mapped by topoisomerase II-mediated cleavage; these probes hybridized on the core or halo region, respectively, of nuclear halos. Our results demonstrate that a single transcription unit may be organized into several loops and that DNA loop attachment regions may be fairly long. Three out of four replication origins mapped in this gene co-localize with loop attachment regions, and the major deletion hot spot is harbored in an attachment region. These results strongly suggest that partitioning of genomic DNA into specific loops attached to a skeletal structure is a characteristic feature of eukaryotic chromosome organization in interphase.
INTRODUCTION
It has become increasingly evident that epigenetic factors play an important role in eukaryotic genome functioning. As well as DNA methylation and modifications of histones (1), the mechanisms which determine specific positioning of individual DNA sequences within nuclei can also be regarded as a part of epigenetic regulatory systems. Folding of DNA into a nucleosomal fiber may bring together relatively distant protein binding sites (2) and higher-order chromatin folding may bring together regulatory sequences separated by dozens of kilobases of DNA and thus favor the assembly of active chromatin hubs (3). To understand better the mechanisms of these long-distance interactions of regulatory elements it is necessary to clarify the basic principles of DNA packaging in interphase chromosomes, especially at higher levels of DNA compaction. At present, our knowledge about these levels of DNA spatial organization in the nucleus is rather schematic and far from complete. According to the radial loop model of eukaryotic chromosomes the chain of nucleosomes is packed into a 30 nm-diameter fibril which is organized into large loops attached to a scaffold or matrix (4–7), and although this model has been discussed in the literature over the last 25 years it still remains neither proven nor disproved [for a review see Heng et al. (8)]. Several approaches were developed to map the bases of DNA loops [for reviews see Razin et al. (9) and Mirkovitch et al. (10)]. Nuclear scaffold or matrix attachment regions [SARs (11) or MARs (12)] are frequently considered as DNA loop attachment sequences; however, experimental data questioning this supposition have been presented (13). We have developed a protocol for mapping DNA loop attachment regions which is based on excision of loops mediated by nuclear matrix-bound topoisomerase II (14–16). The attachment regions mapped by the topoisomerse II-mediated DNA loop excision procedure do not necessarily contain MARs/SARs (16). In addition, many MARs/SARs are present in DNA loops mapped by the above protocol [i.e. outside attachment regions (17)]. Although there are strong arguments supporting validity of the topoisomerase II-mediated DNA loop excision protocol, it has not yet been established whether DNA loops mapped using this protocol correspond to those seen under the microscope. This is also true for all other biochemical protocols used so far for mapping loops.
The objective of the present work was to compare directly the DNA loops mapped by our biochemical approach with those visualized by microscopy. We present a domain map of an extended genomic area which includes the major part of the human dystrophin gene, and show for the first time that DNA loops mapped by topoisomerase II-mediated excision do correspond to the loops that can be visualized by hybridization of specific probes with nuclear halos. We also show that a single transcription unit may be organized into several DNA loops. Furthermore, we found that the major deletion hot spot in the dystrophin gene is located in one of the loop attachment regions.
MATERIALS AND METHODS
Cell culture
Human erythroleukemia cells HEL 92.1.7 (ATCC) were grown in RPMI 1640 medium supplemented with 10% fetal bovine serum.
Mapping of DNA loop attachment regions using topoisomerase II-mediated DNA loop excision
The protocol for topoisomerase II-mediated DNA loop excision was described previously (16,17). Briefly, cells were collected by centrifugation and embedded into blocks of 1.5% low-melting agarose prepared in PBS buffer. To permeabilize cells and extract them with 2 M NaCl, blocks with embedded cells were incubated in a buffer containing 0.2% Nonidet P-40 (NP-40), 2 M NaCl, 2 mM EDTA, 1 mM phenylmethylsulphonyl fluoride (PMSF), 20 mM Tris–HCl (pH 7.5) for 1 h at 4°C. The blocks were then washed three times (30 min each) at 4°C in a buffer containing 20 mM Tris–HCl (pH 7.5), 0.1 mM EDTA, 50 mM KCl, 10 mM MgCl2. After washing, they were placed in the same solution supplemented with VM-26 (dimethylepipodophyllotoxinthenylidene-β-d-glucoside) (20–50 µg/ml) and incubated for 40 min at 25°C. To cleave DNA by topoisomerase II in vivo, agarose blocks with embedded living cells were incubated for 30 min at 37°C in RPMI 1640 medium supplemented with VM-26 (10–50 µg/ml) as described (16). In both cases, after incubation with VM-26 the agarose blocks were placed into stop buffer [1% SDS, 0.4 M EDTA (pH 8.0), 0.5 mg/ml proteinase K (Merck)] and digestion was carried out for 36 h at 55°C with constant gentle rotation. The blocks were then washed with 0.2 M EDTA. Digestion by SfiI of DNA embedded in agarose blocks was carried out as described in the Bio-Rad manual for pulsed field gel electrophoresis (PFGE). PFGE was carried out in a Bio-Rad CHEF DR-II system in 0.5× TBE-buffer at 14°C for 18–22 h at a voltage gradient of 6 V/cm with the switch time ramped linearly from 10 to 90 s or, in some experiments, from 1 to 30 s. Concatemers of λ DNA were used as markers. Alkaline transfer of DNA to Hybond N+ membranes (Amersham) and hybridization were carried out as described in the manufacturer’s manual.
Hybridization probes for indirect end-labeling were prepared by PCR using the primer pairs listed in Table 1 and labeled with [α-32P]dCTP using Megaprime kits (Amersham).
Table 1. Primers for PCR-derived probes to detect restriction fragments on PFGE gels.
| Fragment | Primer pairs | Length (bp) |
|---|---|---|
| BC, right end | 5′-GTACATGATGGATTTGACAGC-3′ | 165 |
| (exon 11) | 3′-CATGCTAGCTACCCTGAGGC-5′ | |
| CD, right end | 5′-CAGTCACTTGAAAATTTGATGCGAC-3′ | 153 |
| (exon 29) | 3′-CTCTTCATGTAGTTCCCTCCAACGA-5′ | |
| DE, right end | 5′-AATAGGAAATTGATCGGGAATTGC-3′ | 144 |
| (exon 41) | 3′-GCCAGTAACAACTCACAATT-5′ | |
| EF, left end | 5′-GAATATAAAAGATAGTCTACAACA-3′ | 175 |
| (exon 43) | 3′-CCCTTGTCGGTCCTTGTAC-5′ | |
| FG, right end | 5′-TTCAGAATCAGTGGGATGAA-3′ | 165 |
| (exon 54) | 3′-TATAGGGACCCTCCTTCCAT-5′ |
Preparation of nuclear halos
Cells were pelleted (700 g, 5 min), washed twice with RPMI medium and resuspended in permeabilization buffer [10 mM PIPES (pH 7.8), 100 mM NaCl, 3 mM MgCl2, 0.5 mM PMSF, 0.1 mM CuSO4, 300 mM sucrose and 0.5% (v/v) Triton X-100] at a final concentration of 2 × 10⁶ cells/ml. After 4 min incubation on ice, the cells were pelleted onto silane-coated microscope slides using a Cytospin centrifuge. The cells on the slides were then treated (4 min at 0°C) with high-salt solution [2 M NaCl, 10 mM PIPES (pH 6.8), 10 mM EDTA, 0.05 mM spermine, 0.125 mM spermidine, 0.1% (w/v) digitonin]. The slides were then sequentially washed (1 min each wash) with 10×, 5×, 2× and 1× PBS and then with 10, 30, 70 and 96% ethanol, air-dried, fixed in methanol–acetic acid (3:1) mixture, and dried at 70°C for 1 h.
Hybridization in situ, immunolabeling and microscopy
Nuclear halos were treated sequentially with RNase A (100 µg/ml in 2× SSC) and pepsin (0.01% in 10 mM HCl), post-fixed with 1% paraformaldehyde, and rinsed sequentially in 70, 80 and 96% ethanol. To denature DNA the slides were incubated in 70% formamide, 2× SSC for 5 min at 74°C, dehydrated in cold 70, 80 and 96% ethanol and air-dried.
Most probes for in situ hybridization were prepared by PCR using the primer pairs listed in Table 2. BAC clone from the human male BAC library RPCI-11 (clone 662G16) which contains an insert from the dystrophin gene was from the Children’s Hospital Oakland Research Center, Oakland, CA. A probe specific for the human X chromosome alphoid satellite (18) was kindly given by Y.B.Yurov. Probes were labeled with biotin-16-dUTP using a random-prime labeling kit (Roche). The hybridization mixture contained (in a final volume of 10 µl) 50% (v/v) formamide, 2× SSC, 10% dextran sulphate, 0.1% Tween-20, 10 µg sonicated salmon sperm DNA, 10 µg yeast tRNA and 25–50 ng of labeled probe. In some experiments human Cot1 DNA (Sigma) was added as described in the Results. Before hybridization, the mixture was incubated for 10 min at 74°C to denature DNA. In experiments with the addition of Cot1 DNA, the denaturation was followed by incubation at 37°C for 1 h. Hybridization was carried out overnight at 40–45°C. After hybridization the samples were washed twice in 50% formamide, 2× SSC at 43–48°C for 20 min.
Table 2. Primers for PCR-derived probes for in situ hybridization.
| Probe for | Primer pairs | Length (bp) |
|---|---|---|
| Loop 1 | 5′-GCCTAAAAAGTGTTTCAATAGAGG-3′ | 2019 |
| 3′-AAAGTCGACCTGATGTGAAATCC-5′ | ||
| AR 3 | 5′-AATAATTGGACATTTCTCTCGCTAG-3′ | 2334 |
| 3′-ATTTAGAGAGGGAAAGCCTTTCAA-5′ | ||
| Loop 3 | 5′-GGCAGTGCCCTTTGGGTATTTCT-3′ | 2749 |
| 3′-CGAGCCTGCCATGAGTTTAAAAT-5′ | ||
| AR 4 | 5′-ATTAATCCTAATGCTACAGCTTCAG-3′ | 4125 |
| 3′-AAATGATAGCCCCTGCATAGACAG-5′ | ||
| AR 5 | 5′-TGTGTTTGAATGAAGAGAAAGGCA-3′ | 5012 |
| 3′-GGACCATTAATGGGACTTAGAAAT-5′ | ||
| AR 7 | 5′-ACTATAATACCATATAGGCAATGCC-3′ | 2118 |
| 3′-GATAAATGAGGGGAATGCTGATTT-5′ | ||
| Loop 7 | 5′-AAAGATGAGCTTTTCCATGCTAGT-3′ | 3858 |
| 3′-AGTAGAAAGGTTTATCCCAGGCCA-5′ | ||
| AR 8 | 5′-ATTTGTTAAAAGTTAGCCCCTCCA-3′ | 3779 |
| 3′-TTACCAAATCTGTTCCTCTTCCTA-5′ |
AR, attachment region.
Biotinylated probes were visualized using anti-biotin monoclonal antibodies conjugated with Alexa 488 (Molecular Probes) with subsequent signal amplification using an Alexa 488 signal amplification kit for mouse antibodies (Molecular Probes). When hybridization with biotinylated BAC 662G16 DNA or fragments of this insert were carried out, two additional layers of antibodies (chicken anti-goat and goat anti-chicken) both conjugated with Alexa 488 were used. DNA was stained with DAPI (4′,6-diamidino-2-phenylindole). The results were examined under a fluorescence microscope (Axioplan Opton) and recorded using a cooled CCD camera (AT200, Photometrics, Tucson, AZ). The contour length of DNA loops on images was measured using the program Scion Image, version 4 beta.
RESULTS
Mapping the organization of the human dystrophin gene into DNA loop domains by topoisomerase II-mediated loop excision
The human dystrophin gene spans almost 2.5 Mb on the short arm of the X chromosome (Xp21) (19,20). In female cells one copy of the X chromosome is inactive, and it is not clear whether the organization of the dystrophin gene into loop domains in active and inactive copies is identical. In order to facilitate the interpretation of the results we therefore used HEL 92.1.7 cells derived from a male patient. We first studied the partitioning of the dystrophin gene into loop domains using the topoisomerase II-mediated DNA loop excision method (15,16,18). The principle of this method is that in high salt-extracted nuclei only the DNA loop attachment sites constitute targets for cleavage by topoisomerase II of the nuclear matrix/chromosomal scaffold (21,22). Permeabilized cells are extracted with 2 M NaCl and incubated with the specific topoisomerase II religation inhibitor VM-26, which traps this enzyme at its sites of action and causes DNA cleavage upon deproteinization (15–18). The sites of cleavage are deduced from the length of truncated restriction fragments determined by indirect end-labeling. DNA between the cleavage regions is thought to be looped out (15,16). Importantly, it has been demonstrated that the same genomic regions constitute major targets for topoisomerase II-mediated cleavage both in high salt-extracted nuclei and in living cells (15,16), suggesting strongly that the contacts of DNA with topoisomerase II of the nuclear matrix that can be mapped in high salt-extracted nuclei pre-exist in living cells. It is also of importance that attachment regions mapped by this protocol do not necessarily correlate with transcribed regions; thus in the ribosomal gene repeat of Chinese hamster ovary cells the single attachment region is localized in the non-transcribed spacer (15), and hence cannot represent an area of DNA contact with the nuclear matrix that originates as an artefact due to precipitation of transcription complexes in the course of high-salt extraction (15).
In the present study, DNA loop attachment regions were mapped relative to SfiI restriction sites using DNA fragments separated by PFGE, as described previously (16,17,23) (Fig. 1). Most of the hybridization probes were PCR-derived fragments representing exons located close to the SfiI sites, and fragment AB was probed with the insert of a λ phage recombinant clone covering SfiI site B (24). Results of mapping experiments are shown in Figure 1. Some of the attachment regions in the dystrophin gene, notably attachment regions 3, 5 and 8, appeared to extend over more than a hundred kb as judged by the length heterogeneity of the truncated fragments; we believe that this heterogeneity reflects inability to induce complete cleavage by topisomerase II within a long attachment region (see Fig. 1C, right scheme), because the fragment lengths become more homogeneous as the concentration of VM-26 increases (Fig. 1) (see Discussion). This was expected from previous results and seems to be a characteristic feature of DNA loops in AT-rich isochores (25). Two observations argue against the suggestion that areas of distributed hybridization simply represent smears originating as a result of non-specific DNA degradation. First, the sizes of extended hybridizing areas vary depending on the probe used. At the same time, in no case does the distribution of hybridizing material in wide areas reflect distribution of DNA as revealed by ethidium bromide staining (Fig. 1B). Thus it is more likely that areas of distributed hybridization reflect the existence of extremely long attachment regions, as shown in the scheme in Figure 1C (right side).
Figure 1.

Mapping DNA loops and attachment regions in the human dystrophin gene by DNA cleavage mediated by nuclear matrix-bound topoisomerase II. (A) Map of the gene with distances in kb and SfiI sites indicated by letters. Horizontal arrowheads indicate positions and directions of probes used to detect the six SfiI fragments AB, BC, CD, DE, EF and FG on PFGE gels. Loop attachment regions deduced from the truncation positions are shown on the map by the horizontal lines (1–8). (B) Separation of the products of topoisomerase II-mediated DNA cleavage by PFGE (left) and detection of SfiI fragments by hybridization. Left lanes show λ DNA oligomers, asterisks the 100 kb marker, and lanes C are DNA from control samples not treated with VM-26. Full-length SfiI fragments are indicated by open arrowheads and fragments truncated due to topoisomerase II cleavage by the numbers 1–8. The boxed insert (EF in vivo) shows cleavage of fragment EF by topoisomerase II in living cells. (C) Schematic depiction of the excision of DNA loops by nuclear matrix-bound topoisomerase II. SfiI fragments are shown in bold, topoisomerase II cleavage sites by arrows, and hybridization probes by arrowheads. The resulting DNA fragments are separated by PFGE and truncated fragments are detected by hybridization (below). A longer attachment region (right) could cause a heterogeneous cleavage pattern such as that causing the wide hybridizing band in panel EF.
It may be of interest that a reasonably good correlation between the positions of attachment regions and recombination-prone regions in the dystrophin gene was observed. Thus, attachment region 5 harbors the major deletion hot spot of the gene (26).
Although the identity of the target regions for topoisomerase II-mediated DNA cleavage in living cells and in permeabilized high-salt extracted cells has been established previously in several models, we confirmed this conclusion for the region FG that was of particular interest for the present study. The results in the insert in Figure 1B show that in this case also, the patterns of topoisomerase II-mediated DNA cleavage in living cells and in high-salt extracted cells are essentially identical. The rationales for this similarity have been discussed previously along with other arguments for the validity of this method (15,16).
Visualization by in situ hybridization of DNA sequences located in loops or loop attachment regions
Although the protocol for mapping attachment regions by topoisomerase II-mediated loop excision is supported by much evidence (15), it was not yet demonstrated directly that DNA regions mapped as loops using this protocol are identical to those that are seen by microscopy to be looped out in high-salt-extracted nuclei. To examine this correlation we hybridized specific probes from the loop and attachment regions observed in Figure 1 with nuclear halos, which represent the crown of extended DNA loops fixed at the nuclear matrix and visible by microscopy (27–31). The dimensions of halos have been used widely as a simple experimental approach to estimate the sizes of DNA loops (27,28), and visualization of specific DNA sequences on halos by hybridization opens the possibility to study their partitioning between matrix-bound and looped-out DNA fractions (29–31).
Nuclear halos were prepared as described (30) with slight modifications (see Materials and Methods). Their size depends on the concentration of Cu++ ions in the buffer at the step of histone removal, and we carried out a set of preliminary experiments aimed to find the most reproducible conditions for preparation of halos from HEL cells. Three parameters were taken into consideration: the preservation of the central core region as inspected after immunostaining of lamin A (Fig. 2A and B), the average radius of the halo as measured after staining with DAPI, and the distance at which the X chromosome-specific alphoid satellite (alphX) was extended from the core. Within certain limits of Cu++ concentration the ratio (radius of alphX/radius of halo) was reasonably constant (0.493 ± 0.047, n = 139) and we selected conditions (0.1 mM Cu++) permitting maximal halos to be observed while the above ratio was kept constant. Typical images of halos and signals from the alphX probe are shown in Figure 2.
Figure 2.
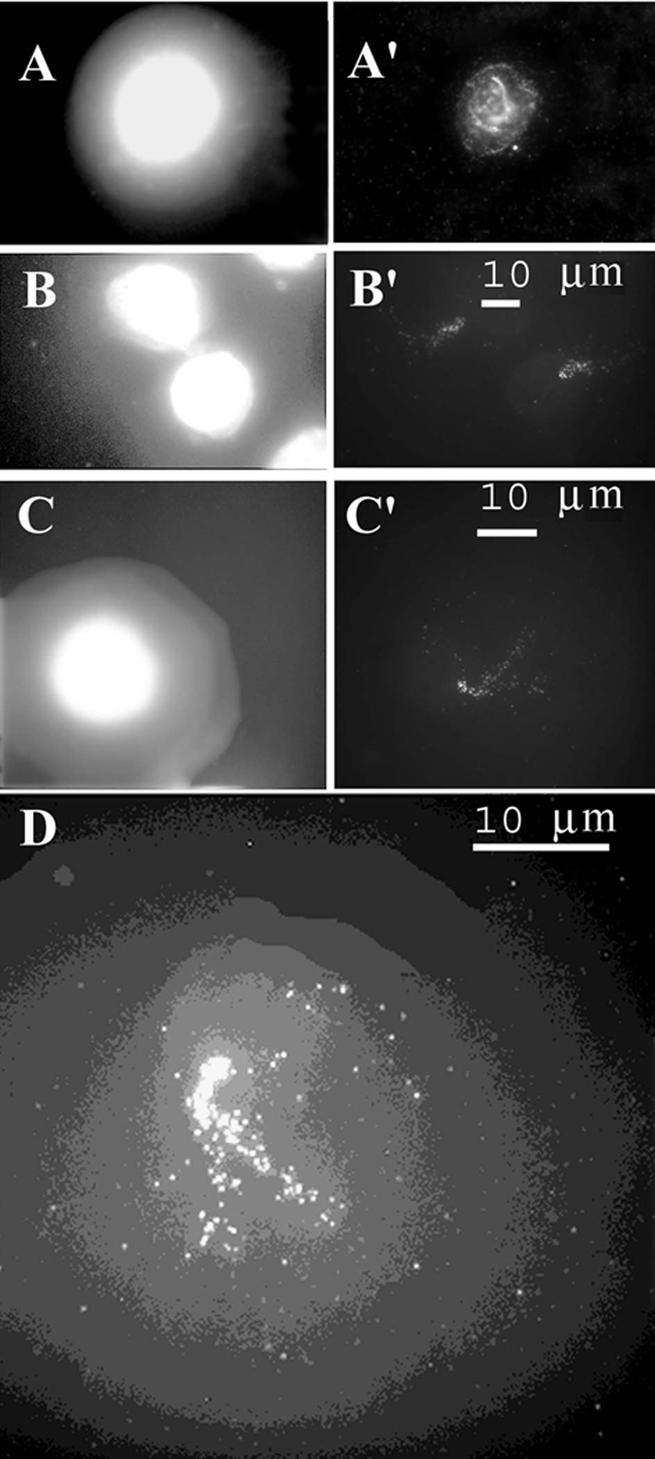
Nuclear halos immunolabeled with an antibody against lamin A (A′) or hybridized in situ with an X chromosome-specific alphoid satellite probe (alphX) (B′, C′). (A–C) DNA stained with DAPI. (D) Superposition of DAPI staining and the alphX hybridization signal; the DAPI image is discriminated into 20 intensity levels in order to facilitate precise positioning of the alphX signal.
Short PCR-derived probes representing either loops or attachment regions as observed in Figure 1 were then hybridized with halo preparations and signals over the core or halo region were quantitated. DNA loops could fold over the core region when the three-dimensional nuclear matrix with extended loops was transformed into a two-dimensional form in the course of halo preparation, and hence probes for loop DNA could appear over the core but probes for attachment regions could not appear over the halo. We inspected ∼100 halos for each probe, and signals were considered as showing attachment regions when ∼90% were over the core region or loops when >75% were over the halo region; intermediate signal distributions were not observed (Table 3). A probe from attachment area 8 produced a single signal located almost exclusively within the core region, as predicted (Fig. 3A and A′). In contrast, a short probe from the central part of loop 7 produced signals localized for the most part in the halo far from the core (Fig. 3B and B′); hybridization within the core was detected in only 19% of the nuclei and was obviously due to the unfavorable folding of DNA loops, as discussed above. The difference in hybridization patterns of loop and attachment region probes is also clearly seen at low magnification when several nuclei can be inspected simultaneously (Fig. 3C and D). Short probes for several other attachment regions or loops mapped by topoisomerase II-mediated cleavage hybridized to cores or halos, respectively (Fig. 4 and Table 3).
Table 3. Distribution of hybridization signals over nuclear cores or loop halos.
| Probe | Number of nuclei | % of signals over core | % of signals over halo |
|---|---|---|---|
| AR 8 | 100 | 93 | 7 |
| Loop 7 | 100 | 19 | 81 |
| AR 7 | 120 | 89 | 11 |
| AR 5 | 90 | 91 | 9 |
| AR 4 | 100 | 94 | 6 |
| Loop 3 | 140 | 23 | 77 |
| AR 3 | 100 | 91 | 9 |
| Loop 1 | 120 | 20 | 80 |
Figure 3.

Nuclear halos hybridized with probes derived from attachment region 8 (A′ and C) or from loop 7 (B′ and D) shown in Figure 1. (A and B) DNA stained with DAPI; (A′ and B′) Hybridization signals (arrows). (A” and B”) Superposed images; hybridization signals are seen as black spots (arrows) over light halos. (C and D) Lower magnification images showing hybridization of the attachment region (C) or loop probe (D); signals are seen as black spots (arrows) over light halos.
Figure 4.
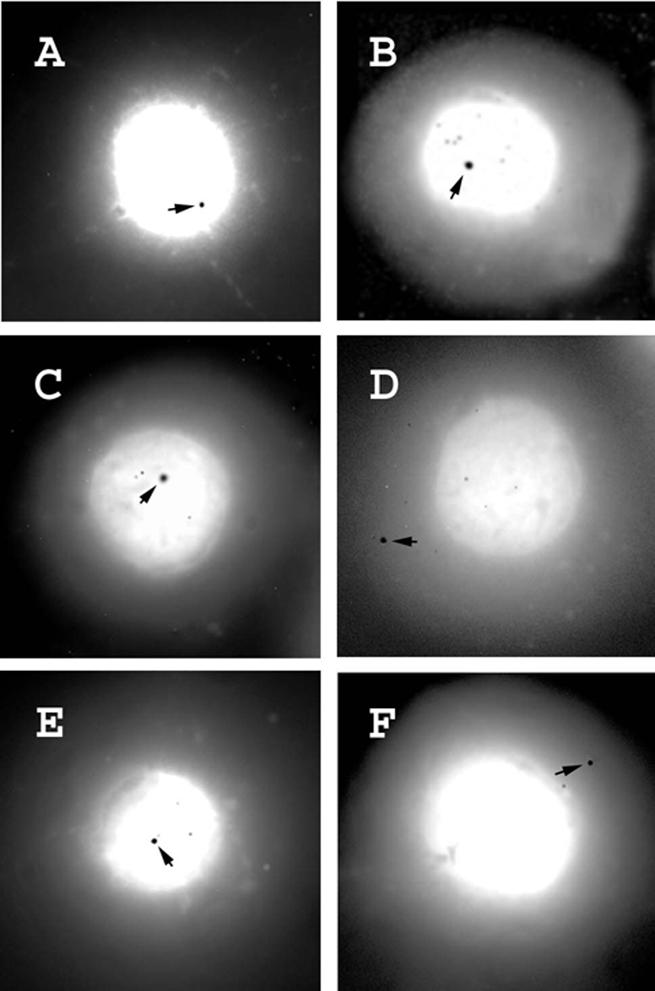
Nuclear halos hybridized with probes derived from attachment regions 7 (A), 5 (B), 4 (C), or from loop 3 (D), attachment region 3 (E) or loop 1 (F). Superposition of hybridization signals and DAPI staining is shown as described in Figure 3.
We conclude from the data summarized in Table 3 that in situ hybridization on nuclear halos confirms the identification of loop or attachment region DNA as defined by topoisomerase II-mediated loop excision.
Visualization of an individual DNA loop in the dystrophin gene
With the aim of visualizing an individual loop, we used as probe a BAC clone which contains an insert of ∼220 kb covering the predicted DNA loop between attachment regions 7 and 8 (Fig. 1). When this probe was hybridized in the absence of Cot1 DNA, an intense labeling of the whole halo was observed (Fig. 5A′) as predicted because the insert in this BAC contains a large number of repetitive elements. The signals originating from these repetitive elements were efficiently competed when a 100–500× excess (w/w) of human Cot1 DNA was added to the reaction mixture.
Figure 5.

DNA loops containing a region of the dystrophin gene. (A–F) DNA stained with DAPI; (A′–F′) results of hybridization. (A′) Hybridization of the BAC 662G16 probe, which contains a ∼220 kb insert covering the predicted DNA loop between attachment regions 7 and 8 (Fig. 1) in the absence of human Cot1 DNA; (B′–F′) hybridization of the same probe with a 500× (w/w) excess of human Cot1 DNA. (B”–F”) The paths of DNA loops used to measure lengths; both loops and attachment regions were taken into consideration.
In these conditions, single DNA loops became clearly visible; representative images are shown in Figure 5B′–E′. Such bona fide U-shaped loops were seen in 14% of 200 nuclei inspected, and broken loops in 47% (Fig. 5F′). In 28% of the nuclei the signals were distributed in a disordered fashion over both the core and halo (for example, the right nucleus in Fig. 5C′), which is likely to result from distortion of the halo in the course of preparation and/or from an unfavorable loop position on the plane surface of the slide. No signals were detected in 11% of the nuclei, and this percentage was much higher when short probes were used (Table 3). We conclude that the DNA loops visualized in Figure 5B′–E′ represent the loop flanked by attachment regions 7 and 8 as mapped by topoisomerase II-mediated cleavage (Fig. 1).
The average length of 20 clearly identifiable loops, measured by tracing their contour as shown in Figure 5B”–E”, was 65.0 µm with a SD of 20.3 µm. The length of a fully extended DNA loop of 220 kb should be ∼65 µm, and our measured length fits this value perfectly. Other researchers have reported that the apparent length of DNA in nuclear halos is only 50–75% of that of fully extended DNA (30); the difference between these results and ours may be due to the fact that only short stretches of DNA (15 kb) were measured in previous work while we measured a length of 220 kb.
DISCUSSION
The results presented here clearly demonstrate (i) the specificity of the organization of genomic DNA into loops and (ii) the validity of the protocol for mapping loops by topoisomerase II-mediated excision. The DNA loop in the dystrophin gene mapped using this protocol could be visualized directly by in situ hybridization of specific probes with nuclear halos. The validity of the map of the spatial organization of this gene constructed using topoisomerase II-mediated loop excision was confirmed using in situ hybridization with probes representing other attachment regions and loops. Although individual DNA loops extending from the nuclear matrix or scaffold were observed in previous investigations (31,32), no attempt had been made before now to correlate these data with the results of loop mapping by biochemical approaches. Furthermore, although it has been proposed that the specificity of DNA organization into loops in interphase chromosomes is flexible and simply reflects partitioning of the genome into transcribed and non-transcribed regions (31), the dystrophin gene is not transcribed in the erythroid cells used in our study (data not shown) and hence, at least in this case, mechanisms that are not directly related to transcription are responsible for organization and maintaining of DNA loop attachment sites.
The lengths of loop attachment regions 3, 5 and 8, which is >100 kb as seen by the breadth of the hybridizing bands of fragments truncated by topoisomerase II cleavage (Fig. 1), are at first view unexpectedly large. We believe that this apparent length reflects the existence of long regions of DNA attachment to the nuclear matrix and inability to obtain complete cleavage by the enzyme, because the length distribution of these fragments becomes more homogeneous as the concentration of VM-26 increases. Similar incomplete cleavage has been observed in other regions (23,25). Alternatively, the cell population could be heterogeneous with different attachment sites being selected from a region of potential attachment in different cells and/or at different times in the cell cycle. It should be mentioned, however, that the existence of long attachment regions is in perfect agreement with the intense DAPI staining of the core region of nuclear halos (nuclear matrix) observed by us and by others [see, for example, figures 1 and 3 in Gerdes et al. (30)].
The map of dystrophin gene organization into loop domains presented in this paper is interesting from several points of view. It demonstrates clearly that a single transcription unit may be organized into several loops and thus that the attachment regions do not constitute barriers for transcription. It is also of interest that three out of four replication origins previously mapped in this gene (33) co-localize with loop attachment regions 3, 5 and 7 (Fig. 1) within the limits of resolution of the corresponding methods. Loop attachment region 5 harbors the major deletion hot spot of the dystrophin gene (26,34). In this context it may be of interest that a recombination hot spot in the vicinity of the Chinese hamster gene GNA3 (also in an AT-rich isochore) was found to reside in a loop attachment region (25). Our findings may eventually help to explain the nature of recombination hot spots in the dystrophin gene. In particular, the possibility that preferential recombination between MARs results in the loss of individual loops (35) deserves further analysis.
Acknowledgments
ACKNOWLEDGEMENTS
We thank A.S.Sobolev, P.V.Gulak and A.A.Rozenkranz for help with fluorescence microscopy and R.Warton for encouragement and help when this project was initiated. This work was supported by the Presidium of the Russian Academy of Sciences (grant for Molecular and Cellular Biology), the Science Support Foundation (grant to talented young researchers), the Russian Foundation for Basic Research (grants 02-04-48369 and 03-04648627) and the Canadian Institutes of Health Research (grant MOP-14351).
REFERENCES
- 1.Nakao M. (2001) Epigenetics: interaction of DNA methylation and chromatin. Gene, 278, 25–31. [DOI] [PubMed] [Google Scholar]
- 2.Strauss F. and Varshavsky,A. (1984) A protein binds to a satellite DNA repeat at three specific sites that would be brought into mutual proximity by DNA folding in the nucleosome. Cell, 37, 889–901. [DOI] [PubMed] [Google Scholar]
- 3.de Laat W. and Grosveld,F. (2003) Spatial organization of gene expression: the active chromatin hub. Chromosome Res., 11, 447–459. [DOI] [PubMed] [Google Scholar]
- 4.Adolph K.W., Chang,S.M. and Laemmli,U.K. (1977) Role of nonhistone proteins in metaphase chromosomes structure. Cell, 12, 805–816. [DOI] [PubMed] [Google Scholar]
- 5.Paulson J.R. and Laemmli,U.K. (1977) The structure of histone-depleted metaphase chromosomes. Cell, 12, 817–828. [DOI] [PubMed] [Google Scholar]
- 6.Marsden M.P. and Laemmli,U.K. (1979) Metaphase chromosome structure: evidence for a radial loop model. Cell, 17, 849–858. [DOI] [PubMed] [Google Scholar]
- 7.Earnshaw W.C. and Laemmli,U.K. (1983) Architecture of metaphase chromosomes and chromosome scaffolds. J. Cell Biol., 96, 84–93. [DOI] [PMC free article] [PubMed] [Google Scholar]
- 8.Heng H.H., Krawetz,S.A., Lu,W., Bremer,S., Liu,G. and Ye,C.J. (2001) Re-defining the chromatin loop domain. Cytogenet. Cell. Genet., 93, 155–161. [DOI] [PubMed] [Google Scholar]
- 9.Razin S.V., Gromova,I.I. and Iarovaia,O.V. (1995) Specificity and functional significance of DNA interaction with the nuclear matrix: New approaches to clarify the old questions. Int. Rev. Cytol., 162B, 405–448. [DOI] [PubMed] [Google Scholar]
- 10.Razin S.V. (2001) The nuclear matrix and chromosomal DNA loops: is there any correlation between partitioning of the genome into loops and functional domains. Cell. Mol. Biol. Lett., 6, 59–69. [PubMed] [Google Scholar]
- 11.Mirkovitch J., Mirault,M.-E. and Laemmli,U.K. (1984) Organization of the higher-order chromatin loop: specific DNA attachement sites on nuclear scaffold. Cell, 39, 223–232. [DOI] [PubMed] [Google Scholar]
- 12.Cockerill P.N. and Garrard,W.T. (1986) Chromosomal loop anchorage of the kappa immunoglobulin gene occurs next to the enhancer in a region containing topoisomerase II sites. Cell, 44, 273–282. [DOI] [PubMed] [Google Scholar]
- 13.Hempel K. and Stratling,W.H. (1996) The chicken lysozyme gene 5′ MAR and the Drosophila histone SAR are electroelutable from encapsulated and digested nuclei. J. Cell Sci., 109, 1459–1469. [DOI] [PubMed] [Google Scholar]
- 14.Razin S.V., Petrov,P. and Hancock,R. (1991) Precise localization of the α-globin gene cluster within one of the 20- to 300-Kilobase DNA fragment released by cleavage of chicken chromosomal DNA at topoisomerase II site in vivo: evidence that the fragment are DNA loops or domains. Proc. Natl Acad. Sci. USA, 88, 8515–8519. [DOI] [PMC free article] [PubMed] [Google Scholar]
- 15.Razin S.V., Hancock,R., Iarovaia,O., Westergaard,O., Gromova,I. and Georgiev,G.P. (1993) Structural-functional organization of chromosomal DNA domains. Cold Spring Harbor Symp. Quant. Biol., 58, 25–35. [DOI] [PubMed] [Google Scholar]
- 16.Gromova I.I., Thomsen,B. and Razin,S.V. (1995) Different topoisomerase II antitumour drugs direct similar specific long-range fragmentation of an amplified c-myc gene locus in living cells and in high salt-extracted nuclei. Proc. Natl Acad. Sci. USA, 92, 102–106. [DOI] [PMC free article] [PubMed] [Google Scholar]
- 17.Iarovaia O., Hancock,R., Lagarkova,M., Miassod,R. and Razin,S.V. (1996) Mapping of genomic DNA loop organization in a 500-kilobase region of the Drosophila X chromosome by the topoisomerase II-mediated DNA loop excision protocol. Mol. Cell. Biol., 16, 302–308. [DOI] [PMC free article] [PubMed] [Google Scholar]
- 18.Yurov Y.B., Soloviev,I.V., Vorsanova,S.G., Marcais,B., Roizes,G. and Lewis,R. (1996) High resolution multicolor fluorescence in situ hybridization using cyanine and fluorescein dyes: rapid chromosome identification by directly fluorescently labeled alphoid DNA probes. Hum. Genet., 97, 390–398. [DOI] [PubMed] [Google Scholar]
- 19.Nobile C. and Marchi,J. (1994) A refined restriction map of YAC clones spanning the entire human dystrophin gene. Mamm. Genome, 5, 566–571. [DOI] [PubMed] [Google Scholar]
- 20.Den Dunnen J.T., Grootscholten,P.M., Dauwerse,J.G., Walker,A.P., Monaco,A.P., Butler,R., Anand,R., Coffey,A.J., Bentley,D.R., Steensma,H.Y. et al. (1992) Reconstruction of the 2.4 Mb human DMD-gene by homologous YAC recombination. Hum. Mol. Genet., 1, 19–28. [DOI] [PubMed] [Google Scholar]
- 21.Berrios M., Osheroff,N. and Fischer,P.A. (1985) In situ localization of DNA topoisomerase II, a major polypeptide component of the Drosophila nuclear matrix fraction. Proc. Natl Acad. Sci. USA, 82, 4142–4146. [DOI] [PMC free article] [PubMed] [Google Scholar]
- 22.Earnshaw W.C., Halligan,B., Cooke,C.A., Heck,M.M.S. and Liu,L.F. (1985) Topoisomerase II is a structural component of mitotic chromosome scaffolds. J. Cell Biol., 100, 1706–1715. [DOI] [PMC free article] [PubMed] [Google Scholar]
- 23.Fajkus J., Nicklas,J.A. and Hancock,R. (1998) DNA loop domains in a 1.4-Mb region around the human hprt gene mapped by cleavage mediated by nuclear matrix-associated topoisomerase II. Mol. Gen. Genet., 260, 410–416. [DOI] [PubMed] [Google Scholar]
- 24.Whittaker P.A., Wood,L., Mathrubutham,M. and Anand,R. (1993) Generation of ordered phage sublibraries of YAC clones: construction of a 400-kb phage contig in the human dystrophin gene. Genomics, 15, 453–456. [DOI] [PubMed] [Google Scholar]
- 25.Svetlova E.Y., Razin,S.V. and Debatisse,M. (2001) Mammalian recombination hot spot and DNA loop anchorage region: a model for the study of common fragile sites. J. Cell. Biochem., S36, 170–178. [DOI] [PubMed] [Google Scholar]
- 26.Gillard E.F., Chamberlain,J.S., Murphy,E.G., Duff,C.L., Smith,B., Burghes,A.H., Thompson,M.W., Sutherland,J., Oss,I., Bodrug,S.E. et al. (1989) Molecular and phenotypic analysis of patients with deletions within the deletion-rich region of the Duchenne muscular dystrophy (DMD) gene. Am. J. Hum. Genet., 45, 507–520. [PMC free article] [PubMed] [Google Scholar]
- 27.Buongiorno-Nardelli M., Gioacchino,M., Carri,M.T. and Marilley,M. (1982) A relationship between replicon size and supercoiled loop domains in the eukaryotic genome,. Nature, 298, 100–102. [DOI] [PubMed] [Google Scholar]
- 28.Aelen J.M., Opstelsten,R.J. and Wanka,F. (1983) Organization of DNA replication in Physarum polycephalum. Attachment of origins of replication and replication forks to the nuclear matrix. Nucleic Acids Res., 11, 1181–1195. [DOI] [PMC free article] [PubMed] [Google Scholar]
- 29.Balajee A.S., Dominguez,I., Bohr,V.A. and Natarajan,A.T. (1996) Immunofluorescent analysis of the organization of telomeric DNA sequences and their involvement in chromosomal aberrations in hamster cells. Mutat. Res., 372, 163–172. [DOI] [PubMed] [Google Scholar]
- 30.Gerdes M.G., Carter,K.C., Moen,P.T.J. and Lawrence,J.B. (1994) Dynamic changes in the higher-level chromatin organization of specific sequences revealed by in situ hybridization to nuclear halos. J. Cell Biol., 126, 289–304. [DOI] [PMC free article] [PubMed] [Google Scholar]
- 31.Ratsch A., Joos,S., Kioschis,P. and Lichter,P. (2002) Topological organization of the MYC/IGK locus in Burkitt’s lymphoma cells assessed by nuclear halo preparations. Exp. Cell Res., 273, 12–20. [DOI] [PubMed] [Google Scholar]
- 32.Bickmore W.A. and Oghene,K. (1996) Visualizing the spatial relationships between defined DNA sequences and the axial region of extracted metaphase chromosomes. Cell, 84, 95–104. [DOI] [PubMed] [Google Scholar]
- 33.Verbovaia L.V. and Razin,S.V. (1997) Mapping of replication origins and termination sites in the duchenne muscular dystrophy gene. Genomics, 45, 24–30. [DOI] [PubMed] [Google Scholar]
- 34.Wapenaar M.C., Kievits,T., Hart,K.A., Abbs,S., Blonden,L.A.J., den Dunnen,J.T.P., Grootscholten,M., Bakker,E., Verellen-Dumoulin,C., Bobrow,M. et al. (1988) A deletion hot spot in the Duchenne muscular dystrophy gene. Genomics, 2, 101–108. [DOI] [PubMed] [Google Scholar]
- 35.Razin S.V. (1999) Chromosomal DNA loops may constitute basic units of the genome organization and evolution. Crit. Rev. Eukaryot. Gene Expr., 9, 279–283. [DOI] [PubMed] [Google Scholar]